| Param | Original file | Final file |
|---|---|---|
| Filename | modeM0/AS1G04_002T02_9000000230_01346cztM0_level2.evt | modeM0/AS1G04_002T02_9000000230_01346cztM0_level2_quad_clean.evt |
| Size (bytes) | 1,056,844,800 | 104,921,280 |
| Size | 1007.9 MB | 100.1 MB |
| Events in quadrant A | 7,887,551 | 681,633 |
| Events in quadrant B | 8,535,474 | 694,895 |
| Events in quadrant C | 7,638,885 | 685,143 |
| Events in quadrant D | 7,506,863 | 655,597 |
| Mode M9 | |||
|---|---|---|---|
| Quadrant | BADHDUFLAG | Total packets | Discarded packets |
| A | 0 | 21 | 0 |
| B | 0 | 21 | 0 |
| C | 0 | 21 | 0 |
| D | 0 | 22 | 0 |
| Mode M0 | |||
|---|---|---|---|
| Quadrant | BADHDUFLAG | Total packets | Discarded packets |
| A | 0 | 28129 | 3 |
| B | 0 | 30042 | 2 |
| C | 0 | 27412 | 2 |
| D | 0 | 27043 | 2 |
| Mode SS | |||
|---|---|---|---|
| Quadrant | BADHDUFLAG | Total packets | Discarded packets |
| A | 0 | 134 | 0 |
| B | 0 | 134 | 0 |
| C | 0 | 134 | 0 |
| D | 0 | 134 | 0 |
| Quadrant | Total seconds | Saturated seconds | Saturation percentage |
|---|---|---|---|
| A | 6602 | 37 | 0.560436% |
| B | 6602 | 33 | 0.499849% |
| C | 6602 | 4 | 0.060588% |
| D | 6602 | 96 | 1.454105% |
Noise dominated data is calculated using 1-second bins in cleaned event files. If a bin has >2000 counts, and if more than 50% of those come from <1% of pixels, then it is considered to be noise-dominated and hence unusable.
| Quadrant | # 1 sec bins | Bins with >0 counts | Bins with >2000 counts | High rate bins dominated by noise | Noise dominated (total time) | Noise dominated (detector-on time) | Marked lightcurve |
|---|---|---|---|---|---|---|---|
| A | 7902 | 6603 | 297 | 297 | 3.76% | 4.50% | 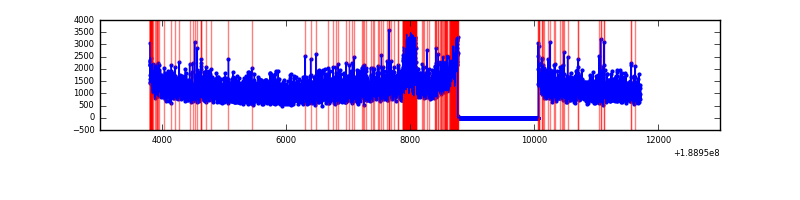 |
| B | 7902 | 6603 | 356 | 356 | 4.51% | 5.39% | 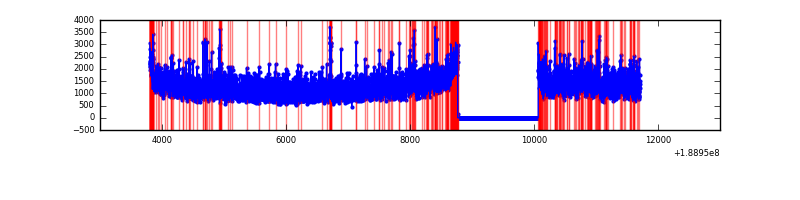 |
| C | 7902 | 6603 | 150 | 150 | 1.90% | 2.27% | 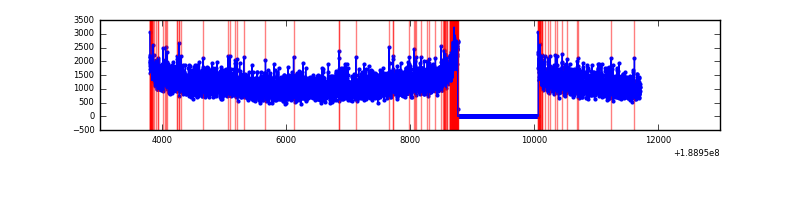 |
| D | 7902 | 6603 | 391 | 391 | 4.95% | 5.92% | 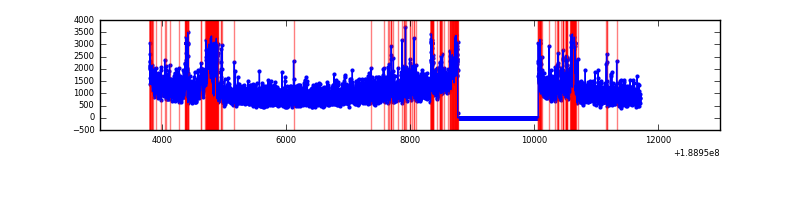 |
Top three noisy pixels from each quadrant. If the there are fewer than three noisy pixels in the level2.evt file, extra rows are filled as -1
| Pixel properties | Quadrant properties | ||||||
|---|---|---|---|---|---|---|---|
| Quadrant | DetID | PixID | Counts | Sigma | Mean | Median | Sigma |
| A | 15 | 127 | 356022 | 756.12 | 1952 | 1964 | 468.3 |
| A | 14 | 5 | 19949 | 38.41 | 1952 | 1964 | 468.3 |
| A | 4 | 32 | 8583 | 14.14 | 1952 | 1964 | 468.3 |
| B | 8 | 4 | 339397 | 704.71 | 2065 | 2075 | 478.7 |
| B | 12 | 52 | 82748 | 168.54 | 2065 | 2075 | 478.7 |
| B | 6 | 53 | 80173 | 163.16 | 2065 | 2075 | 478.7 |
| C | 15 | 241 | 271996 | 522.96 | 1874 | 1936 | 516.4 |
| C | 3 | 111 | 23563 | 41.88 | 1874 | 1936 | 516.4 |
| C | 3 | 79 | 19715 | 34.43 | 1874 | 1936 | 516.4 |
| D | 10 | 84 | 643540 | 1193.34 | 1773 | 1828 | 537.7 |
| D | 1 | 83 | 103936 | 189.88 | 1773 | 1828 | 537.7 |
| D | 5 | 190 | 25693 | 44.38 | 1773 | 1828 | 537.7 |
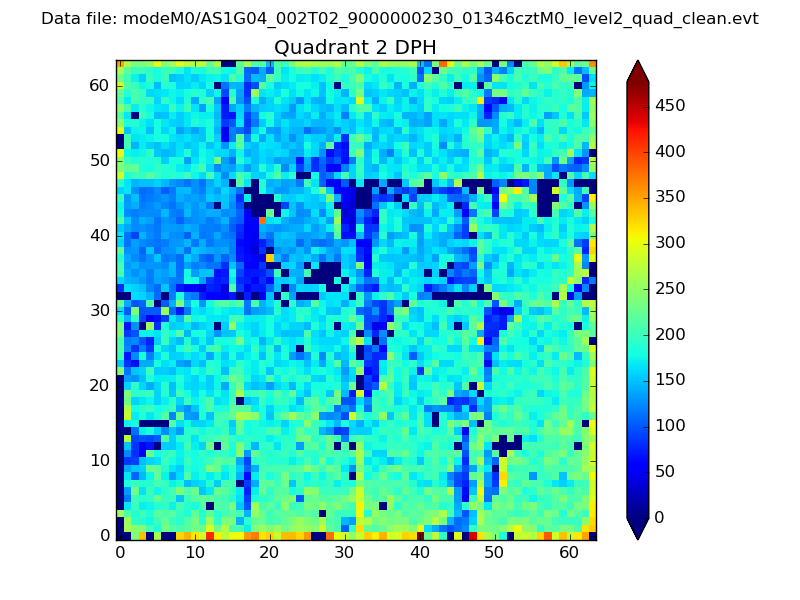
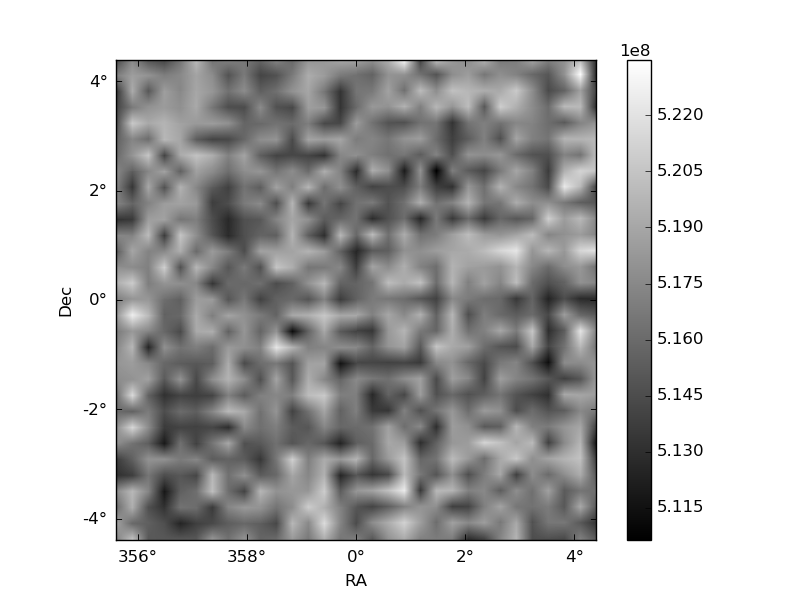
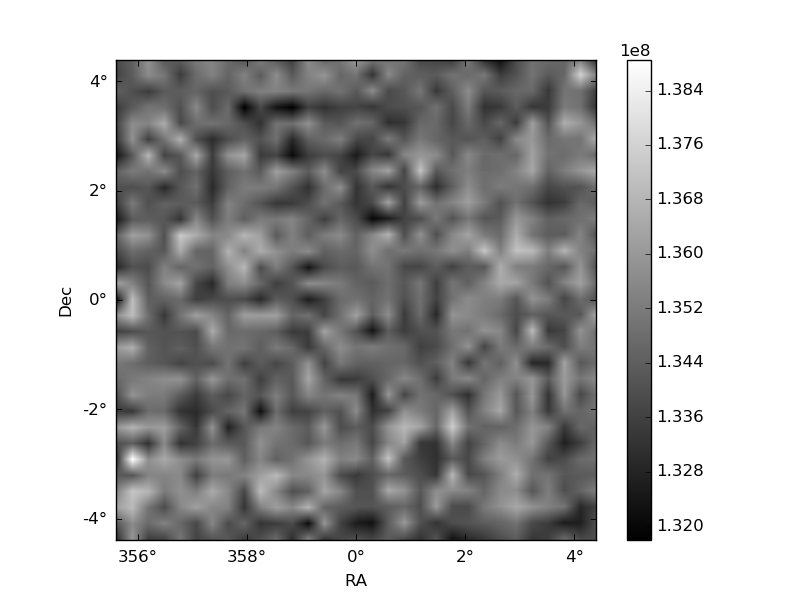
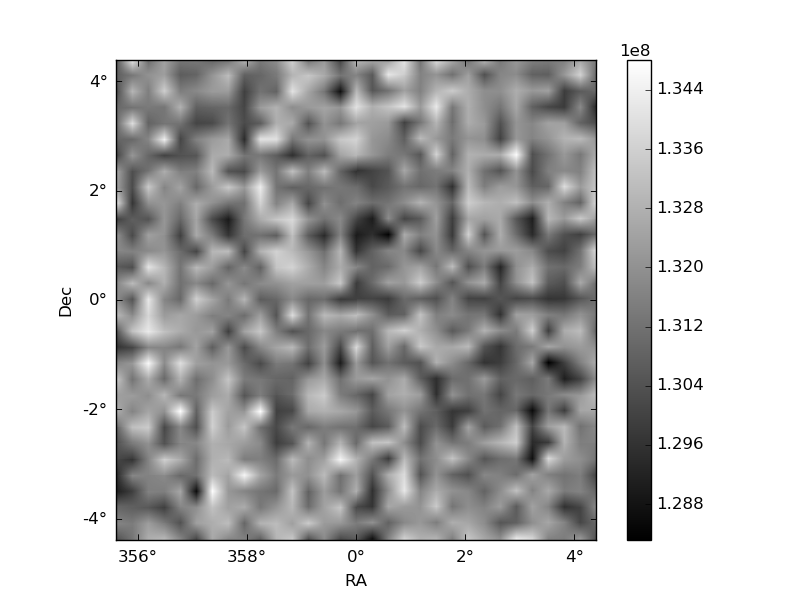
Histogram calculated using DETX and DETY for each event in the final _common_clean file
| Quadrant A | 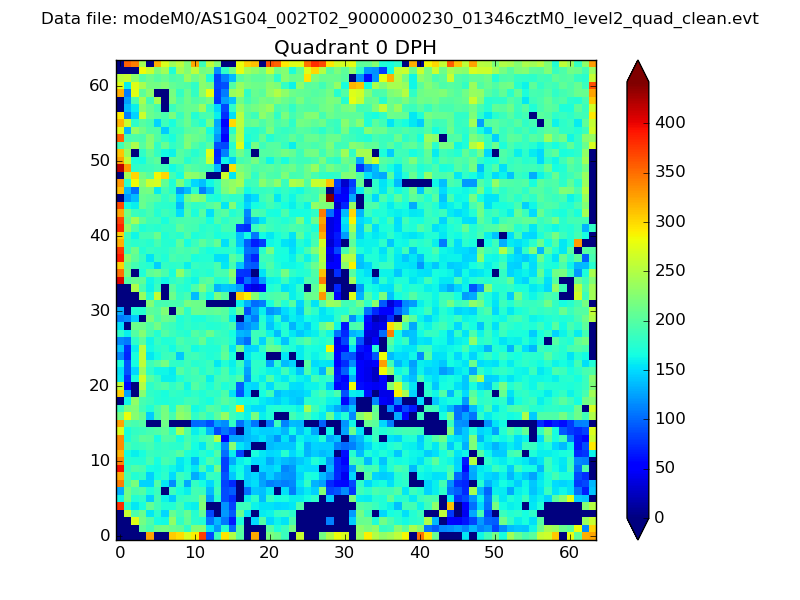 |
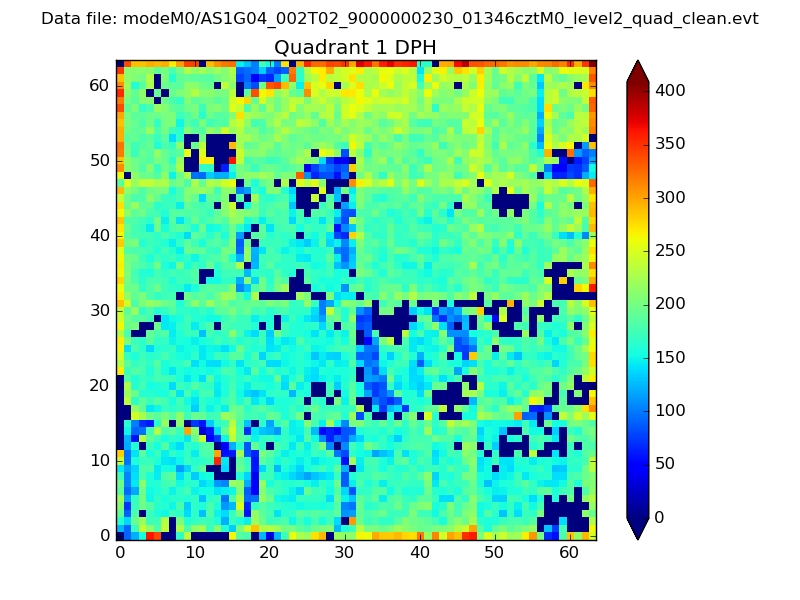 |
Quadrant B |
|---|---|---|---|
| Quadrant D | 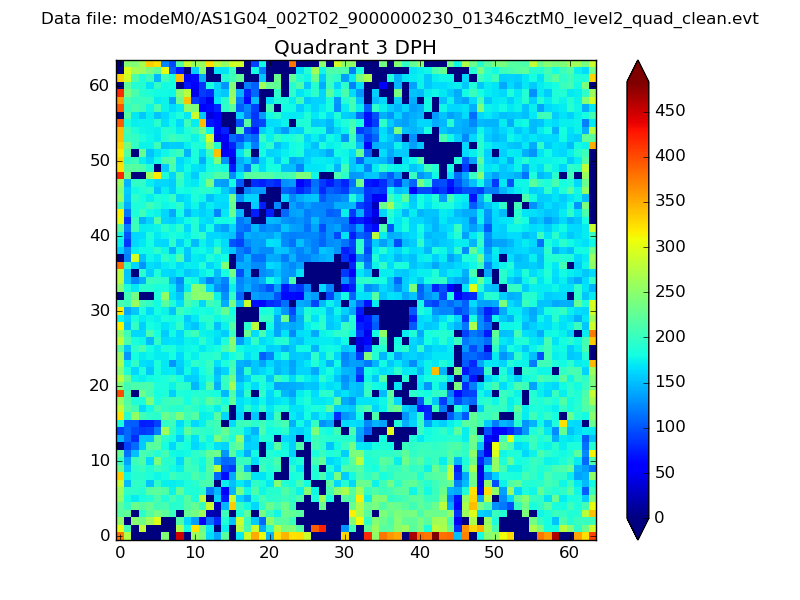 |
 |
Quadrant C |
| Plot type | Count rate plots | Images |
|---|---|---|
| Comparison with Poisson distribution Blue bars denote a histogram of data divided into 1 sec bins. Red curve is a Poisson curve with rate = median count rate of data. |
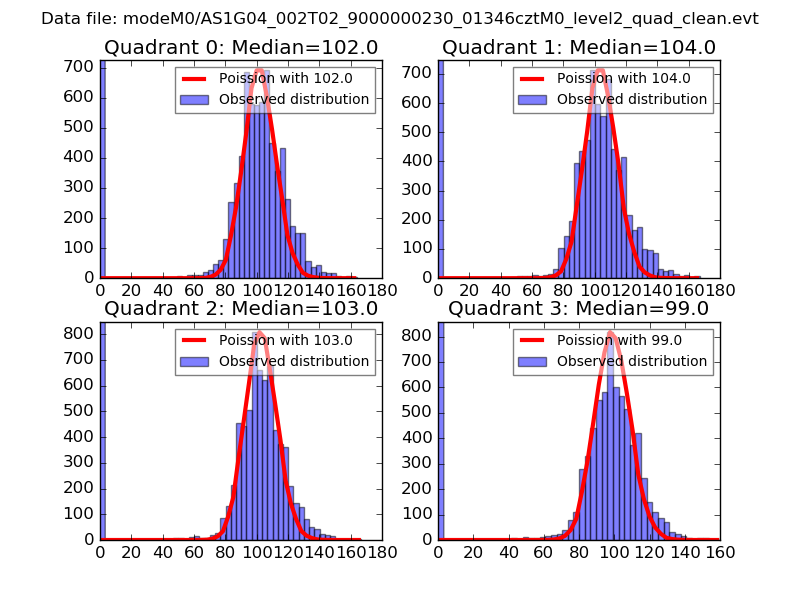 |
 |
| Quadrant-wise count rates Data is divided into 100 sec bins |
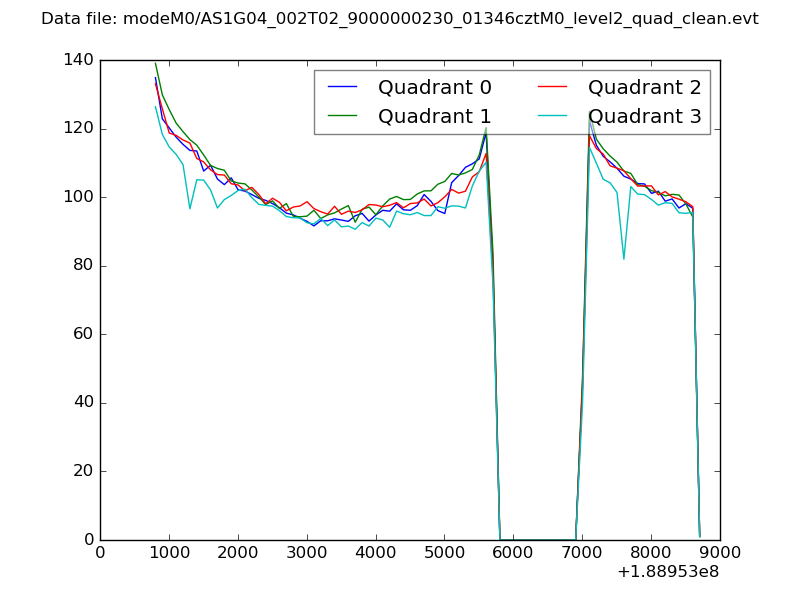 |
|
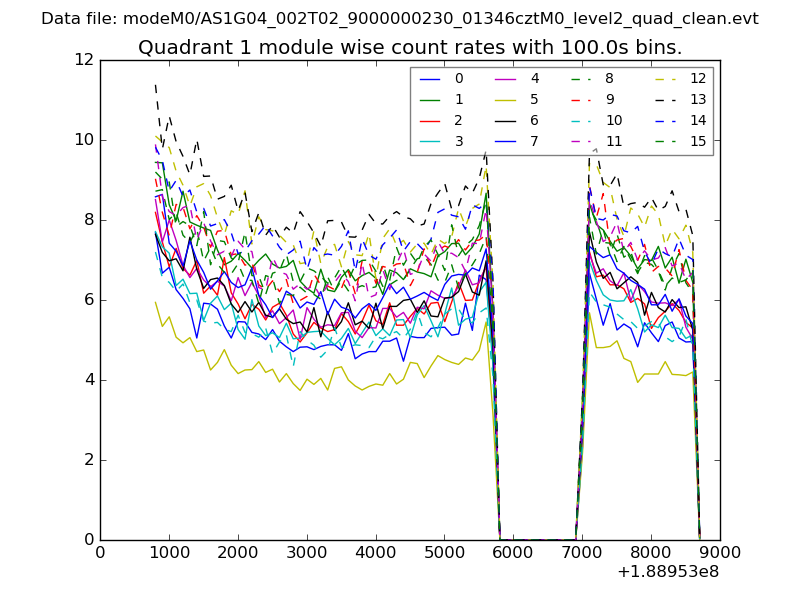
| Module-wise count rates for Quadrant A Data is divided into 100 sec bins |
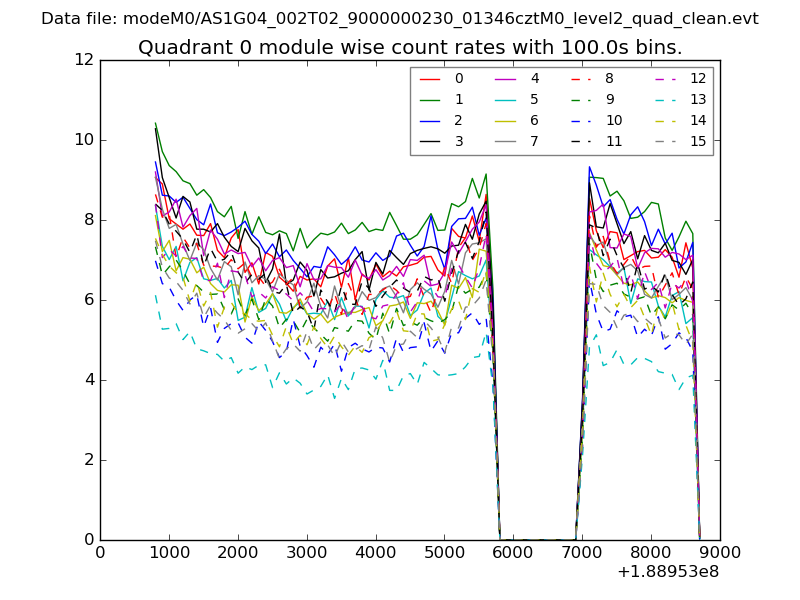 |
 |
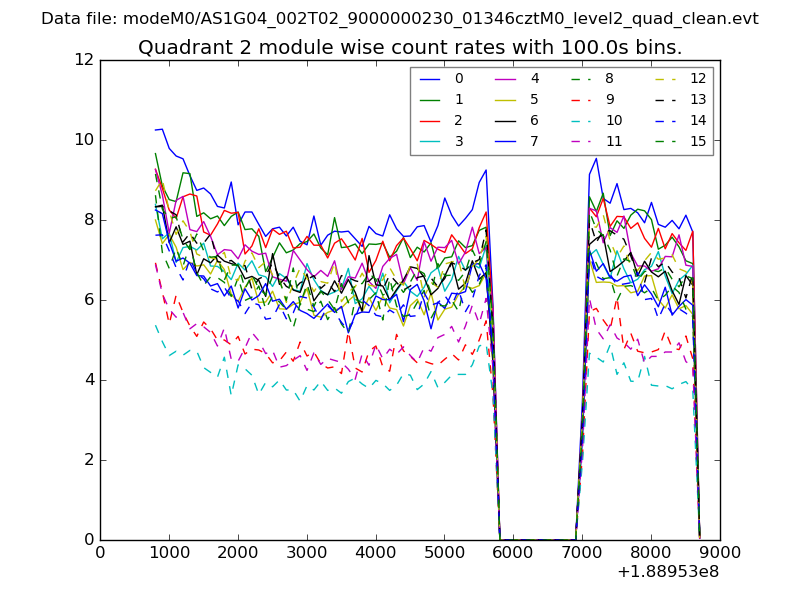
| Module-wise count rates for Quadrant B Data is divided into 100 sec bins |
 |
 |
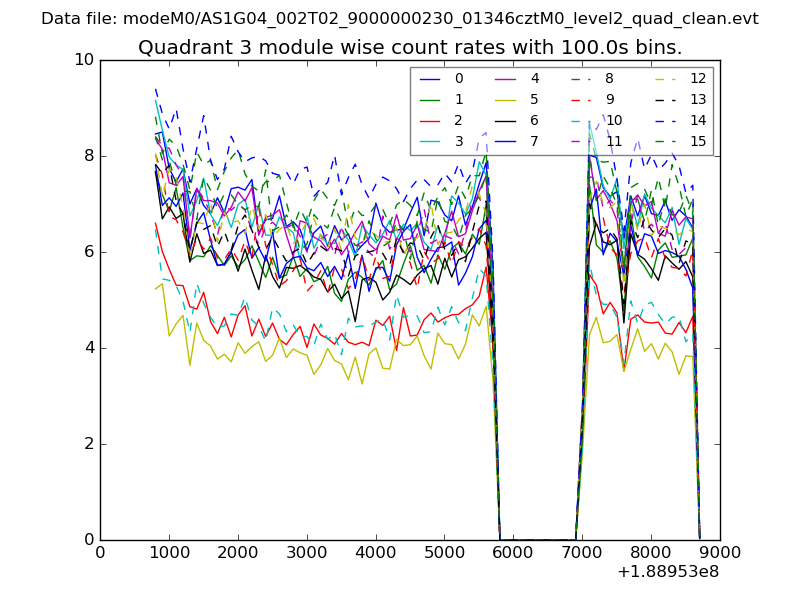
| Module-wise count rates for Quadrant C Data is divided into 100 sec bins |
 |
 |
| Module-wise count rates for Quadrant D Data is divided into 100 sec bins |
 |
 |
| Parameter | Plot |
|---|---|
| CZT HV Monitor | 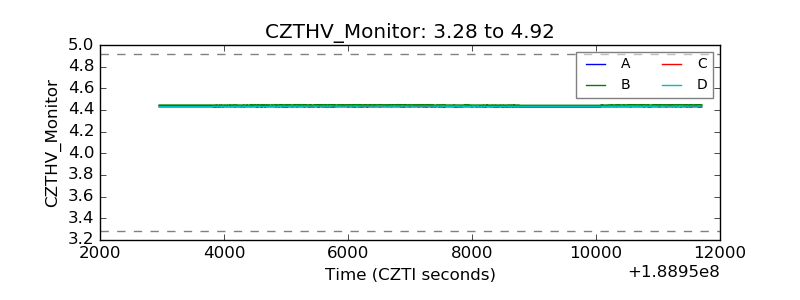 |
| D_VDD | 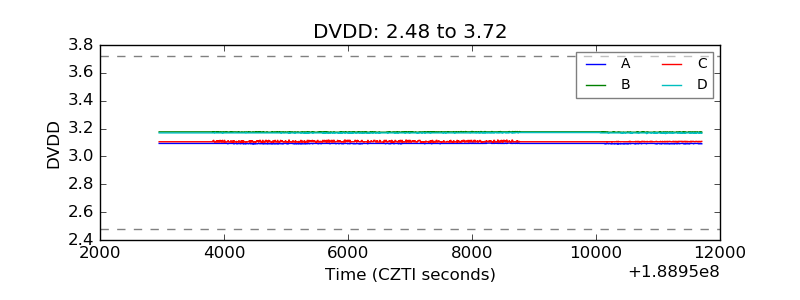 |
| Temperature 1 | 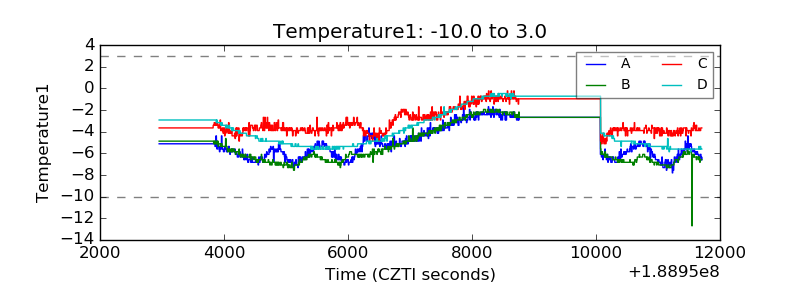 |
| Veto HV Monitor | 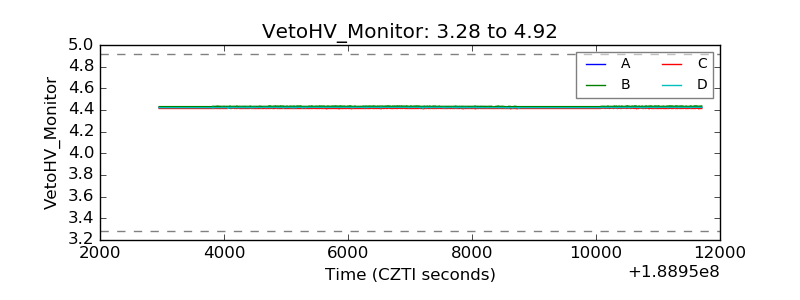 |
| Veto LLD | 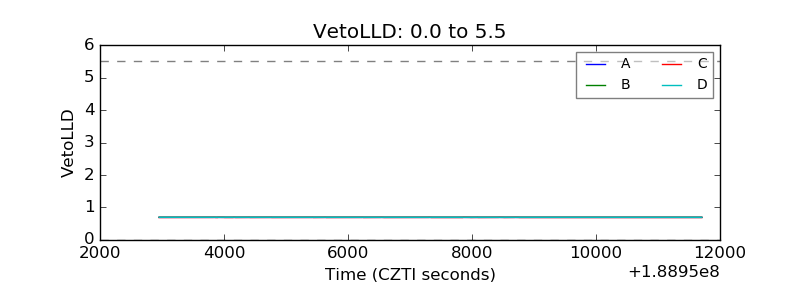 |
| Alpha Counter | 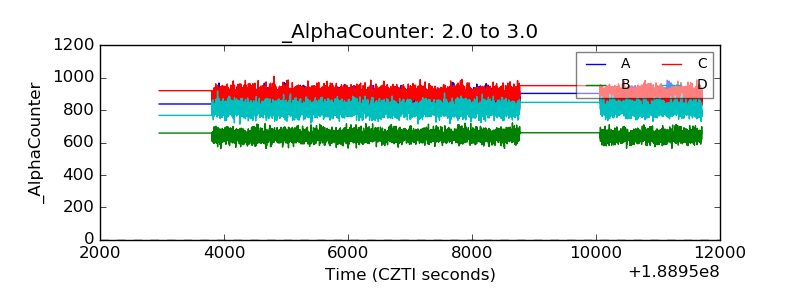 |
| _CPM_Rate | 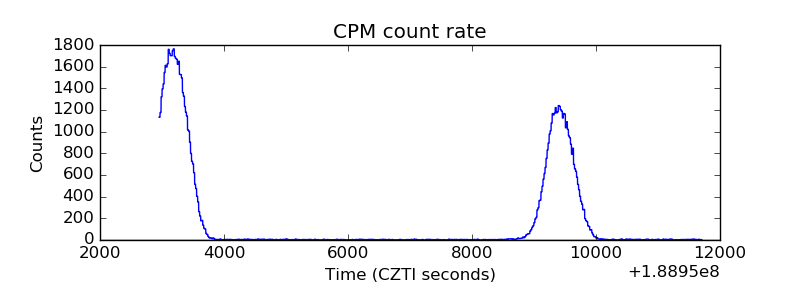 |
| CZT Counter | 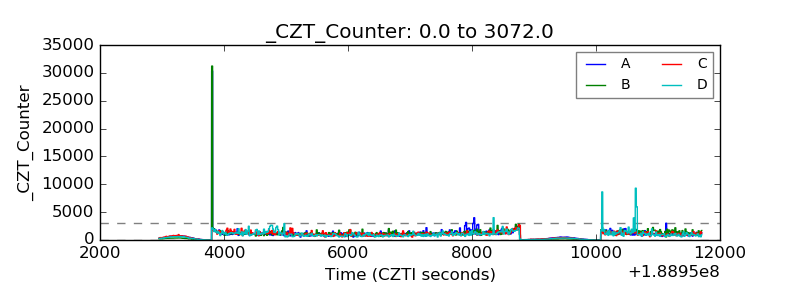 |
| +2.5 Volts monitor |  |
| +5 Volts monitor |  |
| _ROLL_ROT | 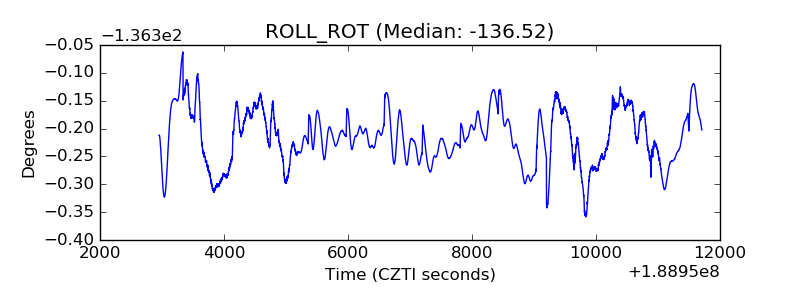 |
| _Roll_DEC | 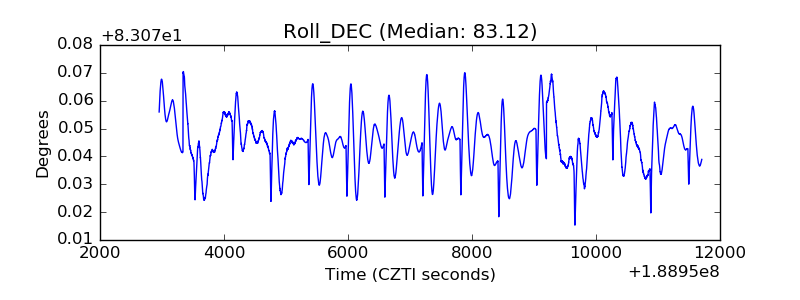 |
| _Roll_RA | 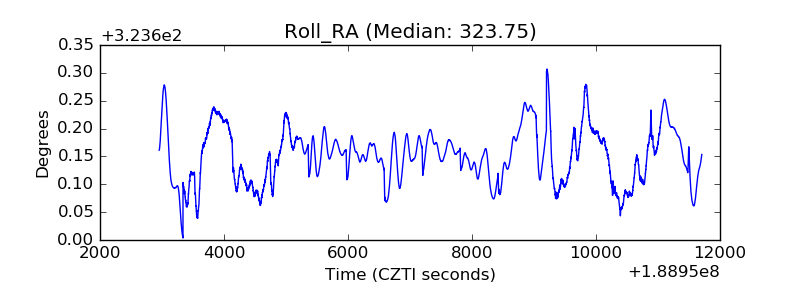 |
| Veto Counter | 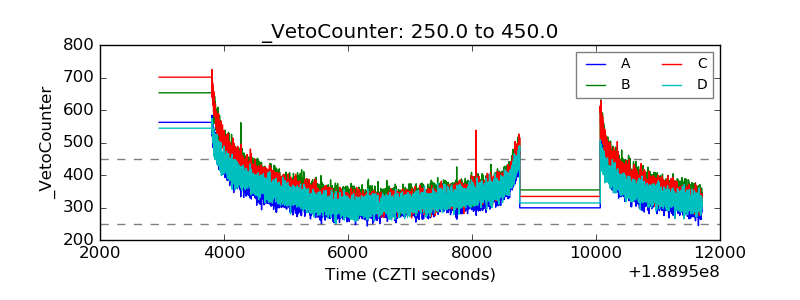 |