| Param | Original file | Final file |
|---|---|---|
| Filename | modeM0/AS1G04_002T02_9000000230_01348cztM0_level2.evt | modeM0/AS1G04_002T02_9000000230_01348cztM0_level2_quad_clean.evt |
| Size (bytes) | 1,072,474,560 | 97,508,160 |
| Size | 1022.8 MB | 93.0 MB |
| Events in quadrant A | 9,325,546 | 622,881 |
| Events in quadrant B | 8,346,557 | 637,816 |
| Events in quadrant C | 7,437,055 | 628,284 |
| Events in quadrant D | 6,937,993 | 608,329 |
| Mode M9 | |||
|---|---|---|---|
| Quadrant | BADHDUFLAG | Total packets | Discarded packets |
| A | 0 | 9 | 0 |
| B | 0 | 9 | 0 |
| C | 0 | 9 | 0 |
| D | 0 | 9 | 0 |
| Mode M0 | |||
|---|---|---|---|
| Quadrant | BADHDUFLAG | Total packets | Discarded packets |
| A | 0 | 32343 | 2 |
| B | 0 | 29402 | 1 |
| C | 0 | 26751 | 1 |
| D | 0 | 25301 | 1 |
| Mode SS | |||
|---|---|---|---|
| Quadrant | BADHDUFLAG | Total packets | Discarded packets |
| A | 0 | 134 | 0 |
| B | 0 | 134 | 0 |
| C | 0 | 134 | 0 |
| D | 0 | 134 | 0 |
| Quadrant | Total seconds | Saturated seconds | Saturation percentage |
|---|---|---|---|
| A | 6527 | 161 | 2.466677% |
| B | 6527 | 86 | 1.317604% |
| C | 6527 | 5 | 0.076605% |
| D | 6527 | 53 | 0.812012% |
Noise dominated data is calculated using 1-second bins in cleaned event files. If a bin has >2000 counts, and if more than 50% of those come from <1% of pixels, then it is considered to be noise-dominated and hence unusable.
| Quadrant | # 1 sec bins | Bins with >0 counts | Bins with >2000 counts | High rate bins dominated by noise | Noise dominated (total time) | Noise dominated (detector-on time) | Marked lightcurve |
|---|---|---|---|---|---|---|---|
| A | 7472 | 6527 | 949 | 949 | 12.70% | 14.54% | 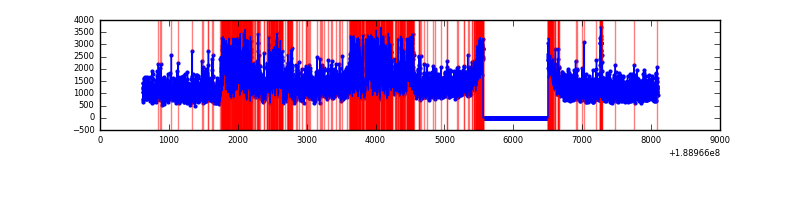 |
| B | 7472 | 6527 | 377 | 377 | 5.05% | 5.78% | 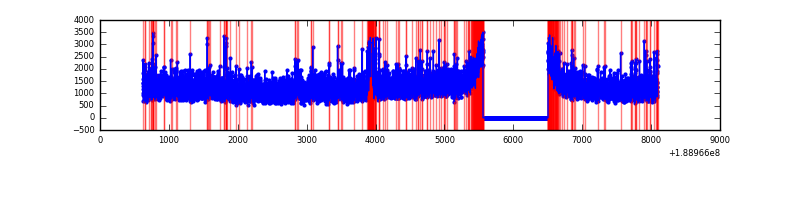 |
| C | 7472 | 6528 | 171 | 171 | 2.29% | 2.62% | 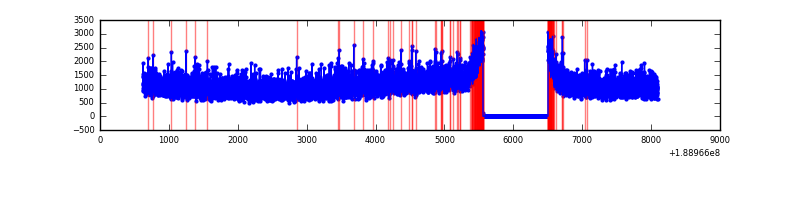 |
| D | 7472 | 6528 | 213 | 213 | 2.85% | 3.26% | 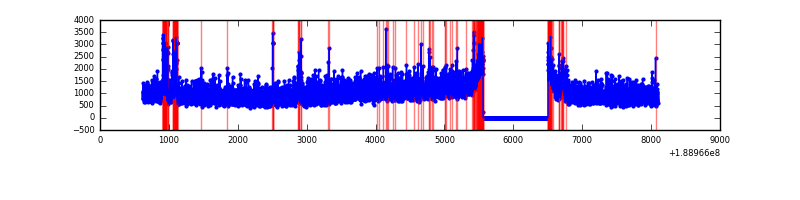 |
Top three noisy pixels from each quadrant. If the there are fewer than three noisy pixels in the level2.evt file, extra rows are filled as -1
| Pixel properties | Quadrant properties | ||||||
|---|---|---|---|---|---|---|---|
| Quadrant | DetID | PixID | Counts | Sigma | Mean | Median | Sigma |
| A | 15 | 127 | 1797607 | 3828.65 | 1936 | 1949 | 469.0 |
| A | 0 | 253 | 46860 | 95.76 | 1936 | 1949 | 469.0 |
| A | 4 | 32 | 27270 | 53.99 | 1936 | 1949 | 469.0 |
| B | 8 | 4 | 272702 | 565.97 | 2027 | 2036 | 478.2 |
| B | 5 | 191 | 201535 | 417.16 | 2027 | 2036 | 478.2 |
| B | 6 | 53 | 88824 | 181.48 | 2027 | 2036 | 478.2 |
| C | 15 | 241 | 301595 | 594.36 | 1815 | 1873 | 504.3 |
| C | 3 | 111 | 19727 | 35.41 | 1815 | 1873 | 504.3 |
| C | 3 | 79 | 14955 | 25.94 | 1815 | 1873 | 504.3 |
| D | 10 | 84 | 227875 | 416.32 | 1740 | 1793 | 543.1 |
| D | 10 | 125 | 57421 | 102.44 | 1740 | 1793 | 543.1 |
| D | 1 | 83 | 40945 | 72.1 | 1740 | 1793 | 543.1 |
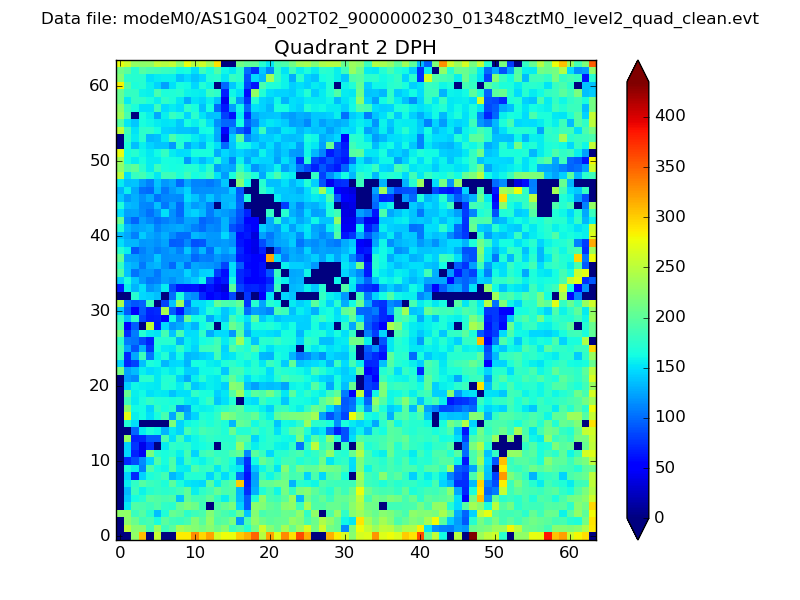
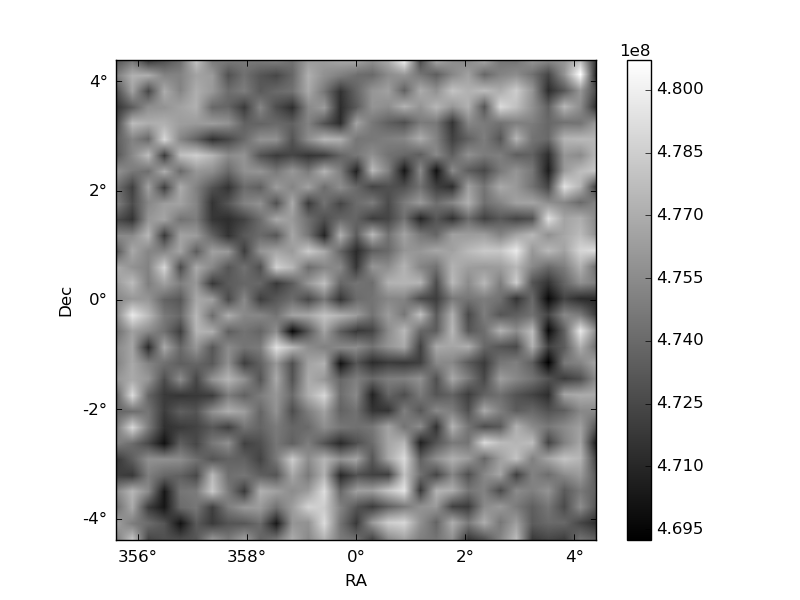
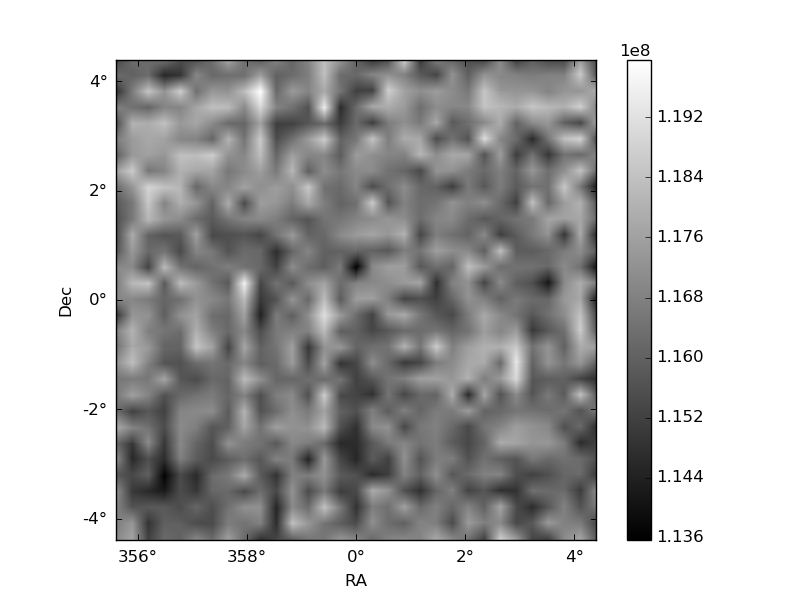
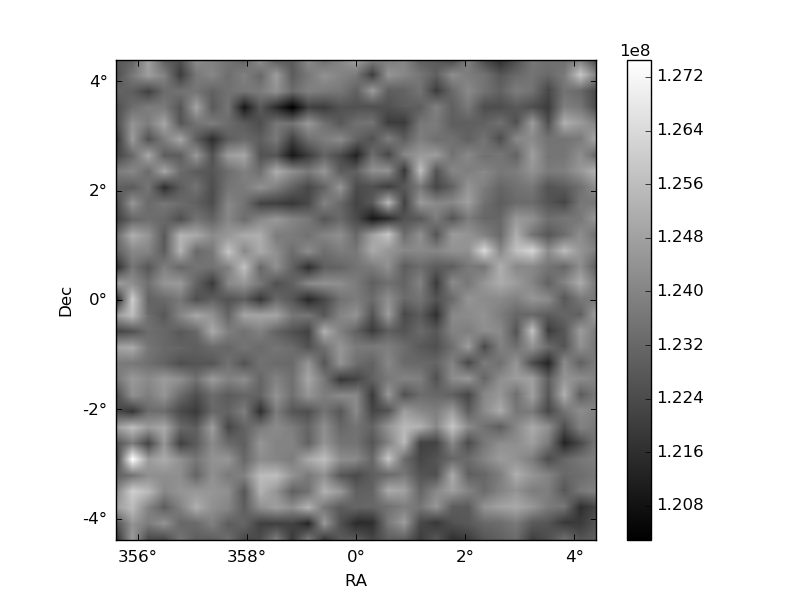
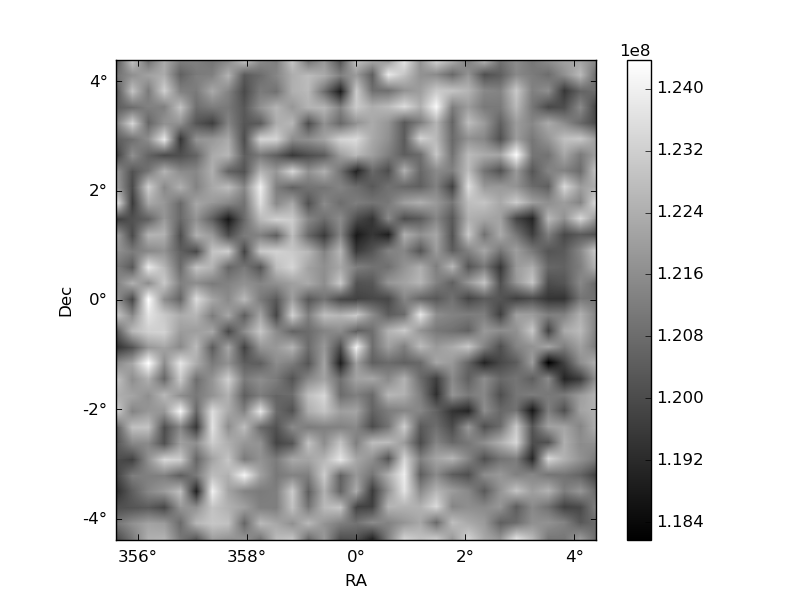
Histogram calculated using DETX and DETY for each event in the final _common_clean file
| Quadrant A | 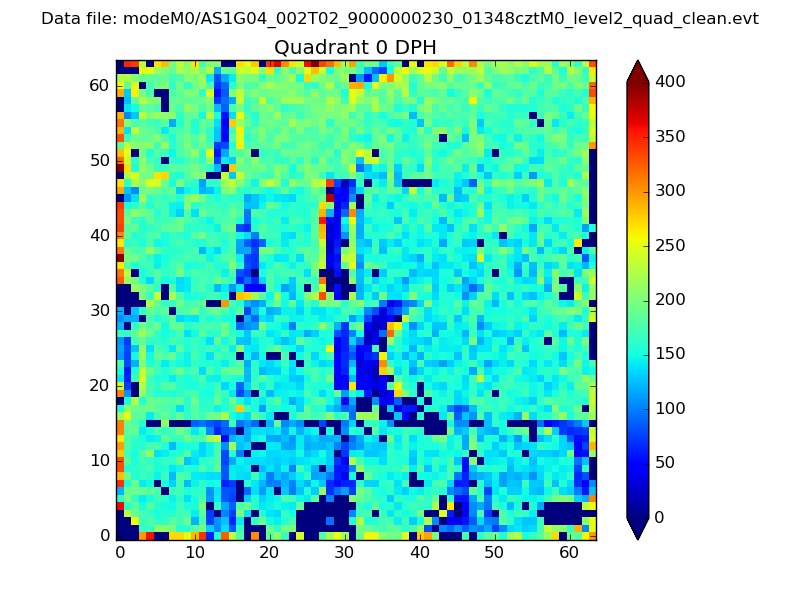 |
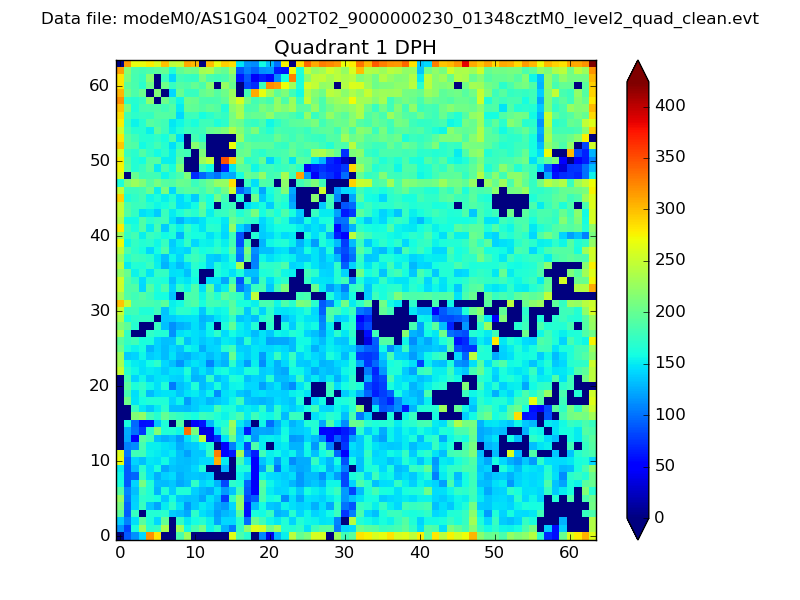 |
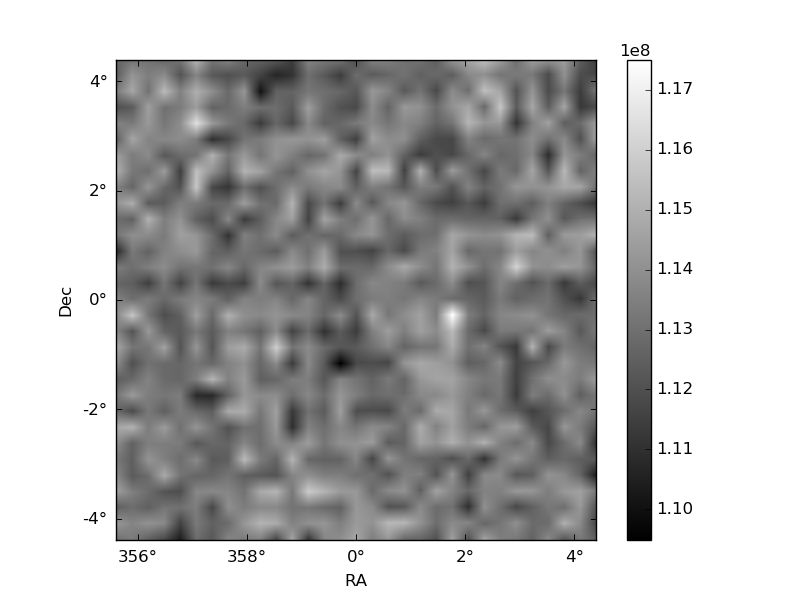
Quadrant B |
|---|---|---|---|
| Quadrant D | 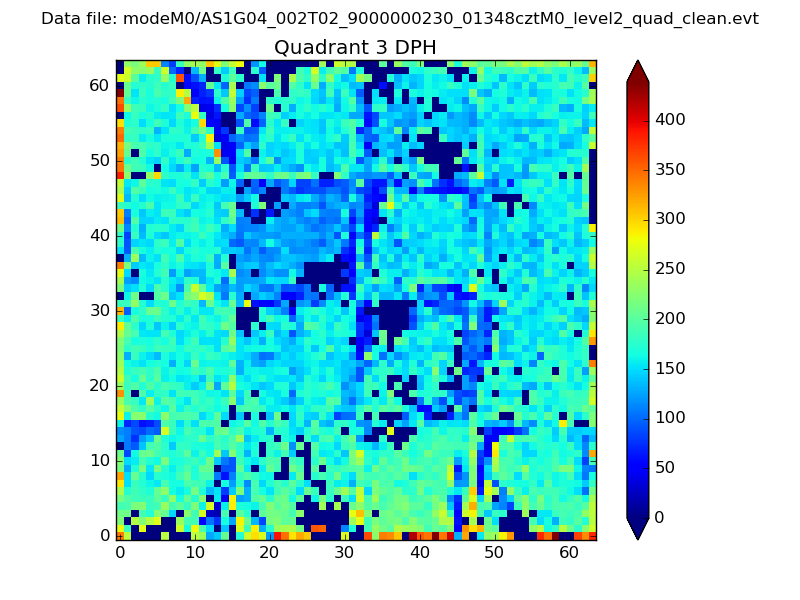 |
 |
Quadrant C |
| Plot type | Count rate plots | Images |
|---|---|---|
| Comparison with Poisson distribution Blue bars denote a histogram of data divided into 1 sec bins. Red curve is a Poisson curve with rate = median count rate of data. |
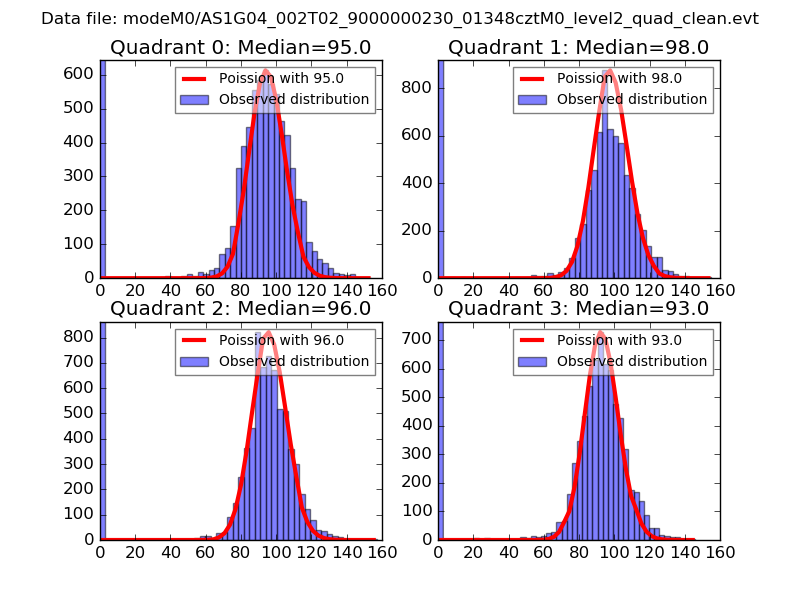 |
 |
| Quadrant-wise count rates Data is divided into 100 sec bins |
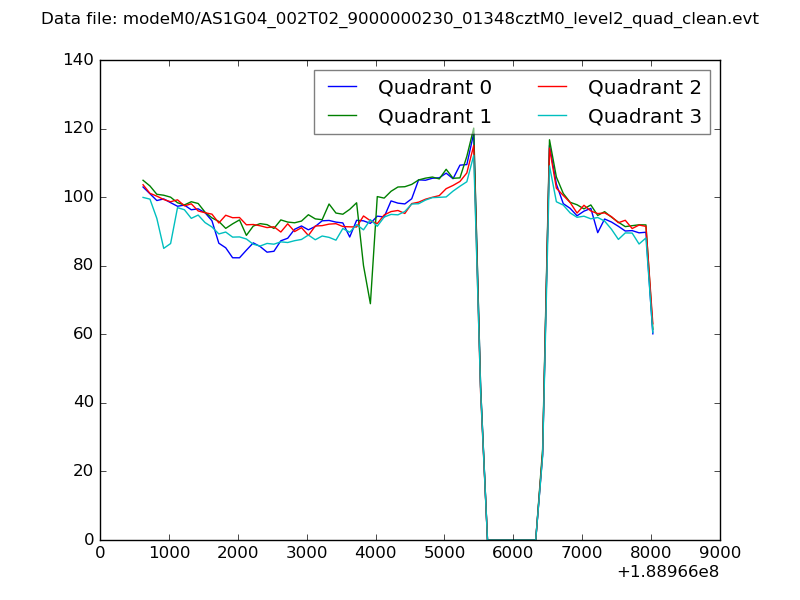 |
|
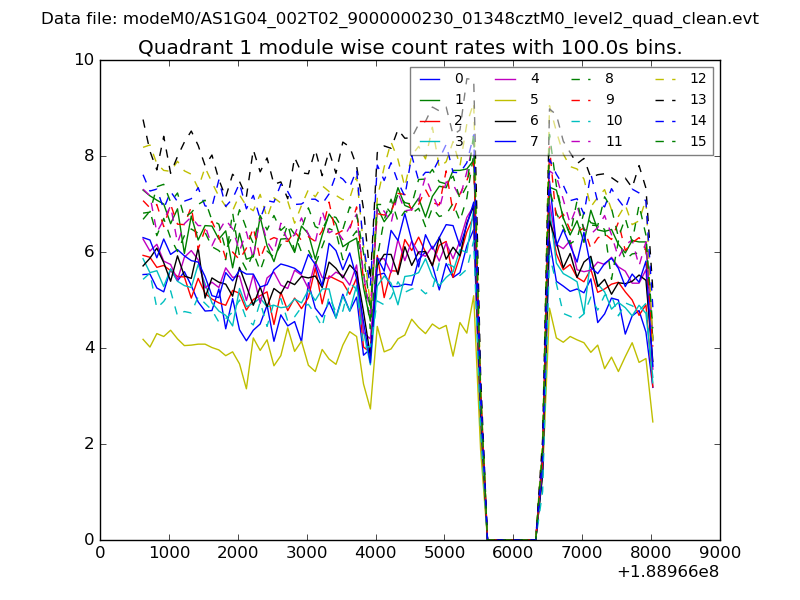
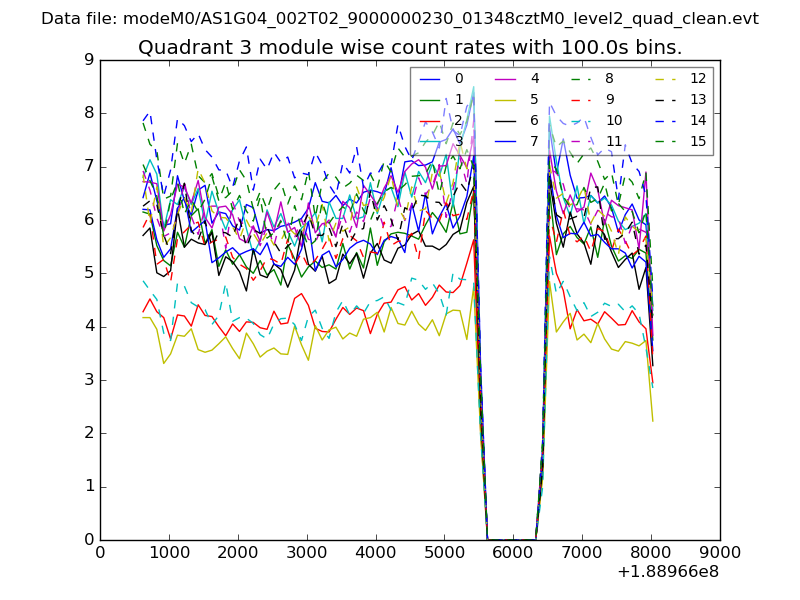
| Module-wise count rates for Quadrant A Data is divided into 100 sec bins |
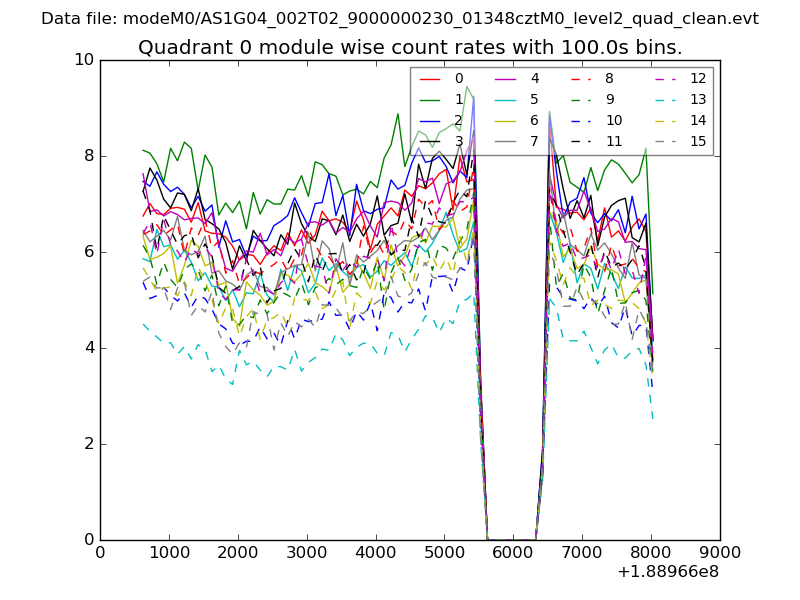 |
 |
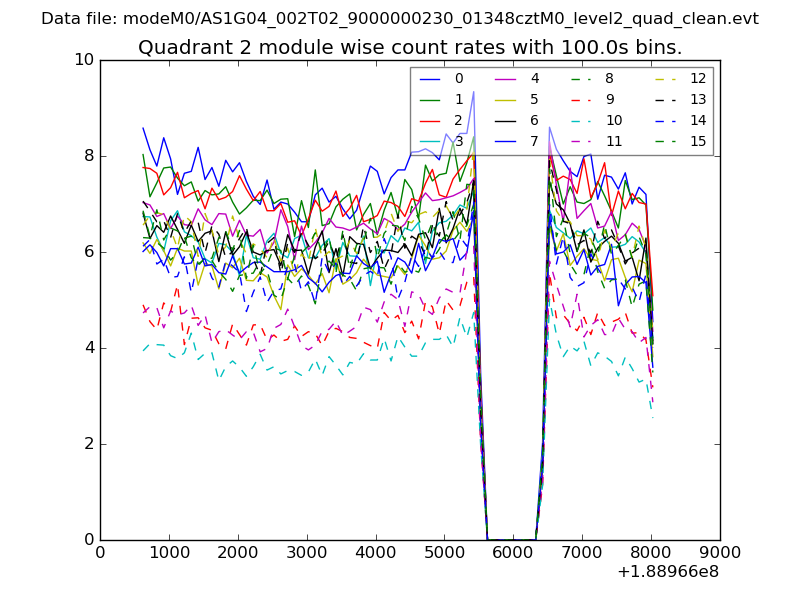
| Module-wise count rates for Quadrant B Data is divided into 100 sec bins |
 |
 |
| Module-wise count rates for Quadrant C Data is divided into 100 sec bins |
 |
 |
| Module-wise count rates for Quadrant D Data is divided into 100 sec bins |
 |
 |
| Parameter | Plot |
|---|---|
| CZT HV Monitor | 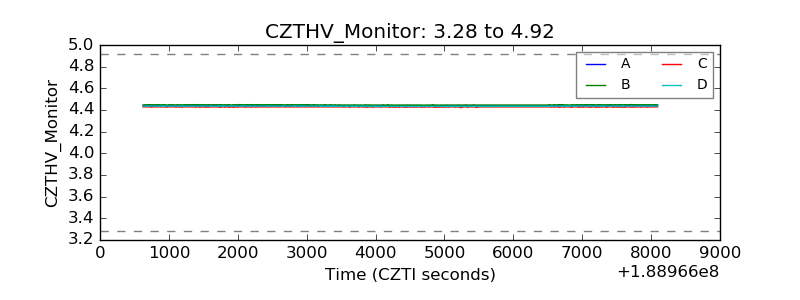 |
| D_VDD | 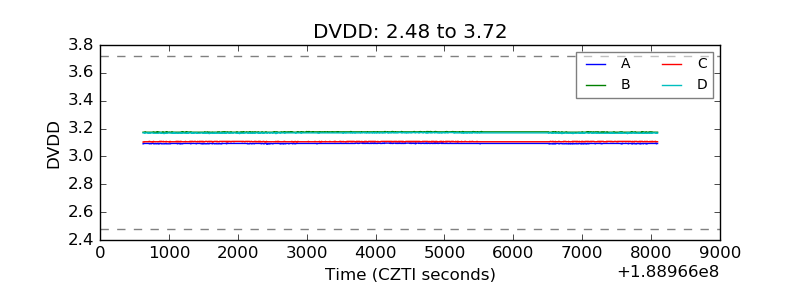 |
| Temperature 1 | 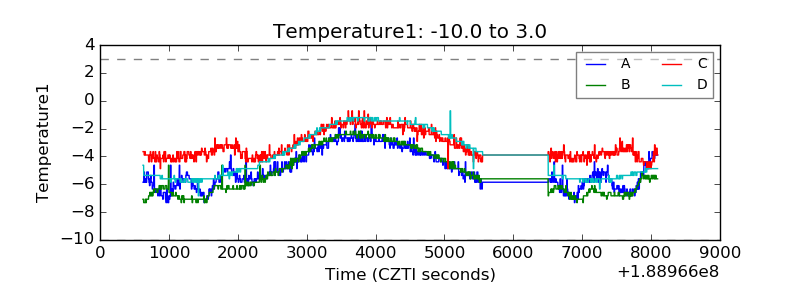 |
| Veto HV Monitor | 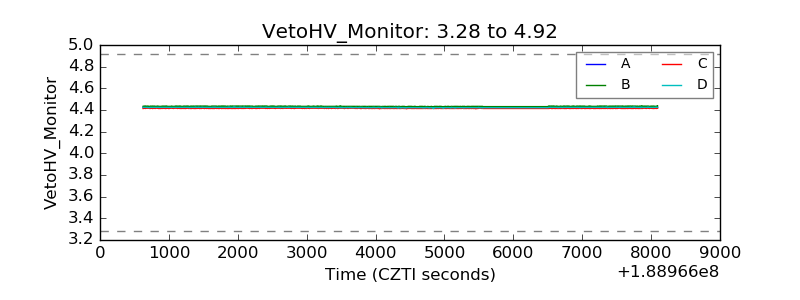 |
| Veto LLD | 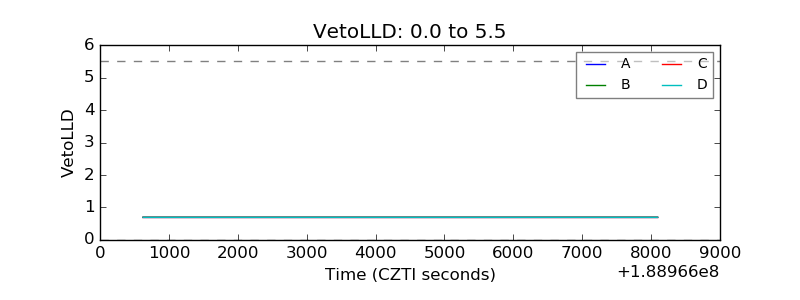 |
| Alpha Counter | 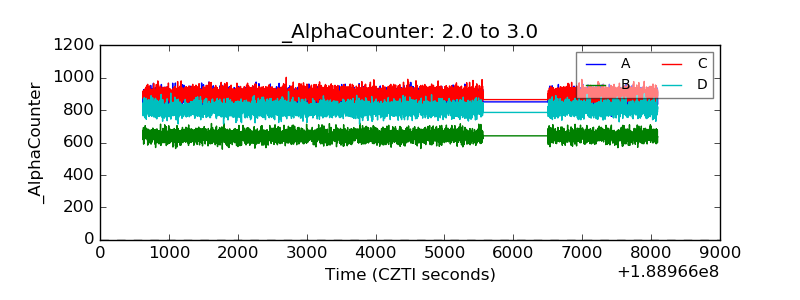 |
| _CPM_Rate | 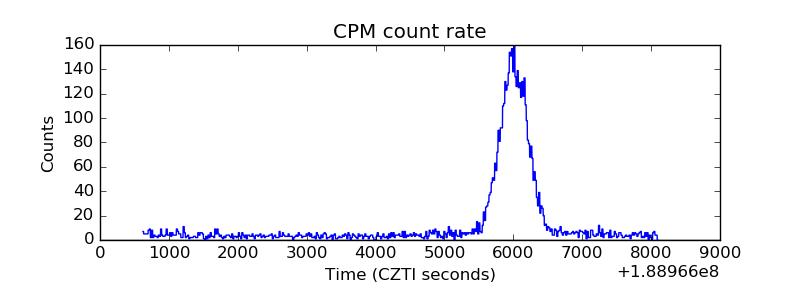 |
| CZT Counter | 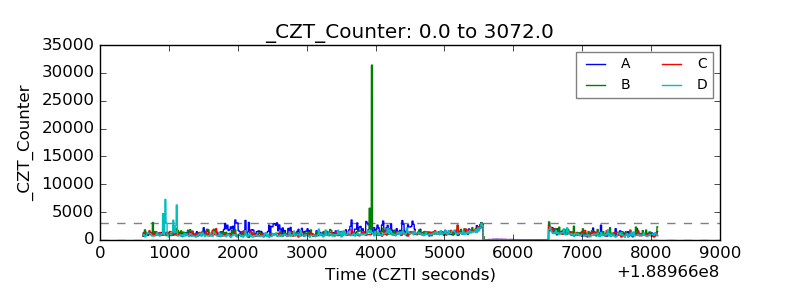 |
| +2.5 Volts monitor | 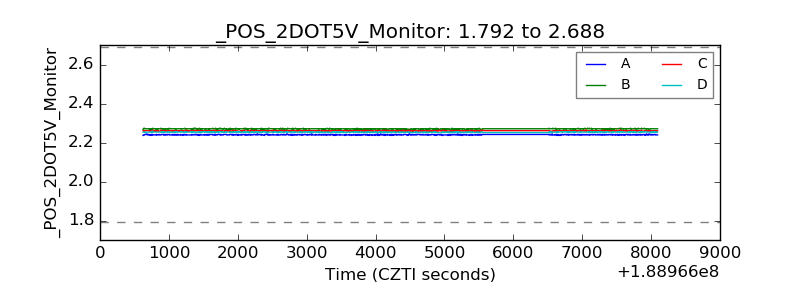 |
| +5 Volts monitor | 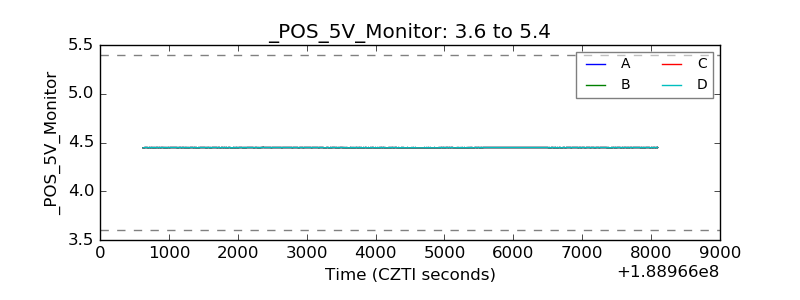 |
| _ROLL_ROT | 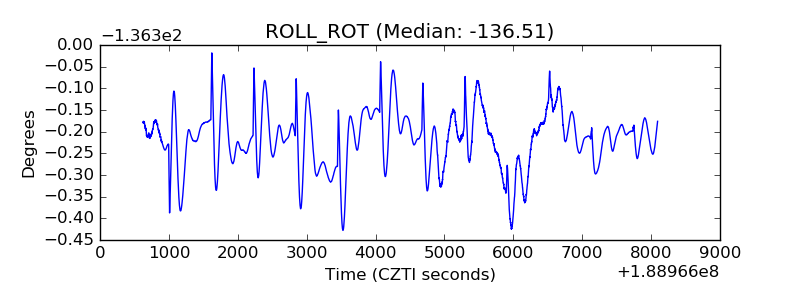 |
| _Roll_DEC | 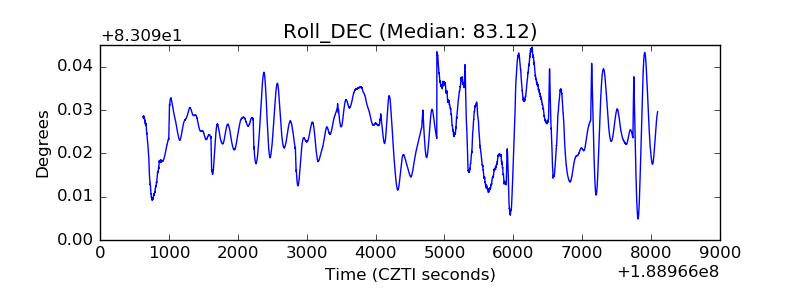 |
| _Roll_RA | 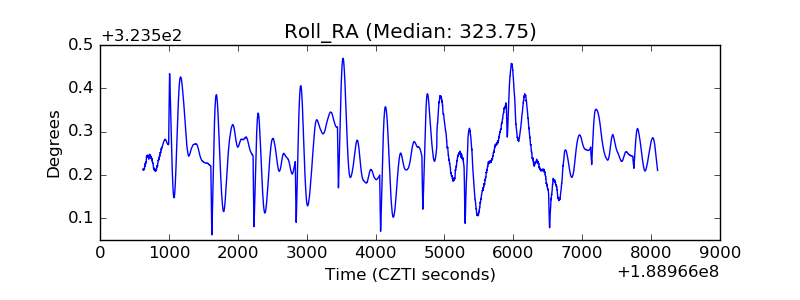 |
| Veto Counter | 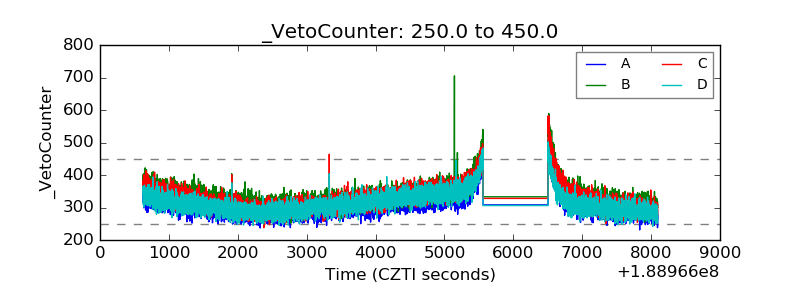 |