| Param | Original file | Final file |
|---|---|---|
| Filename | modeM0/AS1G04_002T02_9000000230_01349cztM0_level2.evt | modeM0/AS1G04_002T02_9000000230_01349cztM0_level2_quad_clean.evt |
| Size (bytes) | 1,185,624,000 | 103,726,080 |
| Size | 1.1 GB | 98.9 MB |
| Events in quadrant A | 9,372,308 | 661,767 |
| Events in quadrant B | 9,888,813 | 676,934 |
| Events in quadrant C | 8,088,658 | 666,722 |
| Events in quadrant D | 8,093,635 | 648,012 |
| Mode M9 | |||
|---|---|---|---|
| Quadrant | BADHDUFLAG | Total packets | Discarded packets |
| A | 0 | 6 | 0 |
| B | 0 | 6 | 0 |
| C | 0 | 6 | 0 |
| D | 0 | 6 | 0 |
| Mode M0 | |||
|---|---|---|---|
| Quadrant | BADHDUFLAG | Total packets | Discarded packets |
| A | 0 | 32855 | 2 |
| B | 0 | 34365 | 1 |
| C | 0 | 28976 | 1 |
| D | 0 | 29034 | 1 |
| Mode SS | |||
|---|---|---|---|
| Quadrant | BADHDUFLAG | Total packets | Discarded packets |
| A | 0 | 142 | 0 |
| B | 0 | 142 | 0 |
| C | 0 | 142 | 0 |
| D | 0 | 142 | 0 |
| Quadrant | Total seconds | Saturated seconds | Saturation percentage |
|---|---|---|---|
| A | 7005 | 276 | 3.940043% |
| B | 7005 | 70 | 0.999286% |
| C | 7005 | 4 | 0.057102% |
| D | 7005 | 90 | 1.284797% |
Noise dominated data is calculated using 1-second bins in cleaned event files. If a bin has >2000 counts, and if more than 50% of those come from <1% of pixels, then it is considered to be noise-dominated and hence unusable.
| Quadrant | # 1 sec bins | Bins with >0 counts | Bins with >2000 counts | High rate bins dominated by noise | Noise dominated (total time) | Noise dominated (detector-on time) | Marked lightcurve |
|---|---|---|---|---|---|---|---|
| A | 7525 | 7005 | 727 | 727 | 9.66% | 10.38% | 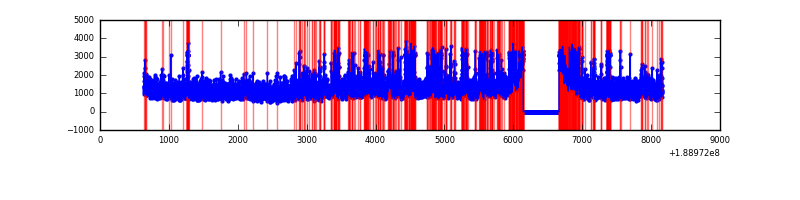 |
| B | 7525 | 7005 | 845 | 845 | 11.23% | 12.06% | 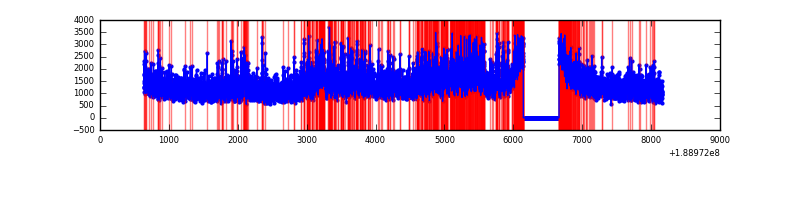 |
| C | 7525 | 7006 | 169 | 169 | 2.25% | 2.41% | 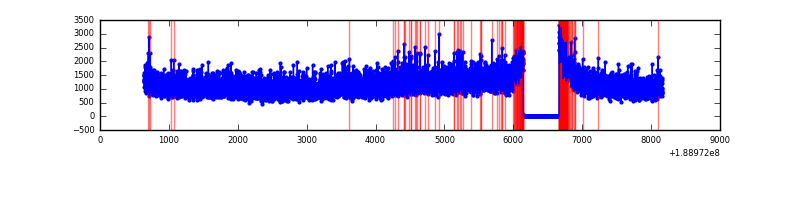 |
| D | 7525 | 7006 | 425 | 425 | 5.65% | 6.07% | 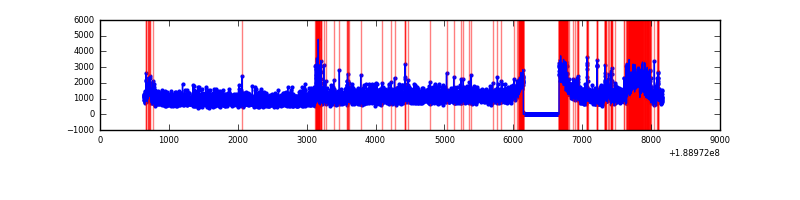 |
Top three noisy pixels from each quadrant. If the there are fewer than three noisy pixels in the level2.evt file, extra rows are filled as -1
| Pixel properties | Quadrant properties | ||||||
|---|---|---|---|---|---|---|---|
| Quadrant | DetID | PixID | Counts | Sigma | Mean | Median | Sigma |
| A | 15 | 127 | 1109256 | 2172.89 | 2105 | 2111 | 509.5 |
| A | 0 | 253 | 61934 | 117.41 | 2105 | 2111 | 509.5 |
| A | 3 | 80 | 50958 | 95.87 | 2105 | 2111 | 509.5 |
| B | 8 | 4 | 1066018 | 2023.18 | 2219 | 2230 | 525.8 |
| B | 12 | 52 | 127203 | 237.68 | 2219 | 2230 | 525.8 |
| B | 6 | 53 | 95233 | 176.88 | 2219 | 2230 | 525.8 |
| C | 15 | 241 | 282382 | 507.13 | 1984 | 2047 | 552.8 |
| C | 3 | 79 | 23993 | 39.7 | 1984 | 2047 | 552.8 |
| C | 3 | 111 | 23422 | 38.67 | 1984 | 2047 | 552.8 |
| D | 9 | 53 | 274165 | 480.69 | 1933 | 1979 | 566.2 |
| D | 15 | 13 | 191223 | 334.21 | 1933 | 1979 | 566.2 |
| D | 1 | 83 | 179037 | 312.69 | 1933 | 1979 | 566.2 |
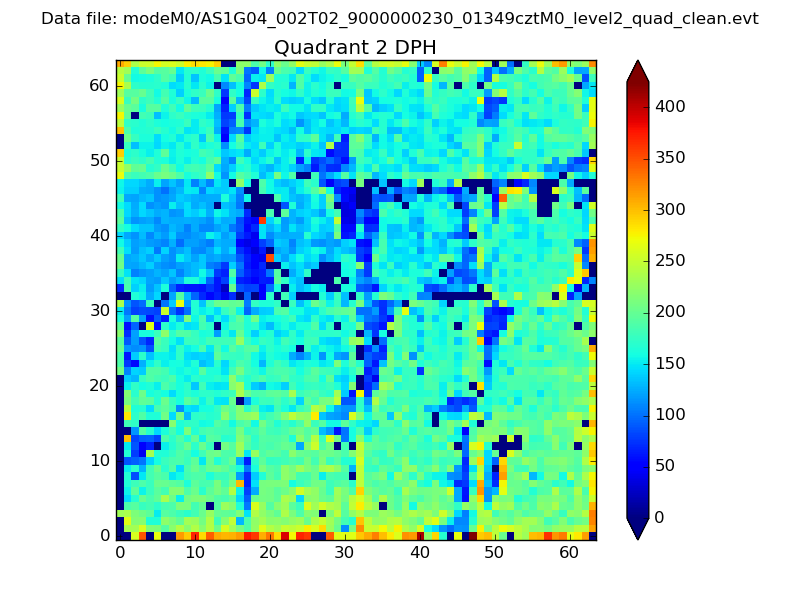
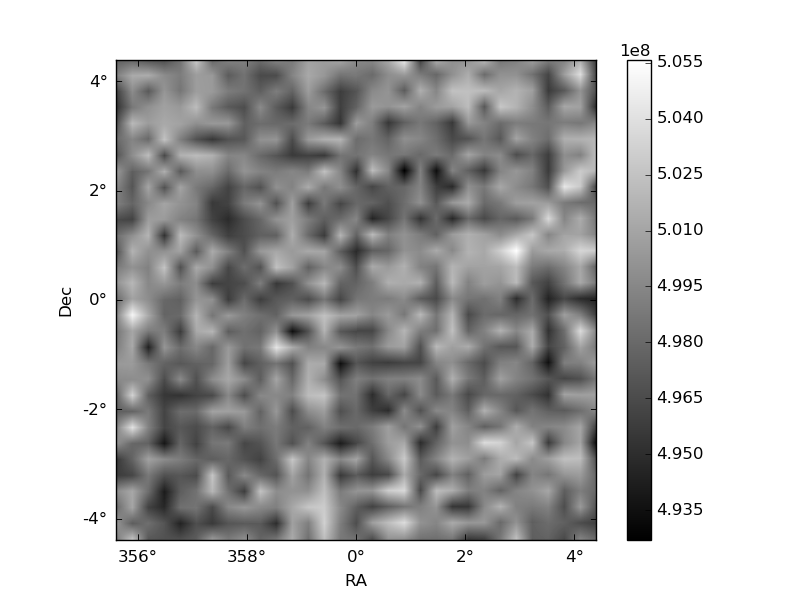
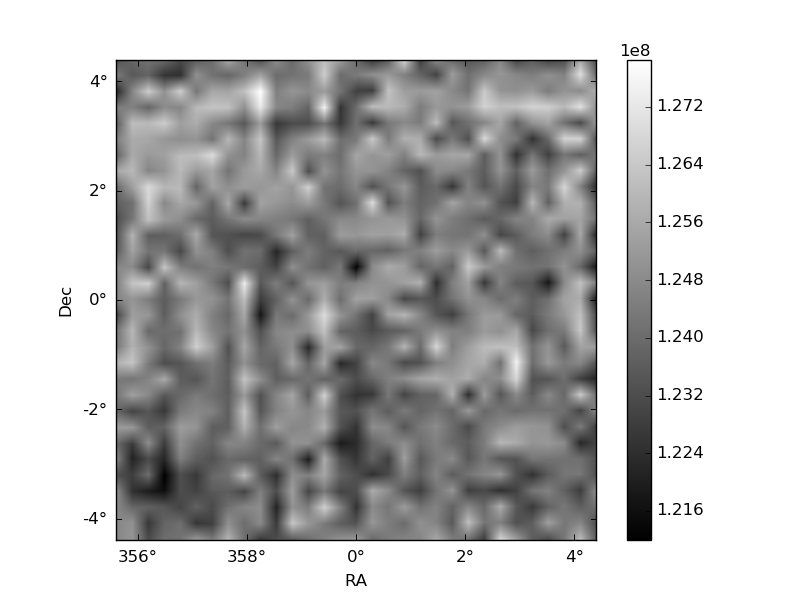
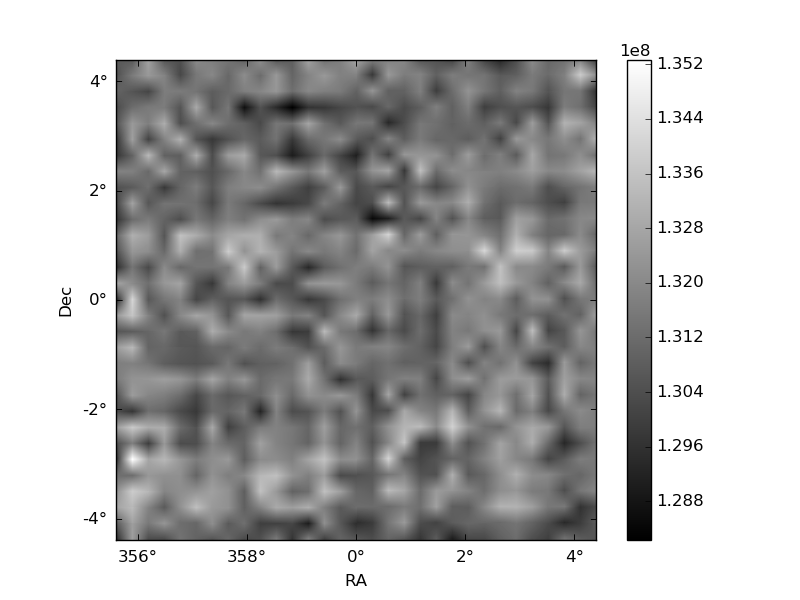
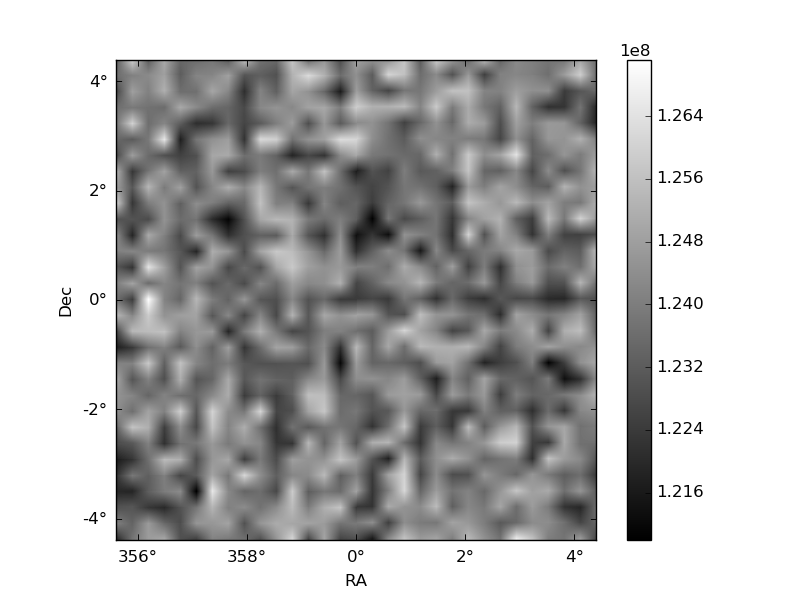
Histogram calculated using DETX and DETY for each event in the final _common_clean file
| Quadrant A | 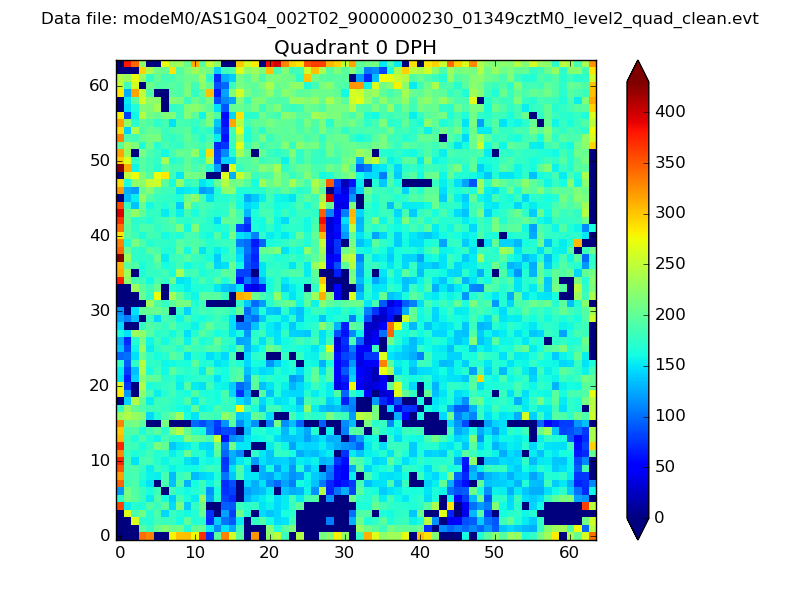 |
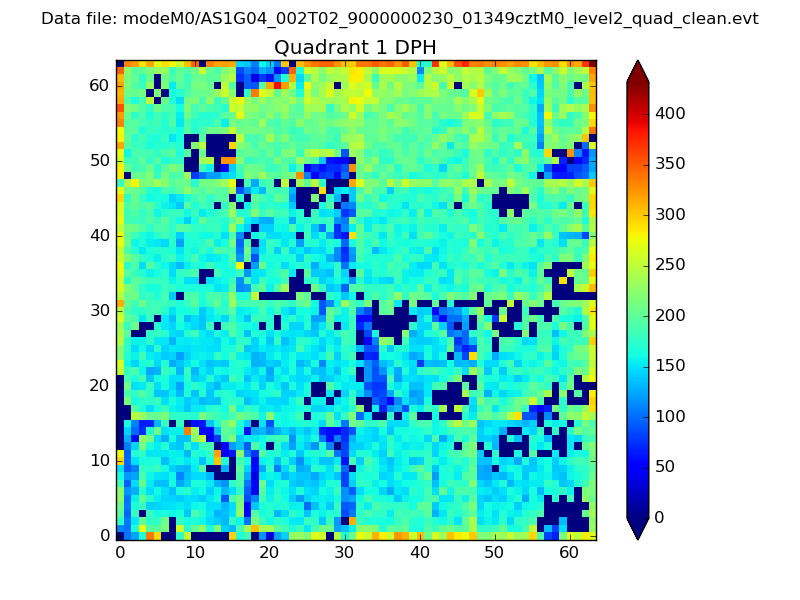 |
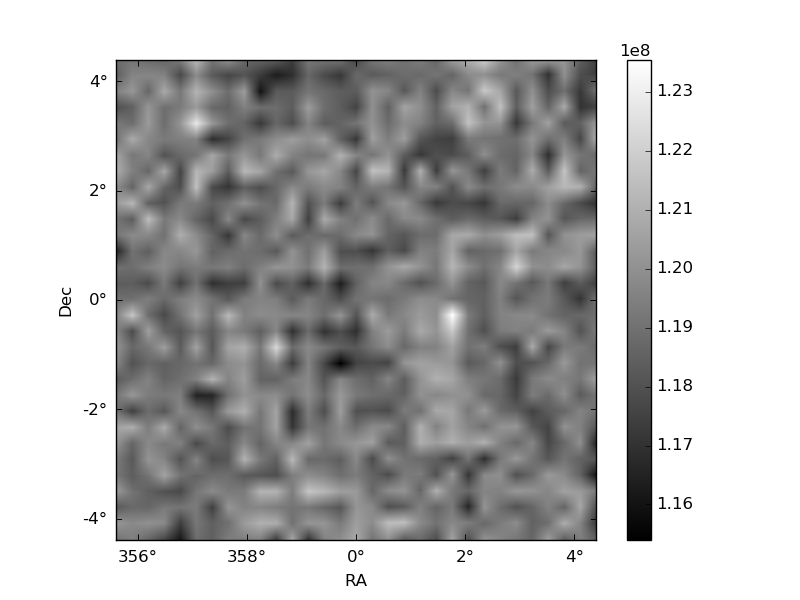
Quadrant B |
|---|---|---|---|
| Quadrant D | 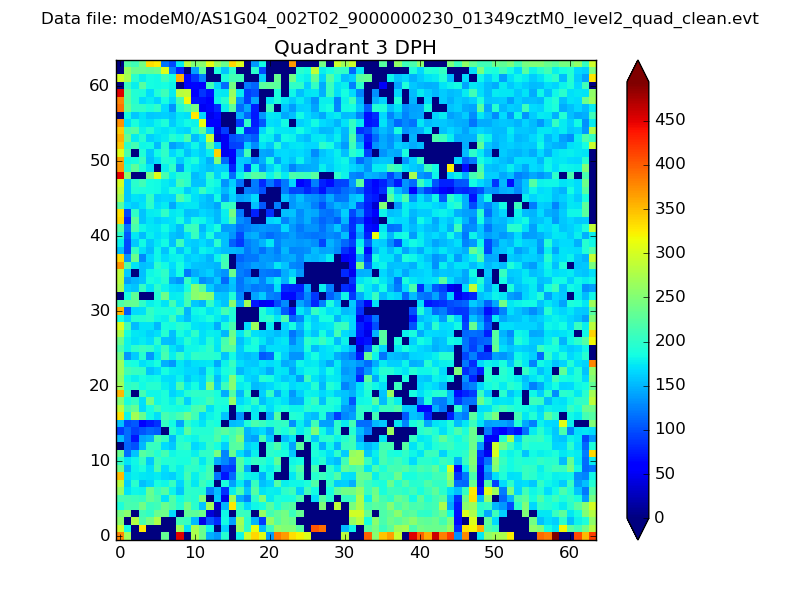 |
 |
Quadrant C |
| Plot type | Count rate plots | Images |
|---|---|---|
| Comparison with Poisson distribution Blue bars denote a histogram of data divided into 1 sec bins. Red curve is a Poisson curve with rate = median count rate of data. |
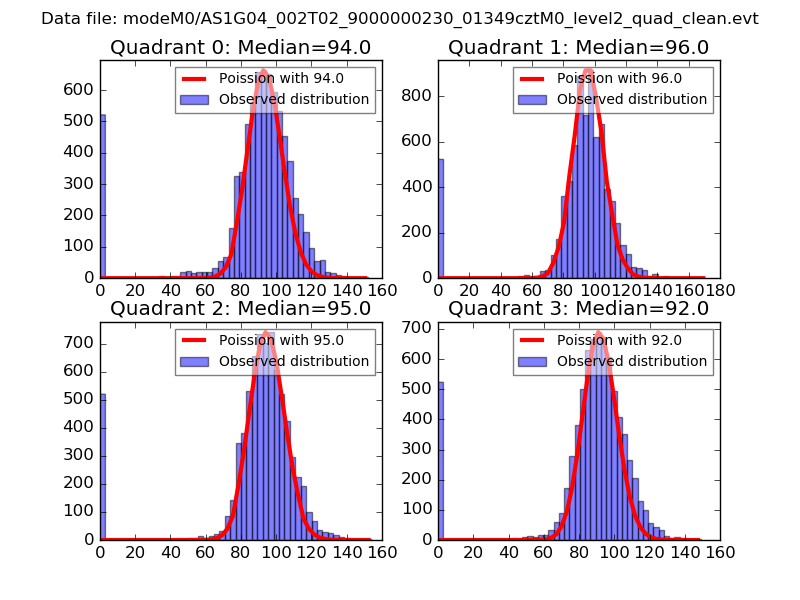 |
 |
| Quadrant-wise count rates Data is divided into 100 sec bins |
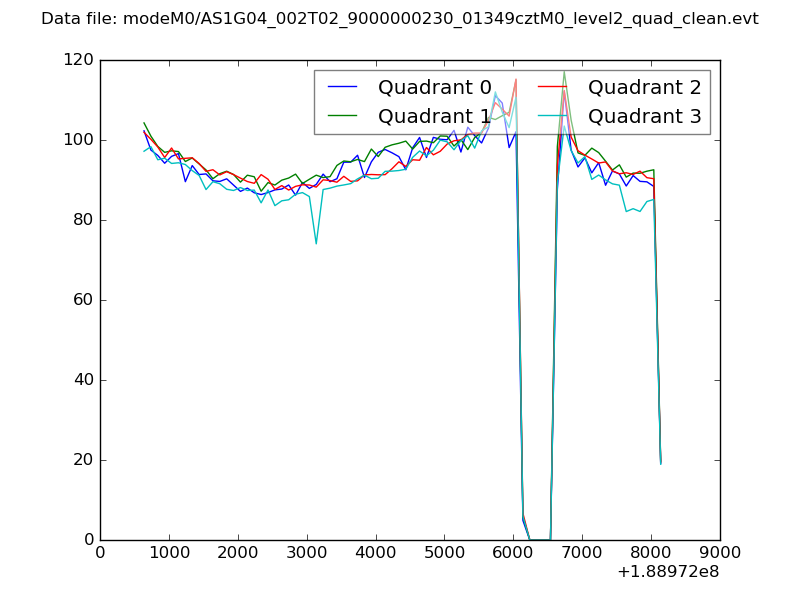 |
|
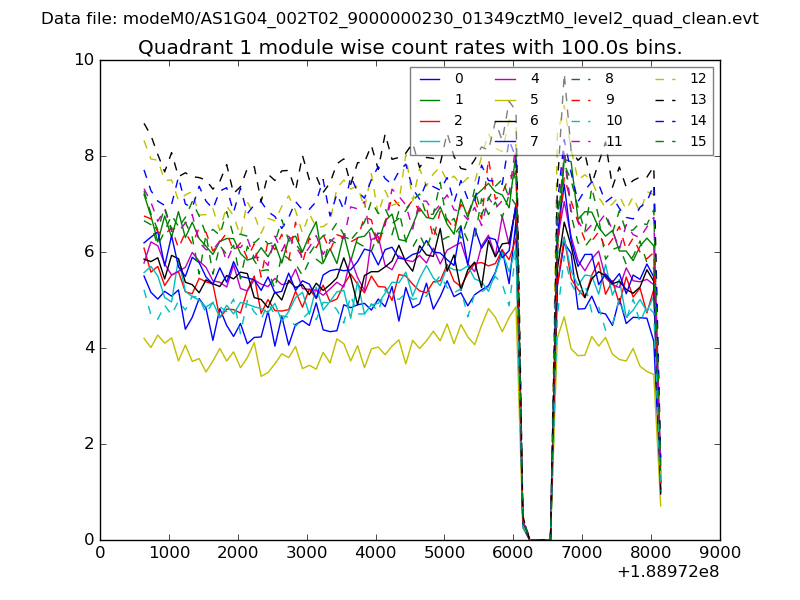
| Module-wise count rates for Quadrant A Data is divided into 100 sec bins |
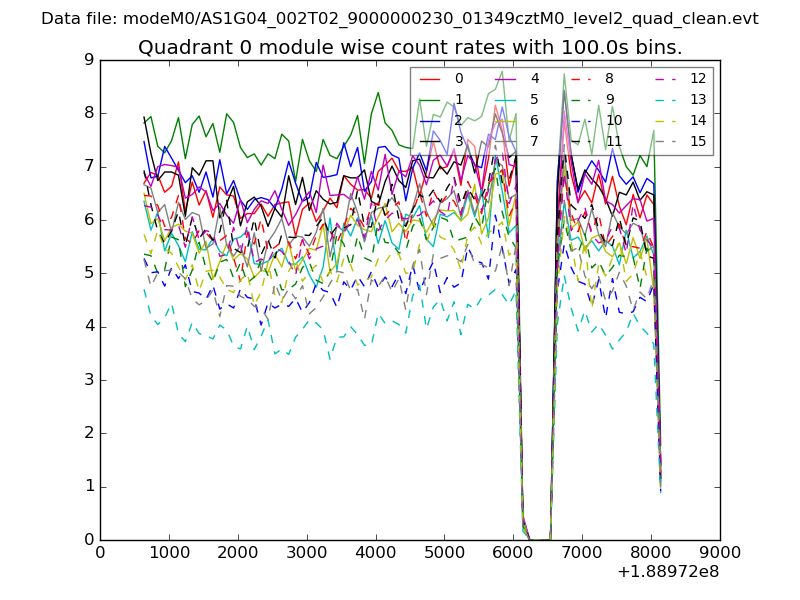 |
 |
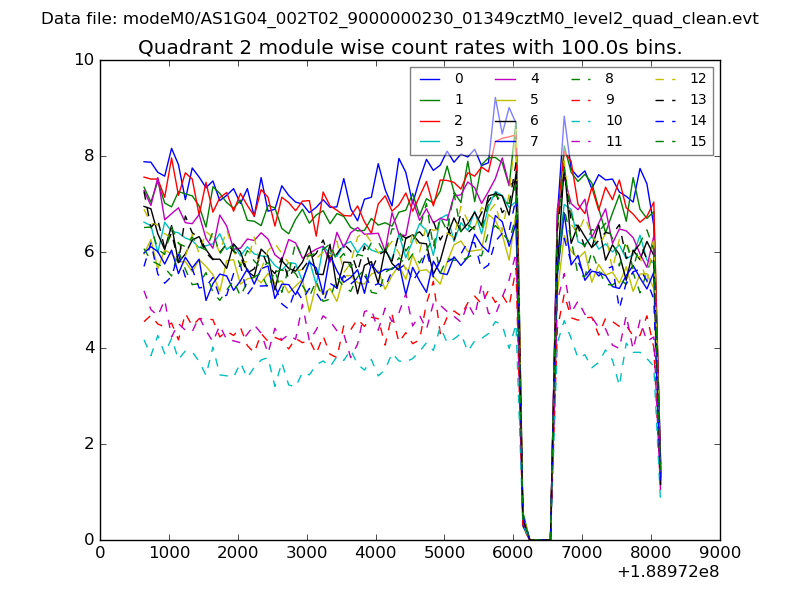
| Module-wise count rates for Quadrant B Data is divided into 100 sec bins |
 |
 |
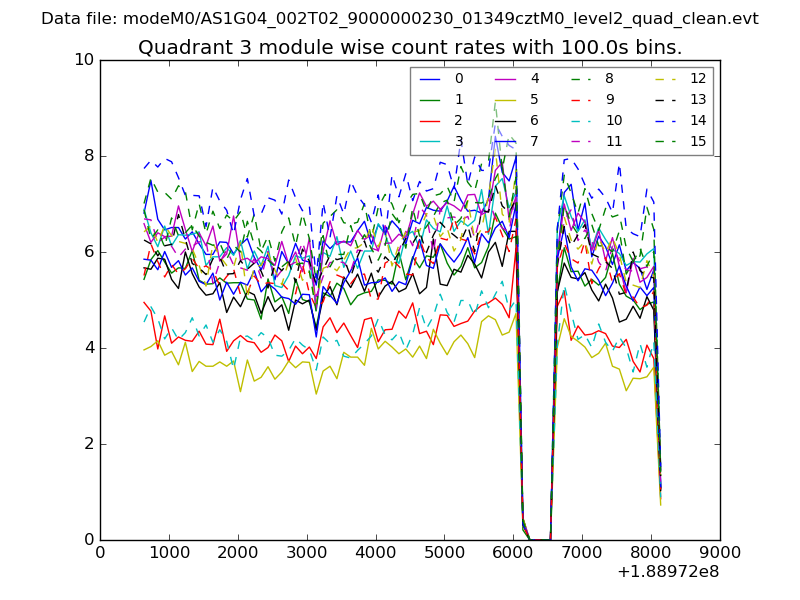
| Module-wise count rates for Quadrant C Data is divided into 100 sec bins |
 |
 |
| Module-wise count rates for Quadrant D Data is divided into 100 sec bins |
 |
 |
| Parameter | Plot |
|---|---|
| CZT HV Monitor | 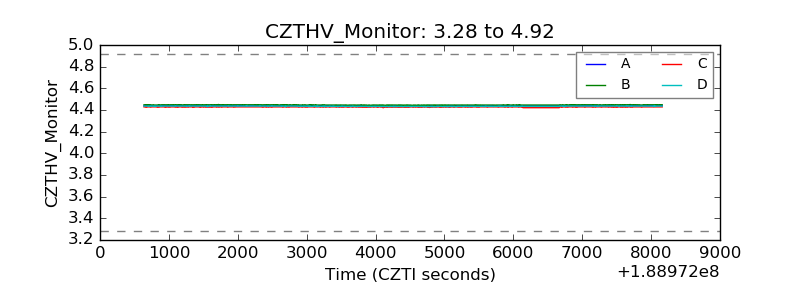 |
| D_VDD | 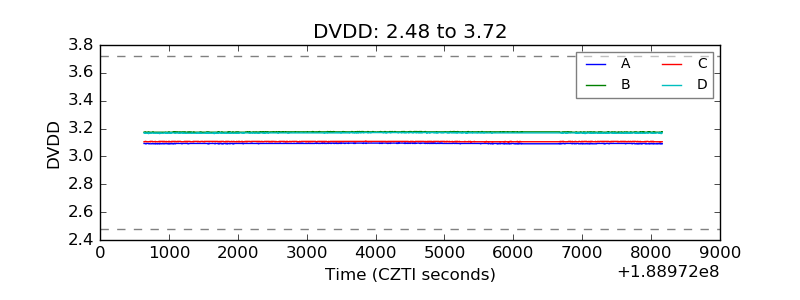 |
| Temperature 1 | 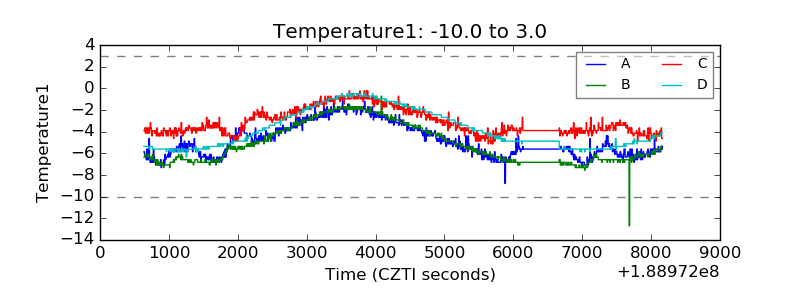 |
| Veto HV Monitor | 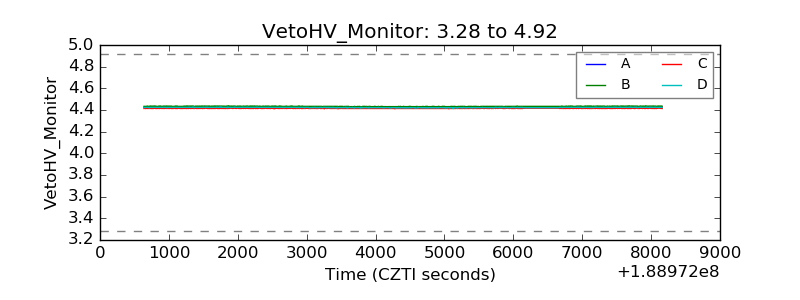 |
| Veto LLD | 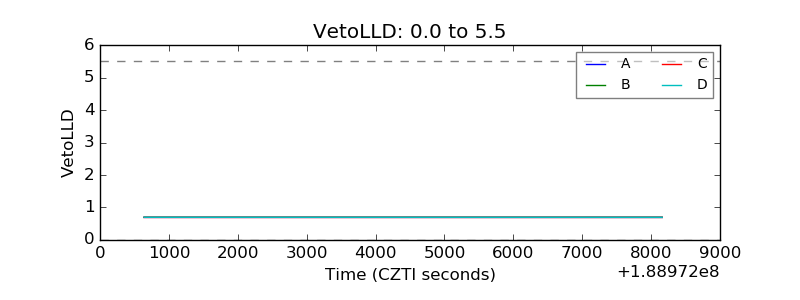 |
| Alpha Counter | 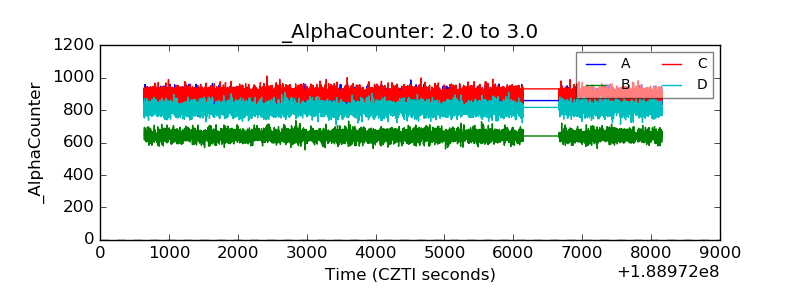 |
| _CPM_Rate | 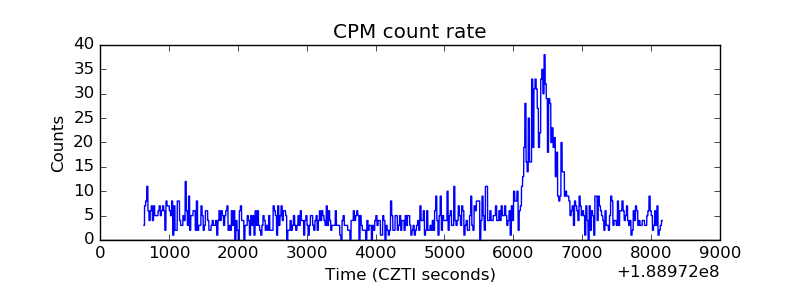 |
| CZT Counter | 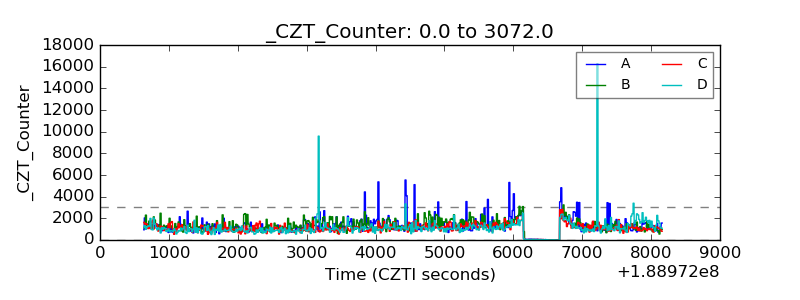 |
| +2.5 Volts monitor |  |
| +5 Volts monitor |  |
| _ROLL_ROT | 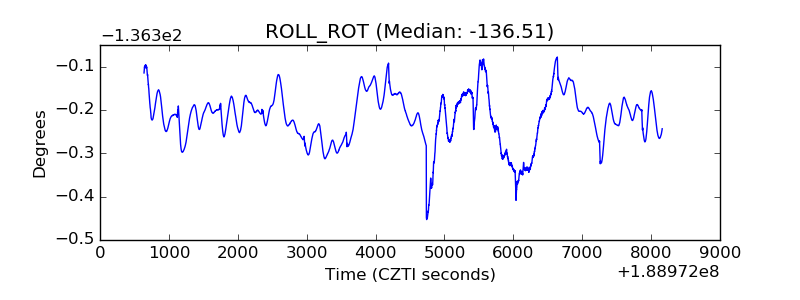 |
| _Roll_DEC | 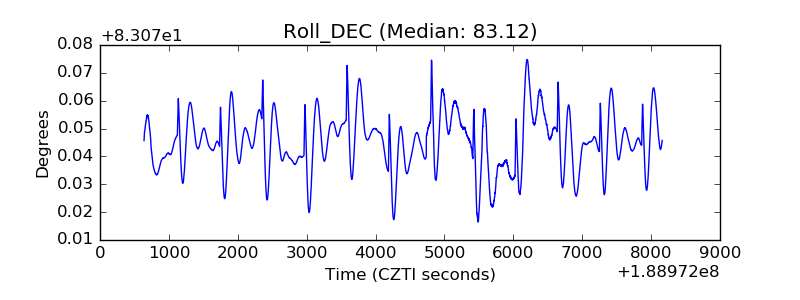 |
| _Roll_RA | 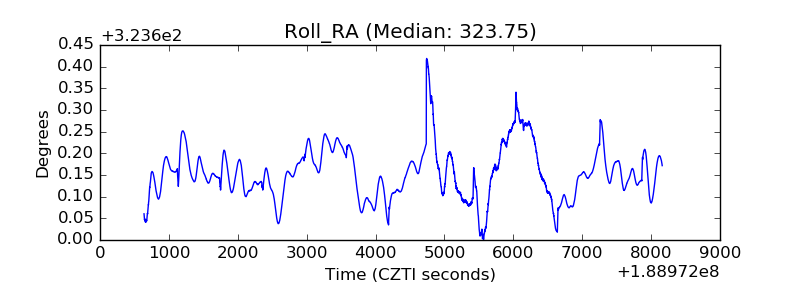 |
| Veto Counter | 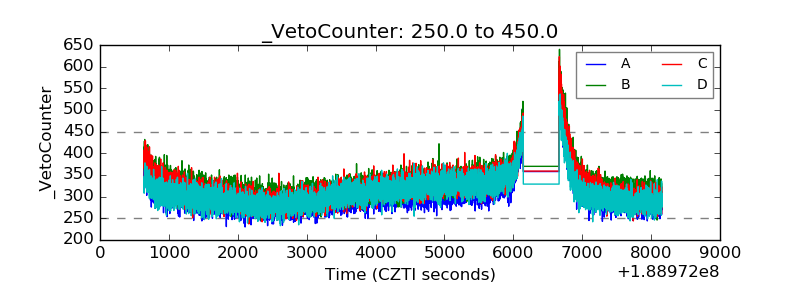 |