| Param | Original file | Final file |
|---|---|---|
| Filename | modeM0/AS1G04_002T02_9000000230_01350cztM0_level2.evt | modeM0/AS1G04_002T02_9000000230_01350cztM0_level2_quad_clean.evt |
| Size (bytes) | 1,298,793,600 | 105,912,000 |
| Size | 1.2 GB | 101.0 MB |
| Events in quadrant A | 11,326,020 | 671,218 |
| Events in quadrant B | 10,302,013 | 689,635 |
| Events in quadrant C | 8,426,673 | 681,454 |
| Events in quadrant D | 8,803,523 | 662,795 |
| Mode M0 | |||
|---|---|---|---|
| Quadrant | BADHDUFLAG | Total packets | Discarded packets |
| A | 0 | 38834 | 2 |
| B | 0 | 35698 | 1 |
| C | 0 | 30169 | 1 |
| D | 0 | 31263 | 1 |
| Mode SS | |||
|---|---|---|---|
| Quadrant | BADHDUFLAG | Total packets | Discarded packets |
| A | 0 | 144 | 0 |
| B | 0 | 144 | 0 |
| C | 0 | 144 | 0 |
| D | 0 | 144 | 0 |
| Quadrant | Total seconds | Saturated seconds | Saturation percentage |
|---|---|---|---|
| A | 7211 | 505 | 7.003190% |
| B | 7211 | 124 | 1.719595% |
| C | 7211 | 2 | 0.027735% |
| D | 7211 | 55 | 0.762724% |
Noise dominated data is calculated using 1-second bins in cleaned event files. If a bin has >2000 counts, and if more than 50% of those come from <1% of pixels, then it is considered to be noise-dominated and hence unusable.
| Quadrant | # 1 sec bins | Bins with >0 counts | Bins with >2000 counts | High rate bins dominated by noise | Noise dominated (total time) | Noise dominated (detector-on time) | Marked lightcurve |
|---|---|---|---|---|---|---|---|
| A | 7226 | 7211 | 1704 | 1704 | 23.58% | 23.63% | 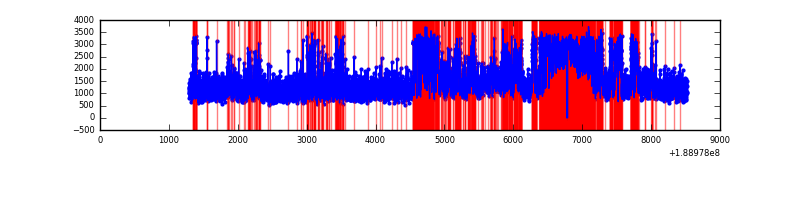 |
| B | 7226 | 7212 | 970 | 970 | 13.42% | 13.45% | 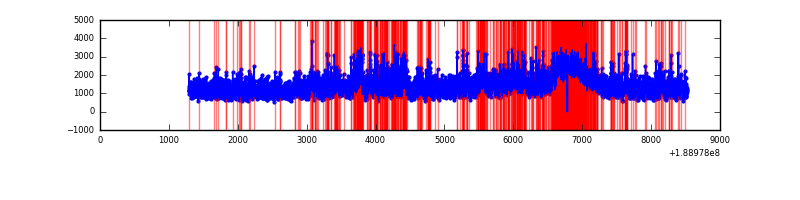 |
| C | 7226 | 7212 | 265 | 265 | 3.67% | 3.67% | 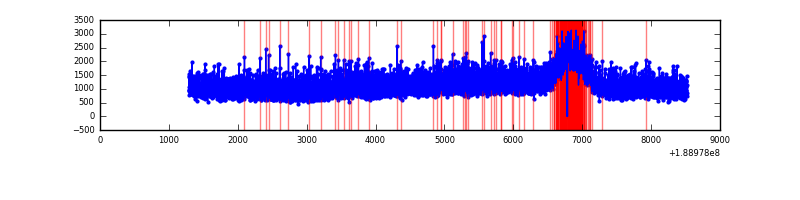 |
| D | 7225 | 7211 | 610 | 610 | 8.44% | 8.46% | 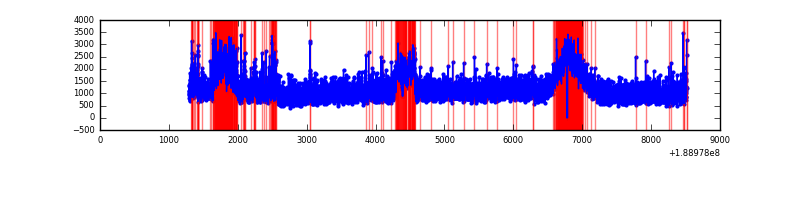 |
Top three noisy pixels from each quadrant. If the there are fewer than three noisy pixels in the level2.evt file, extra rows are filled as -1
| Pixel properties | Quadrant properties | ||||||
|---|---|---|---|---|---|---|---|
| Quadrant | DetID | PixID | Counts | Sigma | Mean | Median | Sigma |
| A | 15 | 127 | 2603075 | 4709.08 | 2249 | 2263 | 552.3 |
| A | 4 | 32 | 45262 | 77.85 | 2249 | 2263 | 552.3 |
| A | 12 | 243 | 34843 | 58.99 | 2249 | 2263 | 552.3 |
| B | 8 | 4 | 718739 | 1286.32 | 2344 | 2358 | 556.9 |
| B | 5 | 191 | 190895 | 338.53 | 2344 | 2358 | 556.9 |
| B | 6 | 53 | 161194 | 285.2 | 2344 | 2358 | 556.9 |
| C | 15 | 241 | 167650 | 281.03 | 2102 | 2174 | 588.8 |
| C | 3 | 111 | 26059 | 40.56 | 2102 | 2174 | 588.8 |
| C | 3 | 79 | 23452 | 36.14 | 2102 | 2174 | 588.8 |
| D | 15 | 13 | 425513 | 663.84 | 2057 | 2127 | 637.8 |
| D | 9 | 53 | 369540 | 576.08 | 2057 | 2127 | 637.8 |
| D | 1 | 83 | 140525 | 217.0 | 2057 | 2127 | 637.8 |
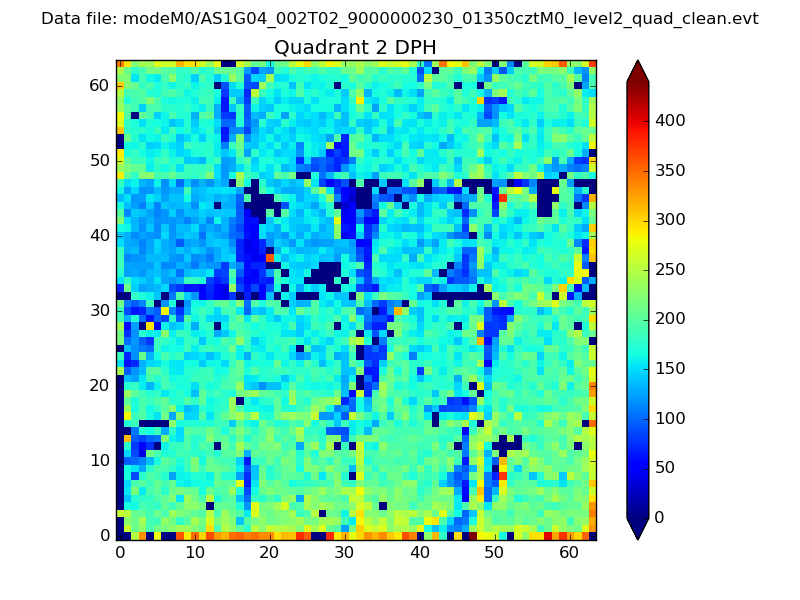
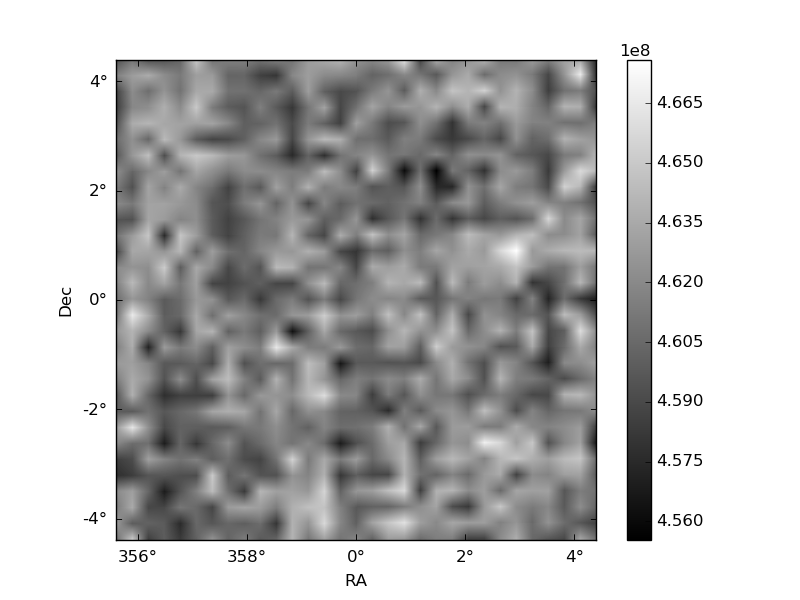
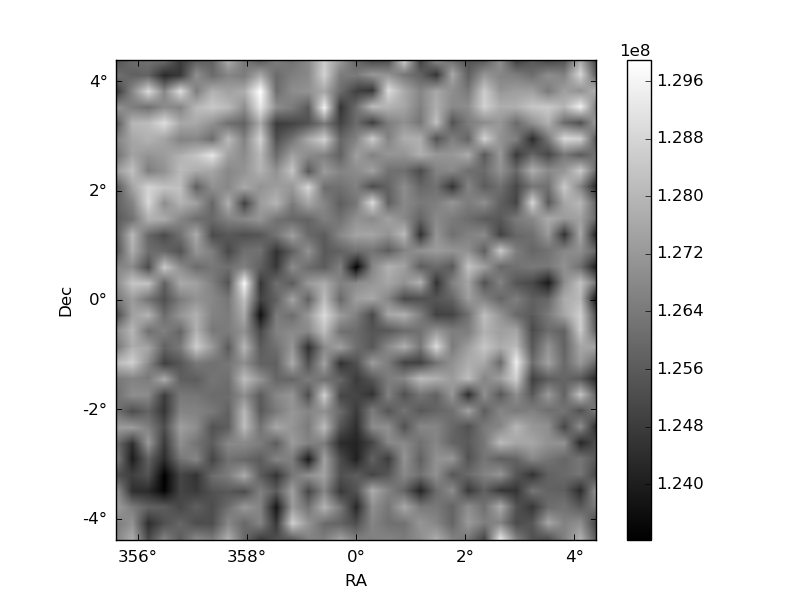
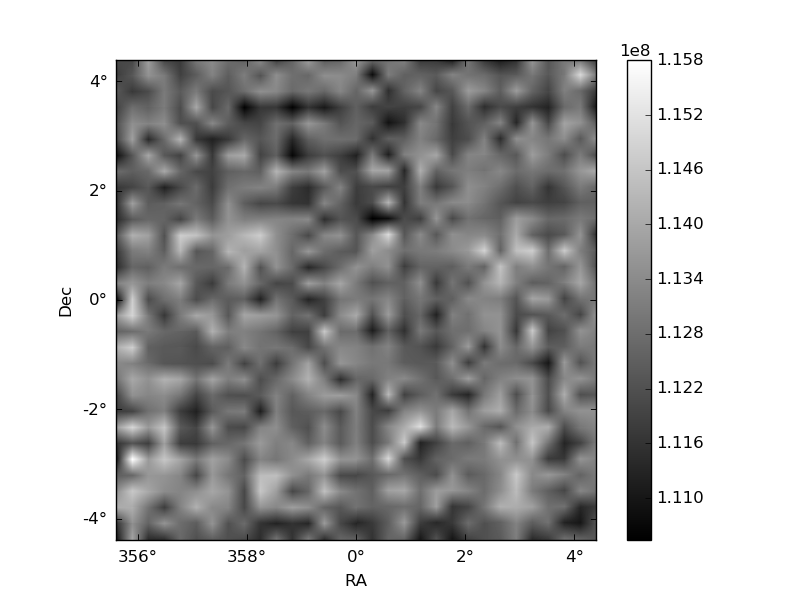
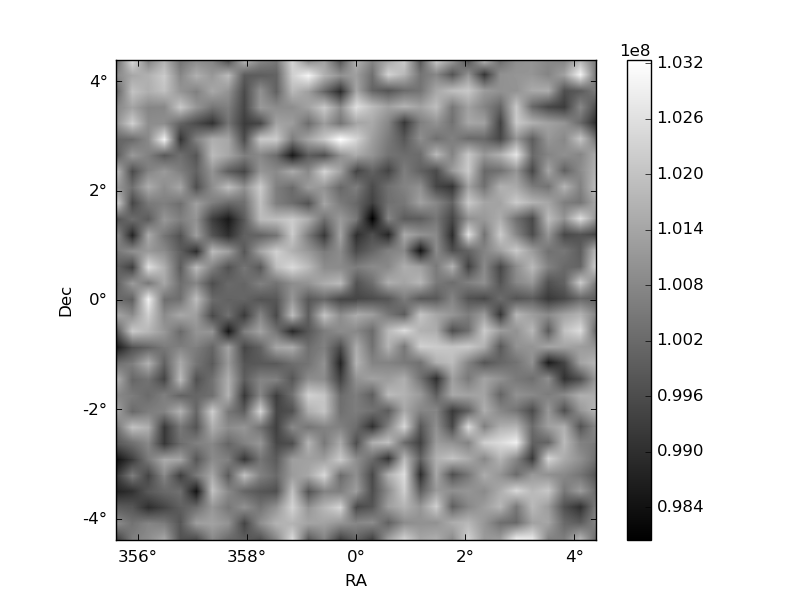
Histogram calculated using DETX and DETY for each event in the final _common_clean file
| Quadrant A | 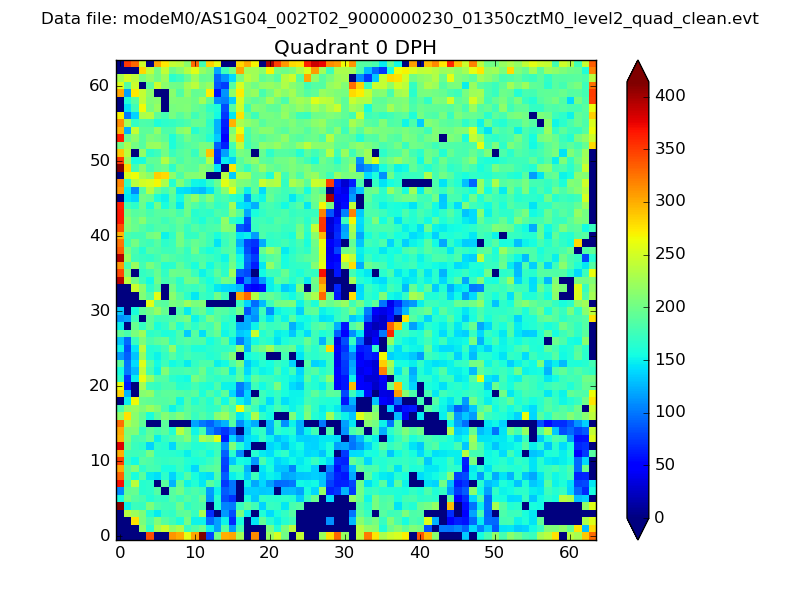 |
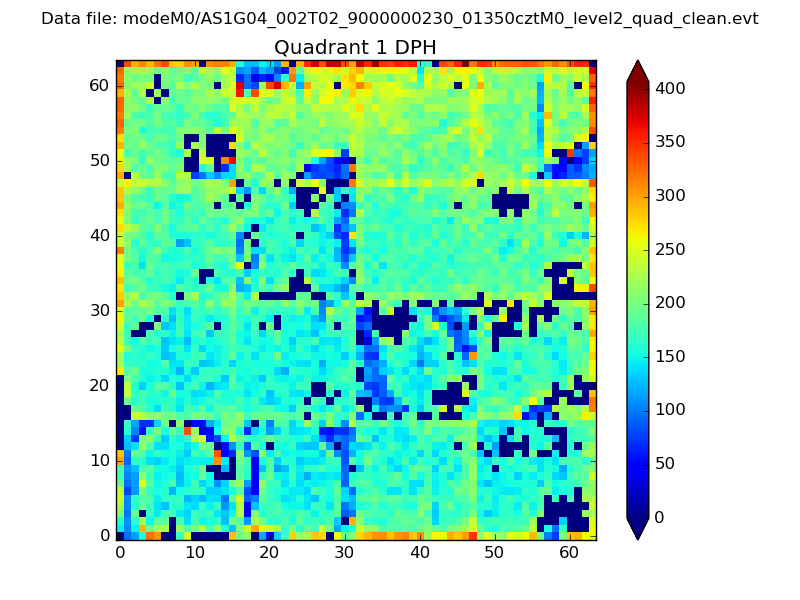 |
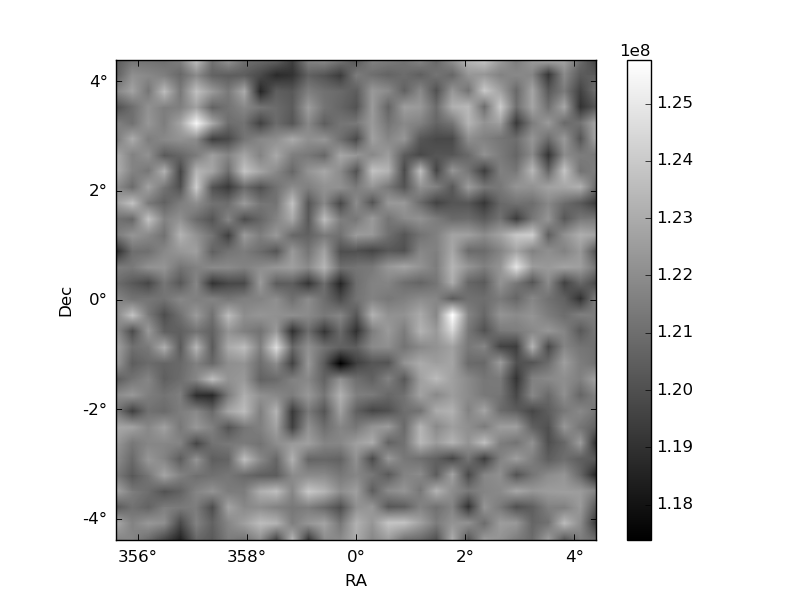
Quadrant B |
|---|---|---|---|
| Quadrant D | 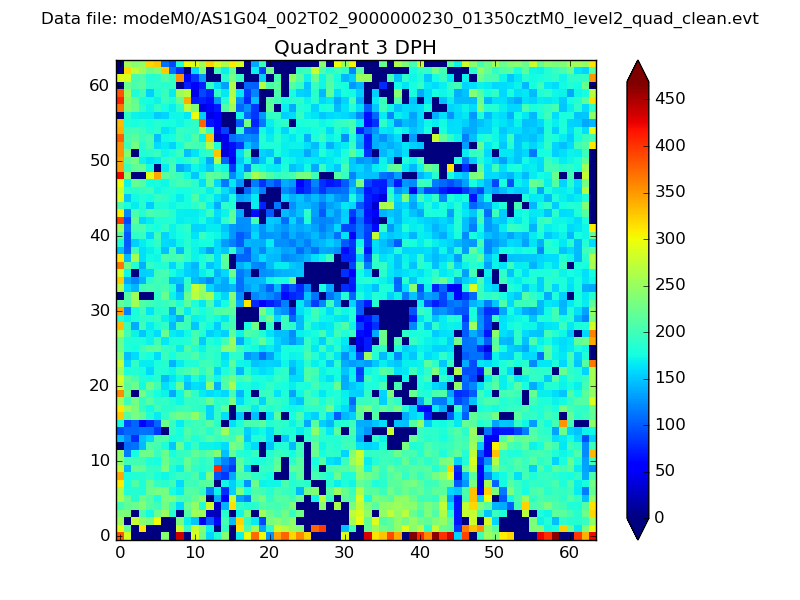 |
 |
Quadrant C |
| Plot type | Count rate plots | Images |
|---|---|---|
| Comparison with Poisson distribution Blue bars denote a histogram of data divided into 1 sec bins. Red curve is a Poisson curve with rate = median count rate of data. |
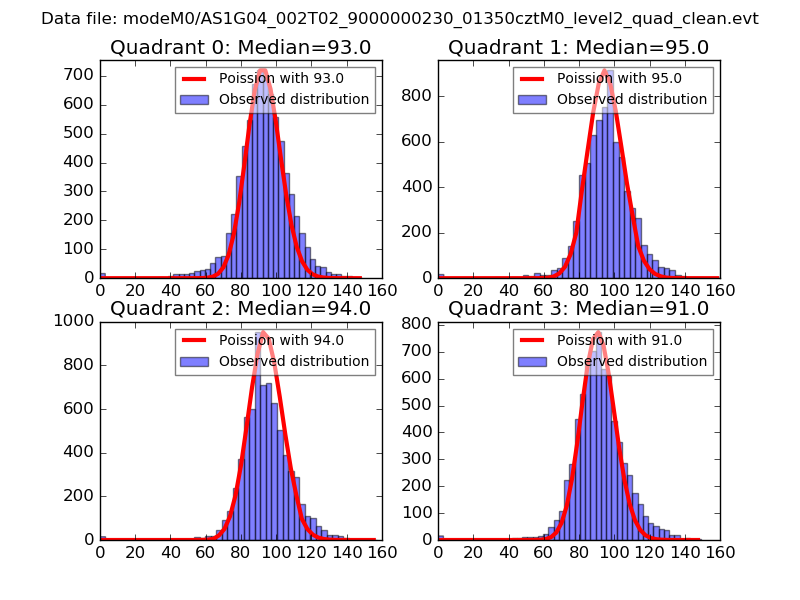 |
 |
| Quadrant-wise count rates Data is divided into 100 sec bins |
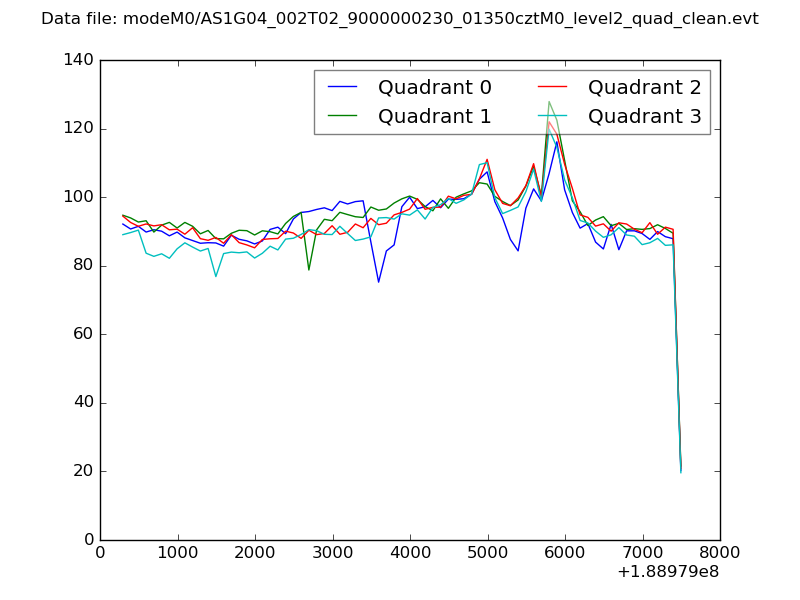 |
|
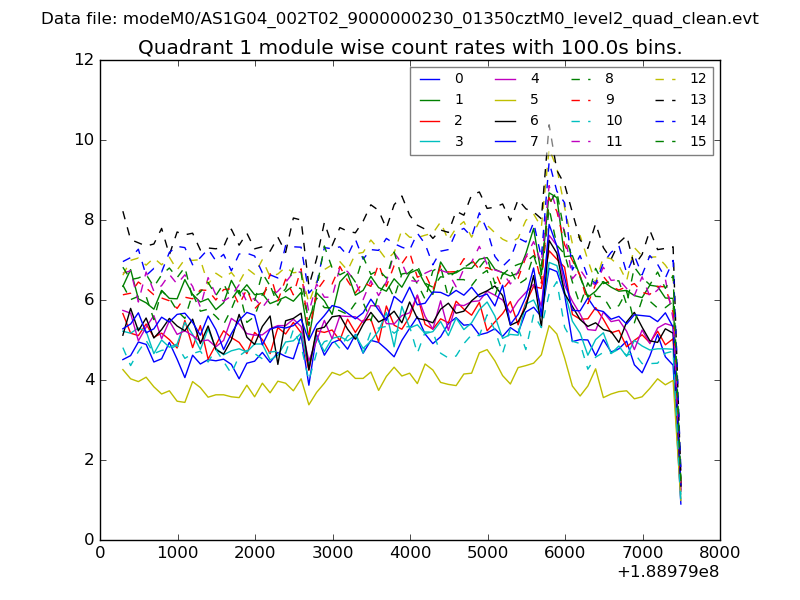
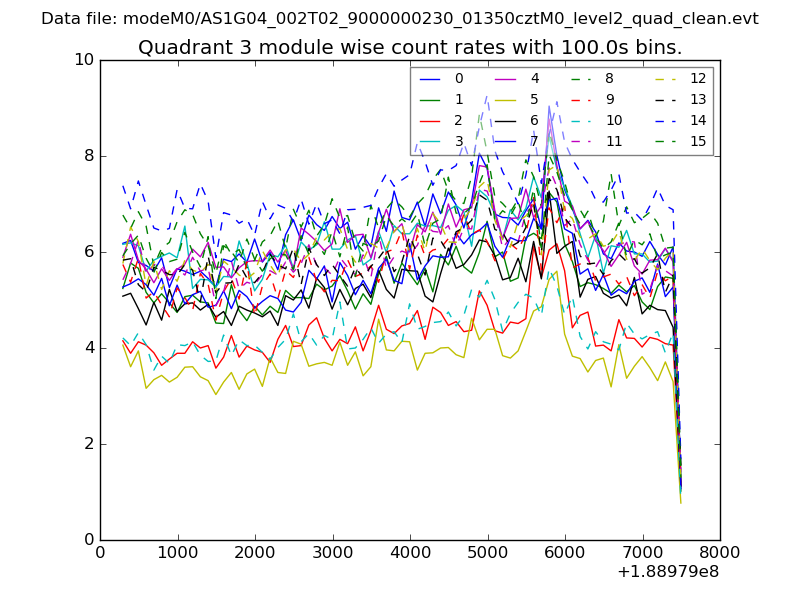
| Module-wise count rates for Quadrant A Data is divided into 100 sec bins |
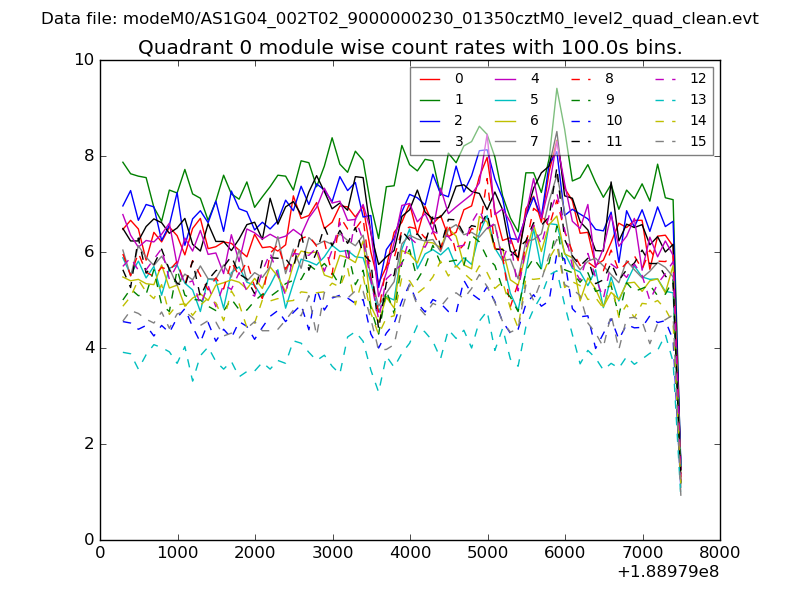 |
 |
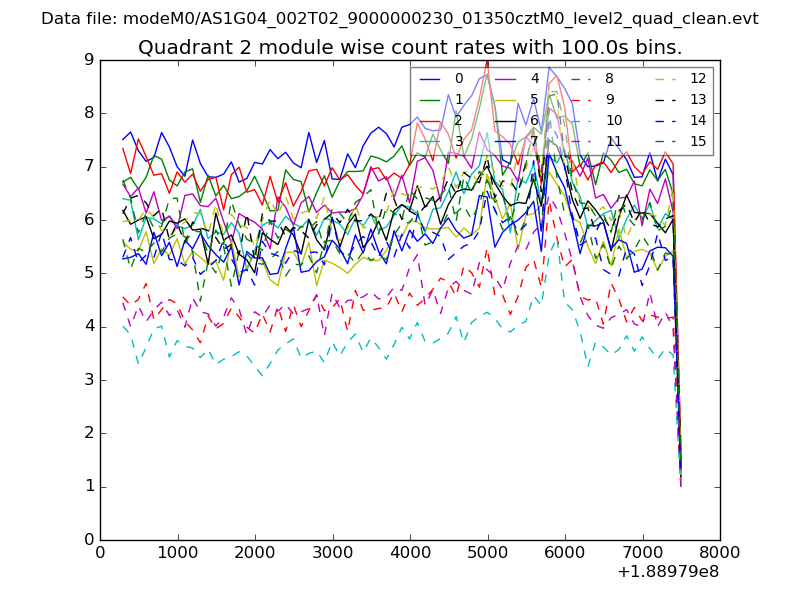
| Module-wise count rates for Quadrant B Data is divided into 100 sec bins |
 |
 |
| Module-wise count rates for Quadrant C Data is divided into 100 sec bins |
 |
 |
| Module-wise count rates for Quadrant D Data is divided into 100 sec bins |
 |
 |
| Parameter | Plot |
|---|---|
| CZT HV Monitor | 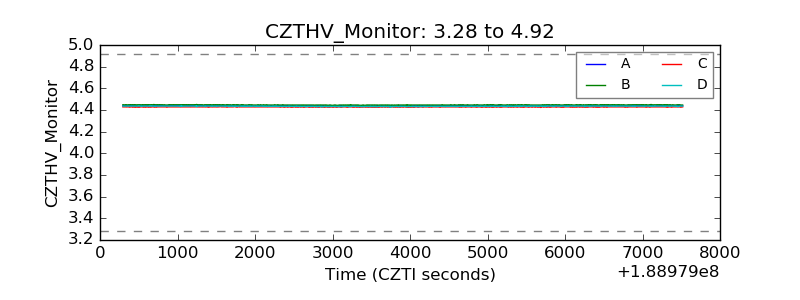 |
| D_VDD | 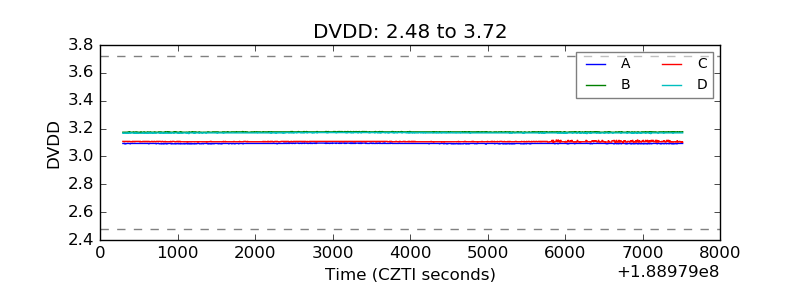 |
| Temperature 1 | 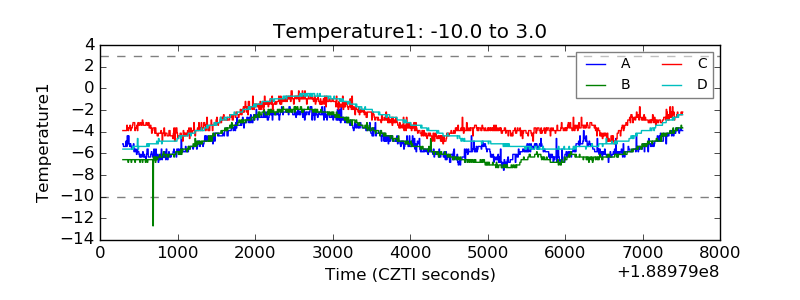 |
| Veto HV Monitor |  |
| Veto LLD | 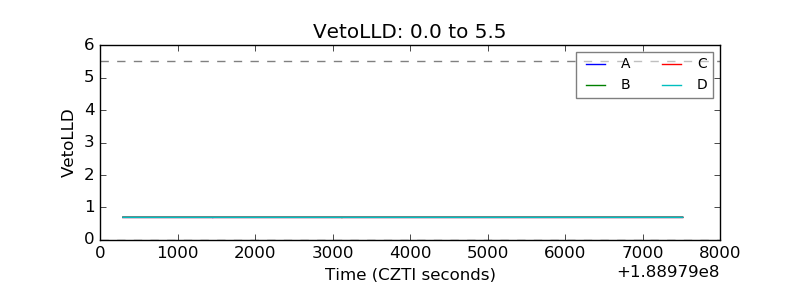 |
| Alpha Counter | 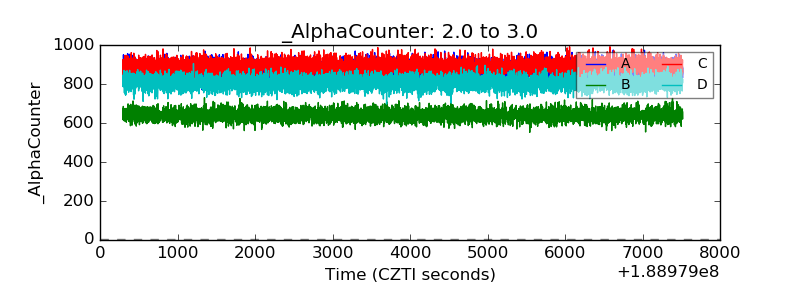 |
| _CPM_Rate | 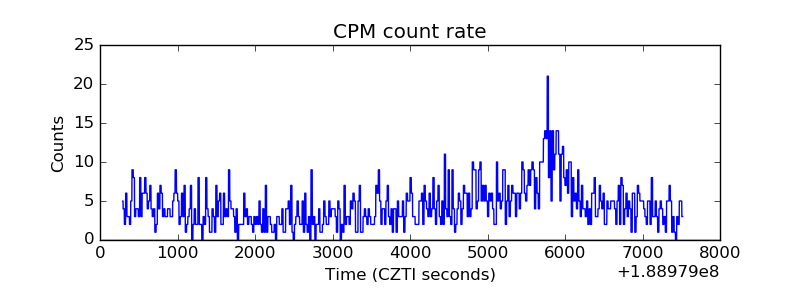 |
| CZT Counter | 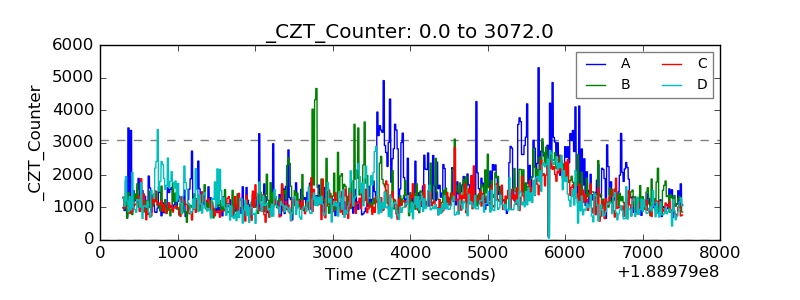 |
| +2.5 Volts monitor |  |
| +5 Volts monitor |  |
| _ROLL_ROT | 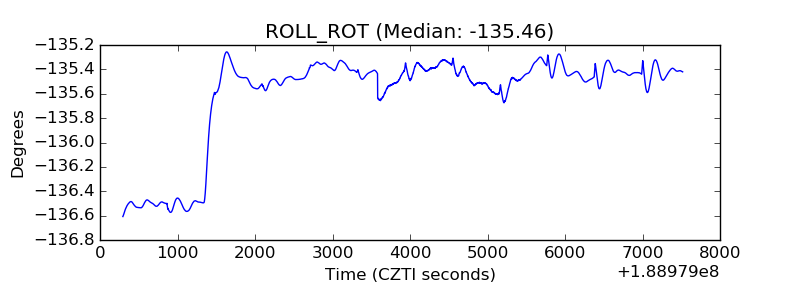 |
| _Roll_DEC | 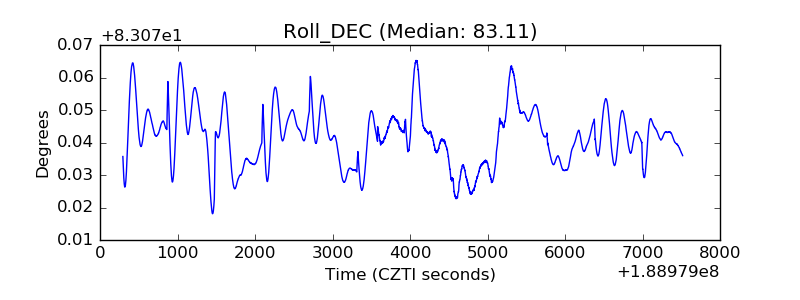 |
| _Roll_RA | 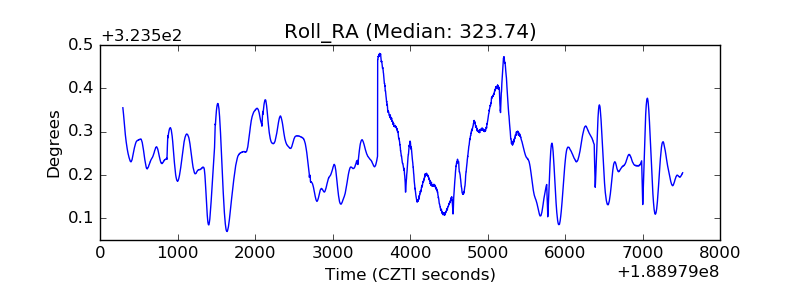 |
| Veto Counter | 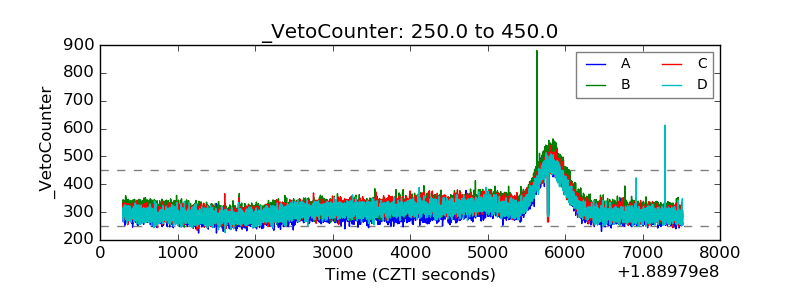 |