| Param | Original file | Final file |
|---|---|---|
| Filename | modeM0/AS1G04_002T02_9000000230_01351cztM0_level2.evt | modeM0/AS1G04_002T02_9000000230_01351cztM0_level2_quad_clean.evt |
| Size (bytes) | 671,238,720 | 53,441,280 |
| Size | 640.1 MB | 51.0 MB |
| Events in quadrant A | 6,190,997 | 332,353 |
| Events in quadrant B | 4,953,877 | 352,214 |
| Events in quadrant C | 4,622,030 | 346,816 |
| Events in quadrant D | 4,326,818 | 336,026 |
| Mode M0 | |||
|---|---|---|---|
| Quadrant | BADHDUFLAG | Total packets | Discarded packets |
| A | 0 | 21966 | 1063 |
| B | 0 | 18196 | 998 |
| C | 0 | 17182 | 932 |
| D | 0 | 16186 | 838 |
| Mode SS | |||
|---|---|---|---|
| Quadrant | BADHDUFLAG | Total packets | Discarded packets |
| A | 0 | 74 | 2 |
| B | 0 | 74 | 2 |
| C | 0 | 74 | 2 |
| D | 0 | 74 | 2 |
| Quadrant | Total seconds | Saturated seconds | Saturation percentage |
|---|---|---|---|
| A | 3530 | 297 | 8.413598% |
| B | 3528 | 15 | 0.425170% |
| C | 3536 | 24 | 0.678733% |
| D | 3534 | 39 | 1.103565% |
Noise dominated data is calculated using 1-second bins in cleaned event files. If a bin has >2000 counts, and if more than 50% of those come from <1% of pixels, then it is considered to be noise-dominated and hence unusable.
| Quadrant | # 1 sec bins | Bins with >0 counts | Bins with >2000 counts | High rate bins dominated by noise | Noise dominated (total time) | Noise dominated (detector-on time) | Marked lightcurve |
|---|---|---|---|---|---|---|---|
| A | 3709 | 3552 | 1101 | 1101 | 29.68% | 31.00% | 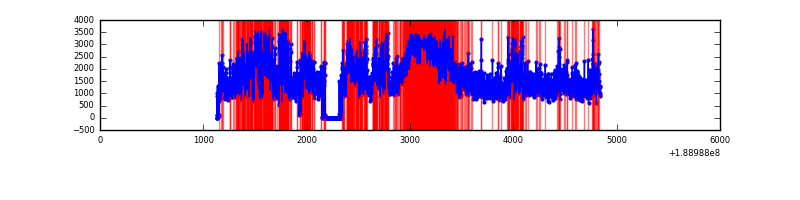 |
| B | 3705 | 3556 | 391 | 391 | 10.55% | 11.00% | 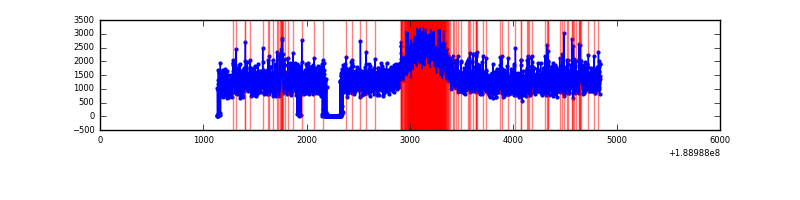 |
| C | 3709 | 3558 | 333 | 333 | 8.98% | 9.36% | 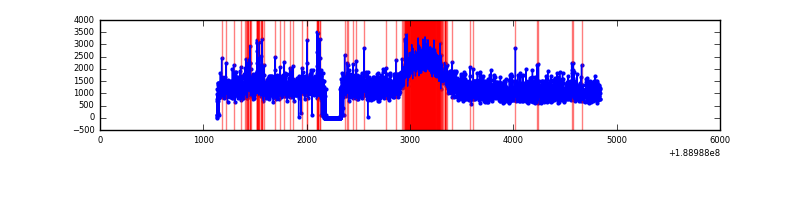 |
| D | 3707 | 3561 | 315 | 315 | 8.50% | 8.85% | 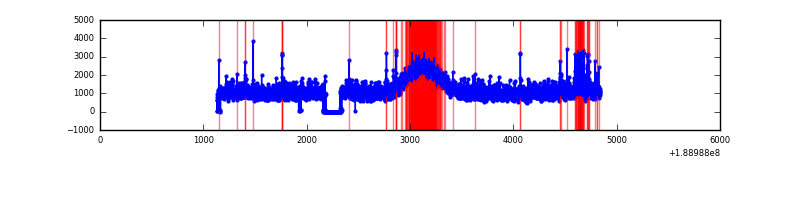 |
Top three noisy pixels from each quadrant. If the there are fewer than three noisy pixels in the level2.evt file, extra rows are filled as -1
| Pixel properties | Quadrant properties | ||||||
|---|---|---|---|---|---|---|---|
| Quadrant | DetID | PixID | Counts | Sigma | Mean | Median | Sigma |
| A | 15 | 127 | 1561632 | 5251.31 | 1201 | 1210 | 297.1 |
| A | 0 | 51 | 12849 | 39.17 | 1201 | 1210 | 297.1 |
| A | 4 | 32 | 7122 | 19.9 | 1201 | 1210 | 297.1 |
| B | 12 | 52 | 79118 | 254.86 | 1257 | 1266 | 305.5 |
| B | 6 | 53 | 42282 | 134.27 | 1257 | 1266 | 305.5 |
| B | 15 | 22 | 17830 | 54.22 | 1257 | 1266 | 305.5 |
| C | 12 | 4 | 94115 | 292.31 | 1125 | 1165 | 318.0 |
| C | 15 | 241 | 91285 | 283.41 | 1125 | 1165 | 318.0 |
| C | 14 | 223 | 19653 | 58.14 | 1125 | 1165 | 318.0 |
| D | 13 | 205 | 48992 | 145.99 | 1108 | 1125 | 327.9 |
| D | 13 | 252 | 35437 | 104.65 | 1108 | 1125 | 327.9 |
| D | 13 | 73 | 28505 | 83.51 | 1108 | 1125 | 327.9 |
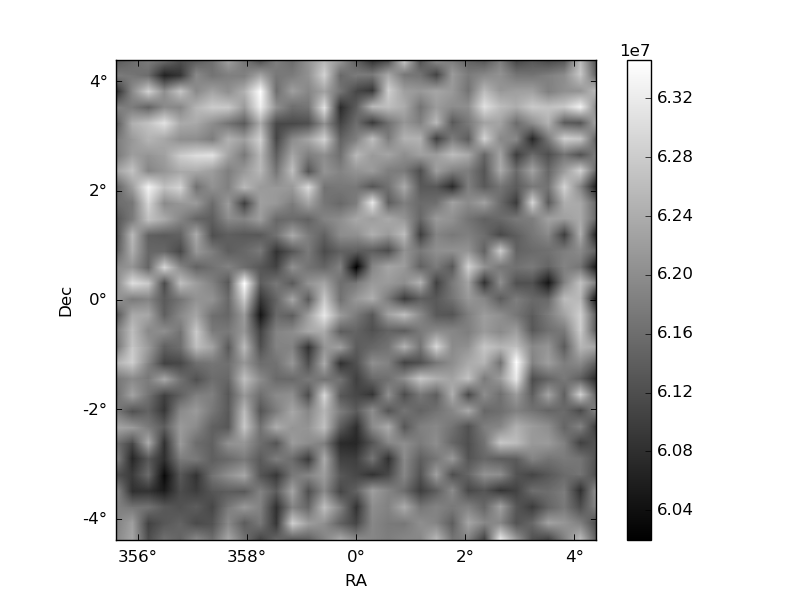
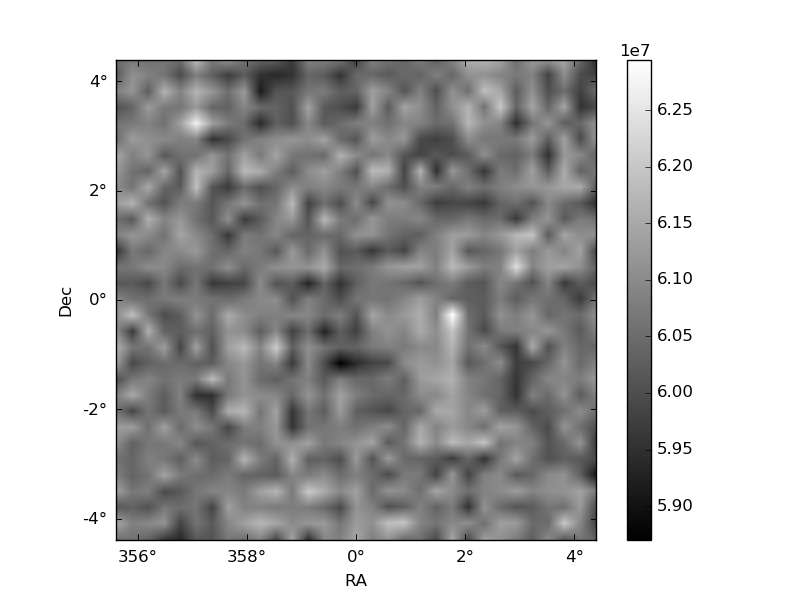
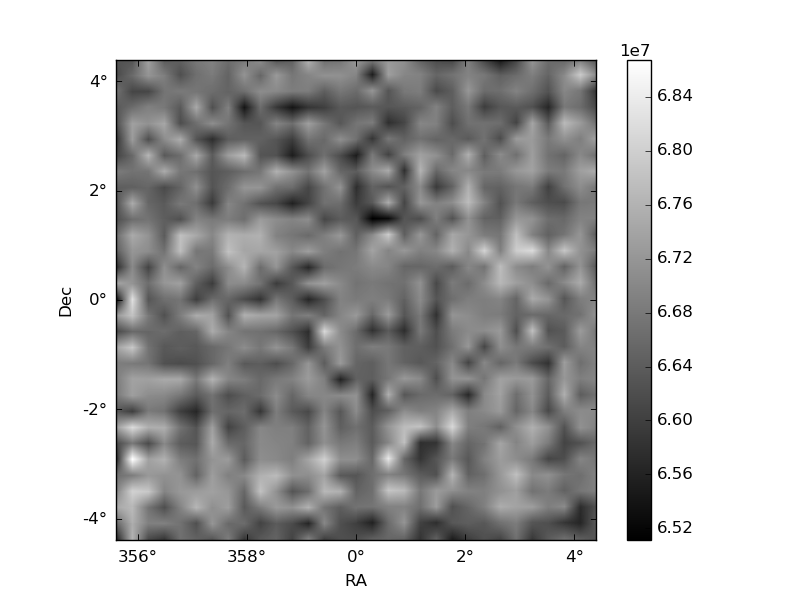
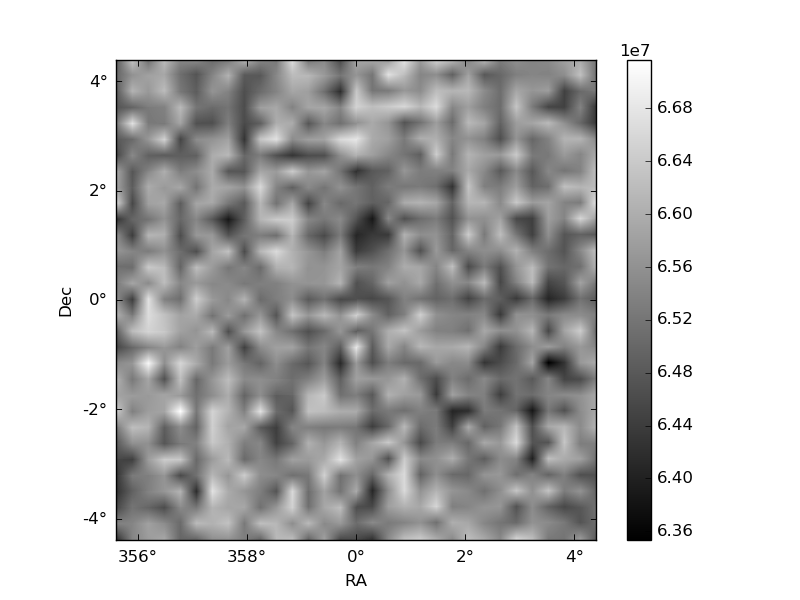
Histogram calculated using DETX and DETY for each event in the final _common_clean file
| Quadrant A | 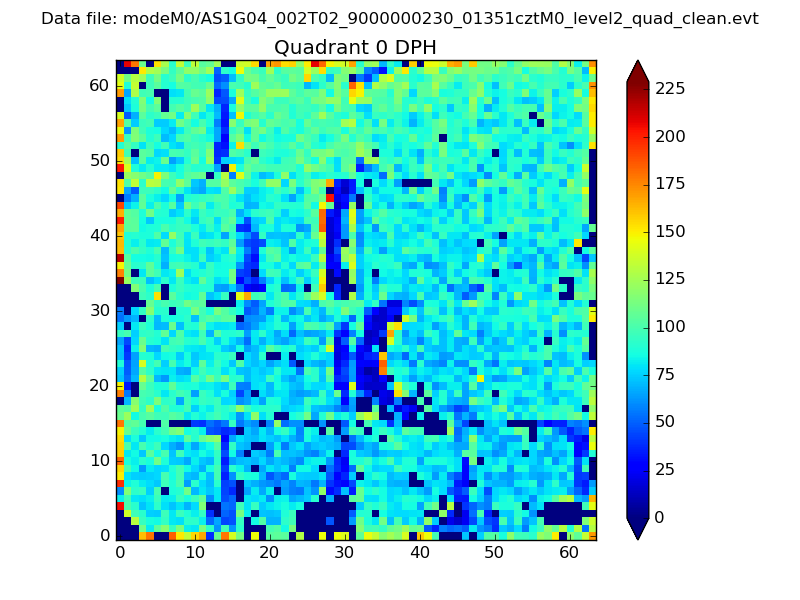 |
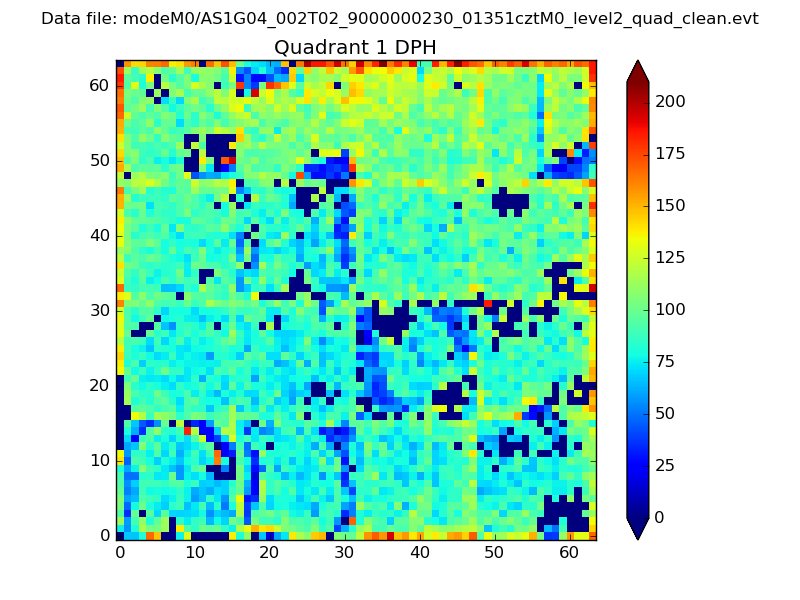 |
Quadrant B |
|---|---|---|---|
| Quadrant D | 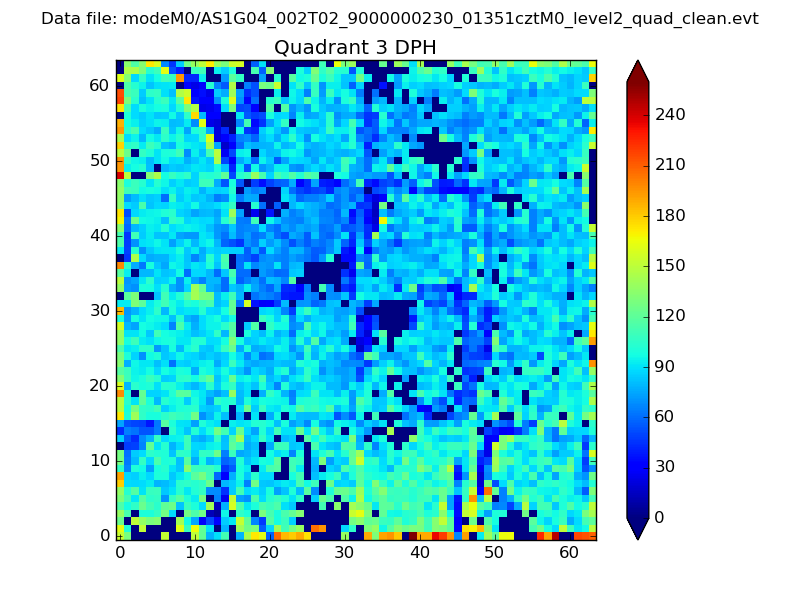 |
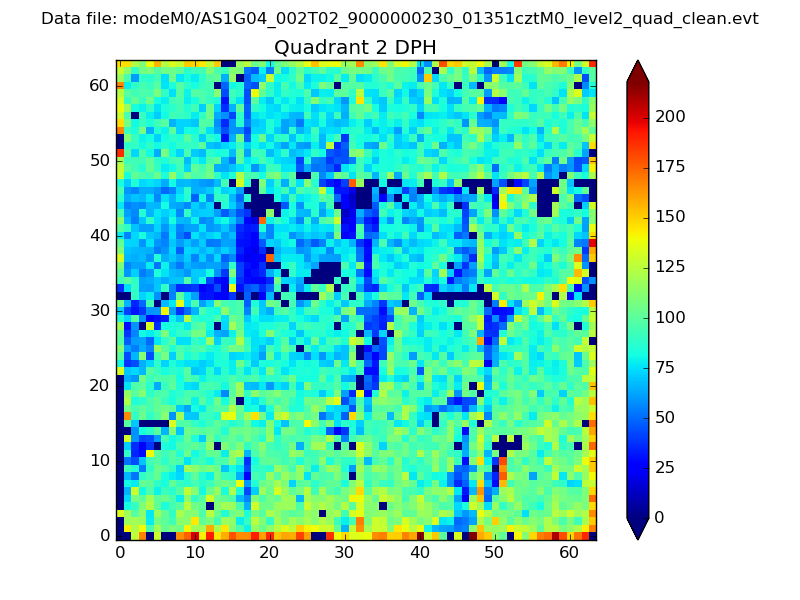 |
Quadrant C |
| Plot type | Count rate plots | Images |
|---|---|---|
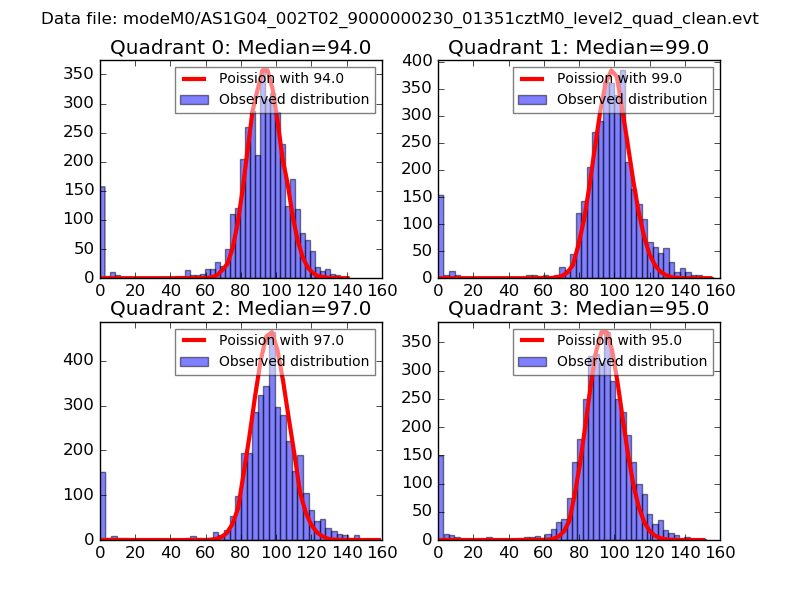
| Comparison with Poisson distribution Blue bars denote a histogram of data divided into 1 sec bins. Red curve is a Poisson curve with rate = median count rate of data. |
 |
 |
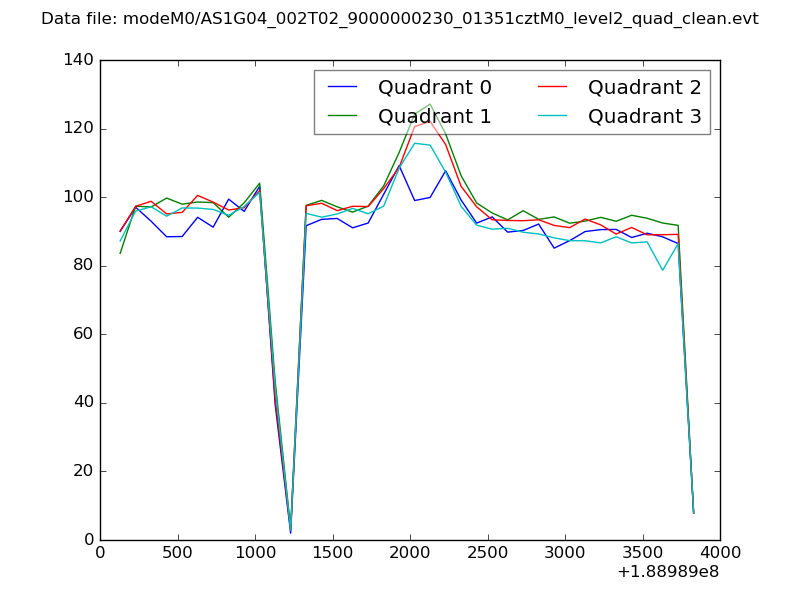
| Quadrant-wise count rates Data is divided into 100 sec bins |
 |
|
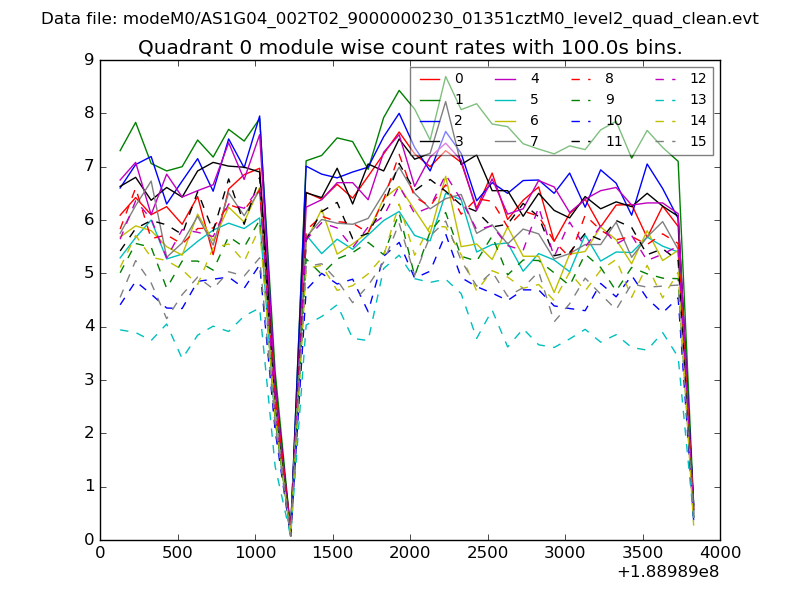
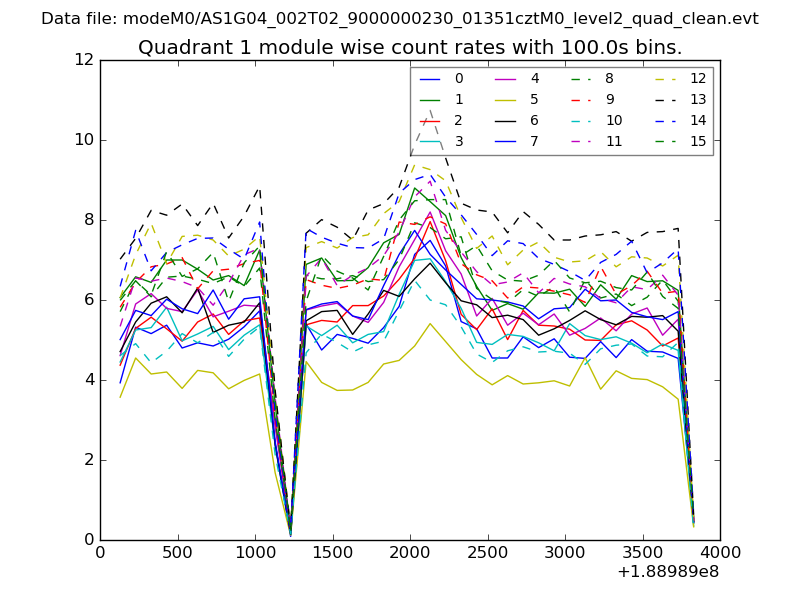
| Module-wise count rates for Quadrant A Data is divided into 100 sec bins |
 |
 |
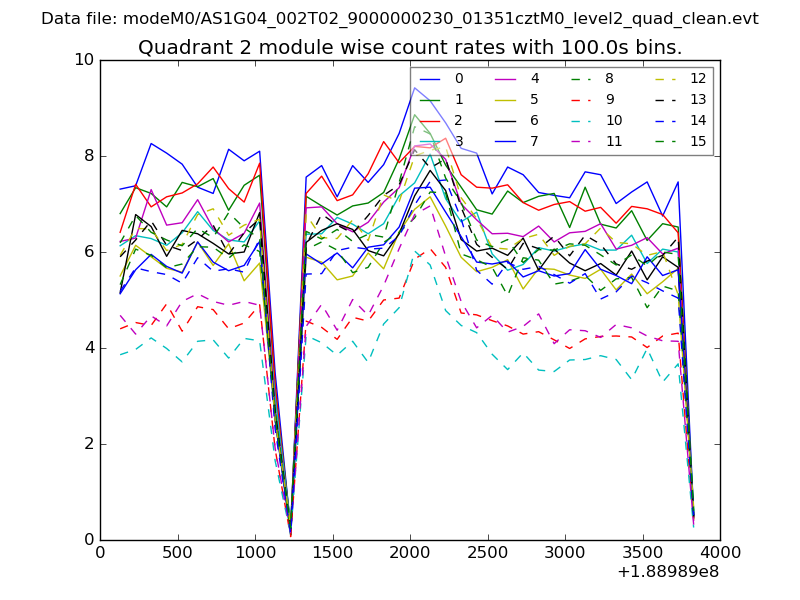
| Module-wise count rates for Quadrant B Data is divided into 100 sec bins |
 |
 |
| Module-wise count rates for Quadrant C Data is divided into 100 sec bins |
 |
 |
| Module-wise count rates for Quadrant D Data is divided into 100 sec bins |
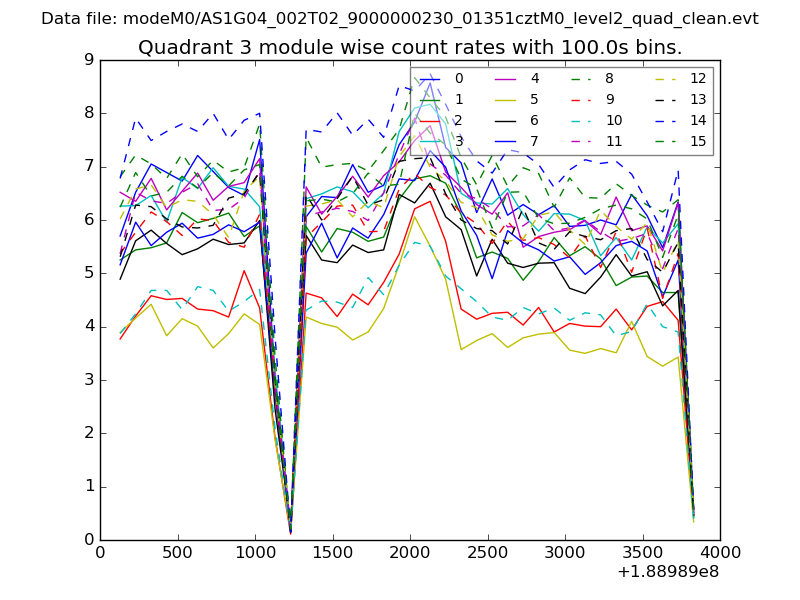 |
 |
| Parameter | Plot |
|---|---|
| CZT HV Monitor | 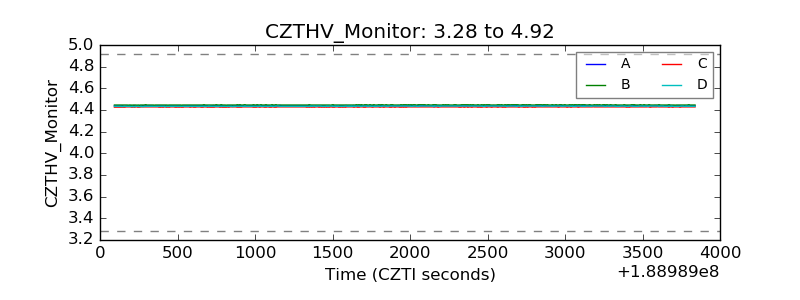 |
| D_VDD | 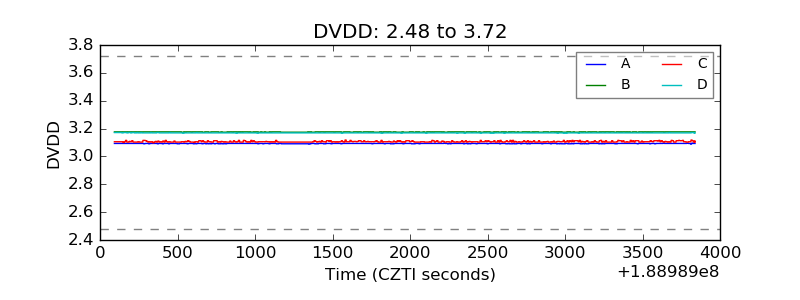 |
| Temperature 1 | 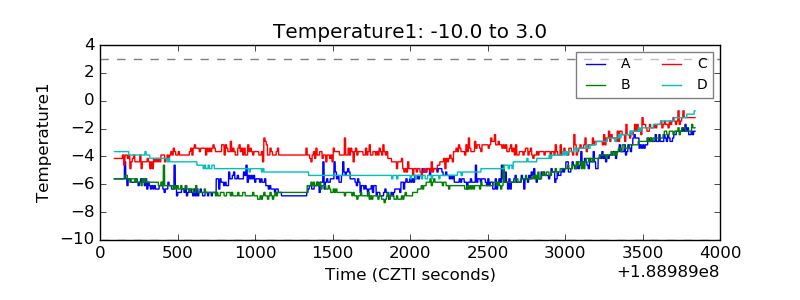 |
| Veto HV Monitor | 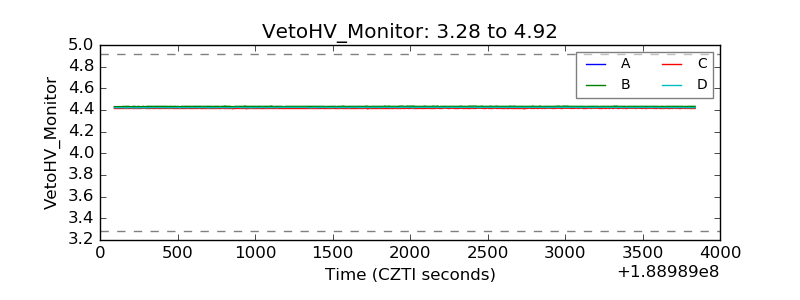 |
| Veto LLD | 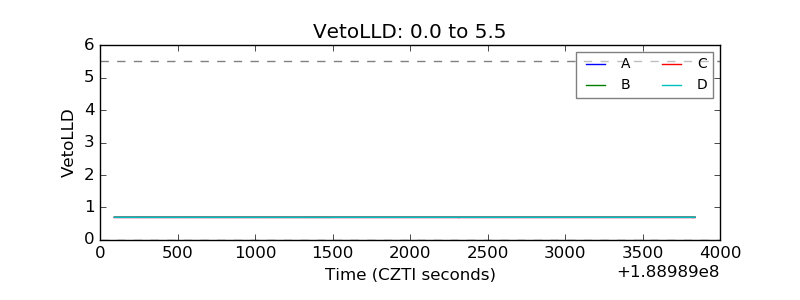 |
| Alpha Counter | 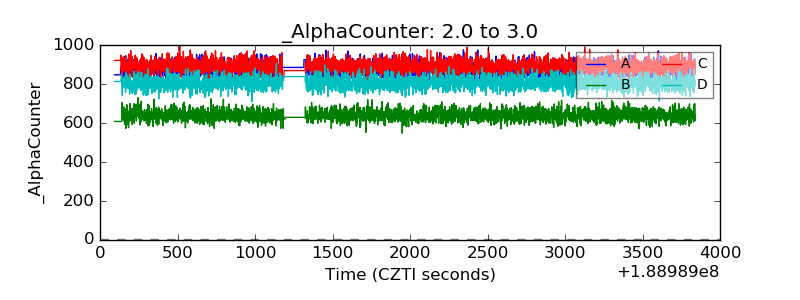 |
| _CPM_Rate | 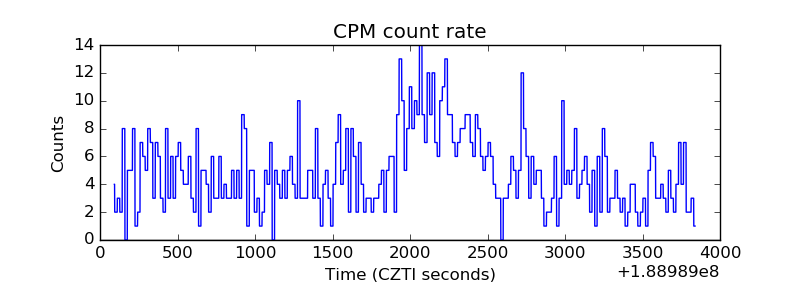 |
| CZT Counter | 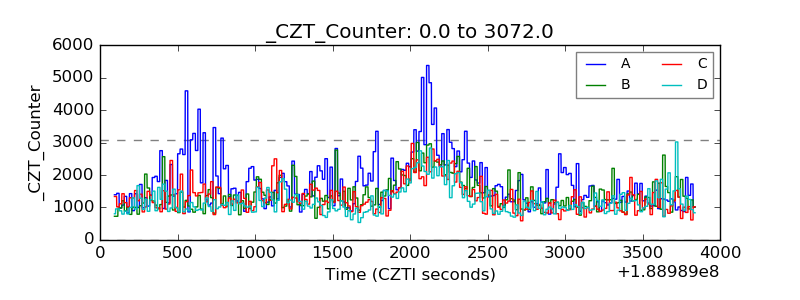 |
| +2.5 Volts monitor |  |
| +5 Volts monitor |  |
| _ROLL_ROT | 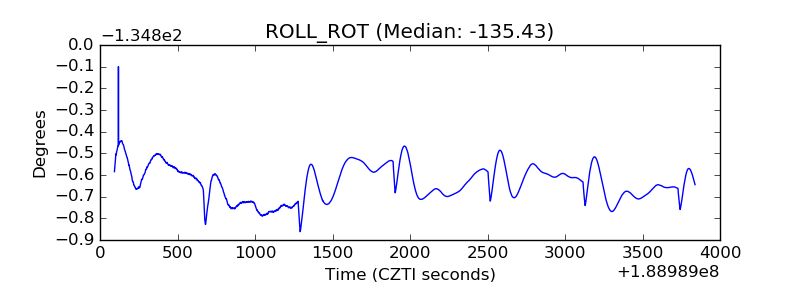 |
| _Roll_DEC | 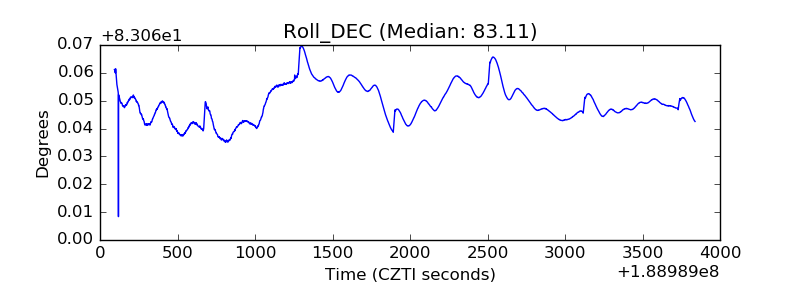 |
| _Roll_RA | 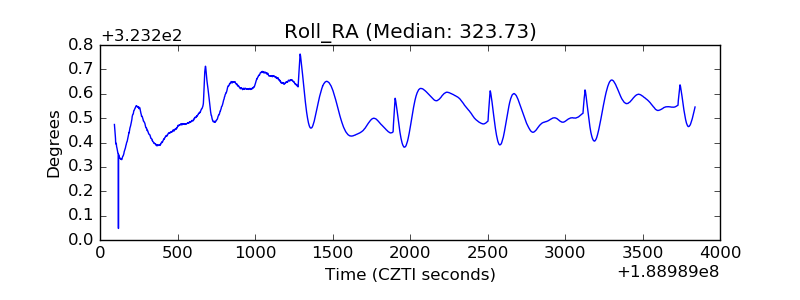 |
| Veto Counter | 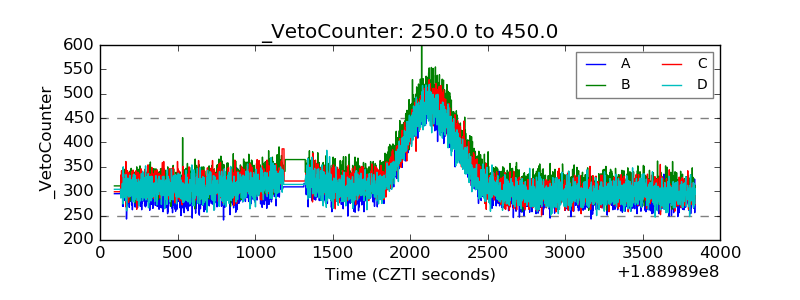 |