| Param | Original file | Final file |
|---|---|---|
| Filename | modeM0/AS1G04_002T02_9000000230_01352cztM0_level2.evt | modeM0/AS1G04_002T02_9000000230_01352cztM0_level2_quad_clean.evt |
| Size (bytes) | 1,270,820,160 | 97,536,960 |
| Size | 1.2 GB | 93.0 MB |
| Events in quadrant A | 11,942,545 | 607,554 |
| Events in quadrant B | 10,018,977 | 637,369 |
| Events in quadrant C | 8,118,772 | 625,462 |
| Events in quadrant D | 7,964,509 | 615,362 |
| Mode M9 | |||
|---|---|---|---|
| Quadrant | BADHDUFLAG | Total packets | Discarded packets |
| A | 0 | 3 | 0 |
| B | 0 | 3 | 0 |
| C | 0 | 3 | 0 |
| D | 0 | 3 | 0 |
| Mode M0 | |||
|---|---|---|---|
| Quadrant | BADHDUFLAG | Total packets | Discarded packets |
| A | 0 | 40319 | 2 |
| B | 0 | 34500 | 1 |
| C | 0 | 28877 | 1 |
| D | 0 | 28467 | 1 |
| Mode SS | |||
|---|---|---|---|
| Quadrant | BADHDUFLAG | Total packets | Discarded packets |
| A | 0 | 138 | 0 |
| B | 0 | 138 | 0 |
| C | 0 | 138 | 0 |
| D | 0 | 138 | 0 |
| Quadrant | Total seconds | Saturated seconds | Saturation percentage |
|---|---|---|---|
| A | 6707 | 855 | 12.747875% |
| B | 6707 | 141 | 2.102281% |
| C | 6707 | 71 | 1.058595% |
| D | 6707 | 127 | 1.893544% |
Noise dominated data is calculated using 1-second bins in cleaned event files. If a bin has >2000 counts, and if more than 50% of those come from <1% of pixels, then it is considered to be noise-dominated and hence unusable.
| Quadrant | # 1 sec bins | Bins with >0 counts | Bins with >2000 counts | High rate bins dominated by noise | Noise dominated (total time) | Noise dominated (detector-on time) | Marked lightcurve |
|---|---|---|---|---|---|---|---|
| A | 6977 | 6707 | 2179 | 2179 | 31.23% | 32.49% | 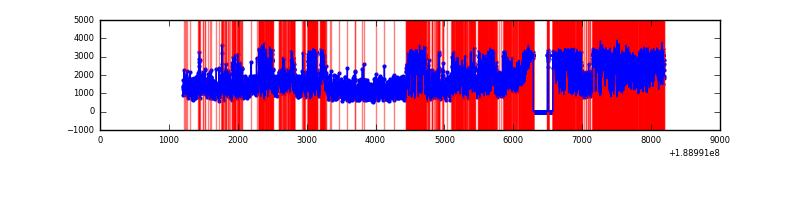 |
| B | 6977 | 6708 | 979 | 979 | 14.03% | 14.59% | 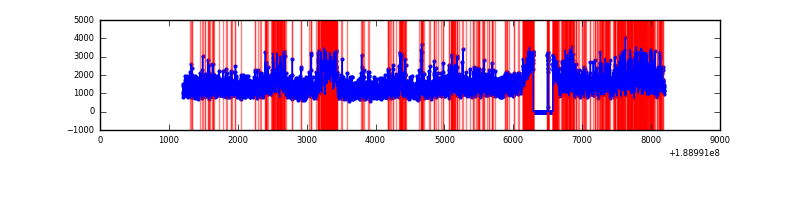 |
| C | 6977 | 6709 | 276 | 276 | 3.96% | 4.11% | 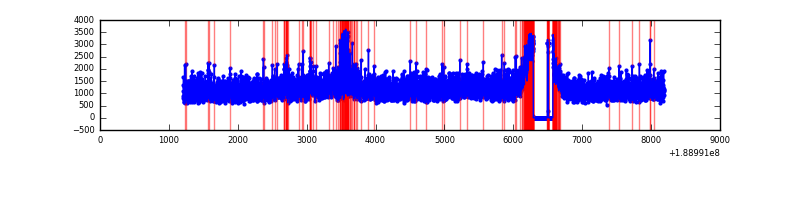 |
| D | 6977 | 6708 | 305 | 305 | 4.37% | 4.55% | 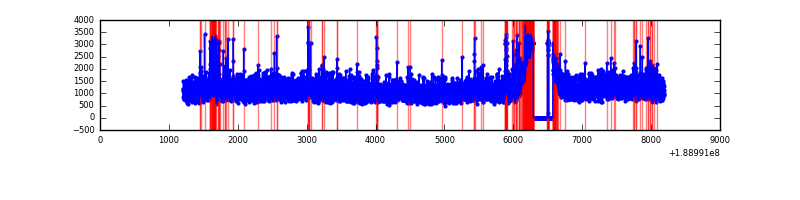 |
Top three noisy pixels from each quadrant. If the there are fewer than three noisy pixels in the level2.evt file, extra rows are filled as -1
| Pixel properties | Quadrant properties | ||||||
|---|---|---|---|---|---|---|---|
| Quadrant | DetID | PixID | Counts | Sigma | Mean | Median | Sigma |
| A | 15 | 127 | 3936469 | 7849.33 | 2052 | 2067 | 501.2 |
| A | 4 | 32 | 113288 | 221.89 | 2052 | 2067 | 501.2 |
| A | 0 | 51 | 12101 | 20.02 | 2052 | 2067 | 501.2 |
| B | 8 | 4 | 1071688 | 2092.79 | 2154 | 2164 | 511.1 |
| B | 12 | 52 | 312681 | 607.6 | 2154 | 2164 | 511.1 |
| B | 10 | 224 | 196130 | 379.54 | 2154 | 2164 | 511.1 |
| C | 8 | 208 | 226055 | 406.87 | 1959 | 2026 | 550.6 |
| C | 15 | 241 | 152628 | 273.51 | 1959 | 2026 | 550.6 |
| C | 3 | 79 | 36937 | 63.4 | 1959 | 2026 | 550.6 |
| D | 13 | 205 | 280974 | 482.26 | 1950 | 1999 | 578.5 |
| D | 1 | 83 | 161672 | 276.03 | 1950 | 1999 | 578.5 |
| D | 10 | 84 | 81987 | 138.27 | 1950 | 1999 | 578.5 |
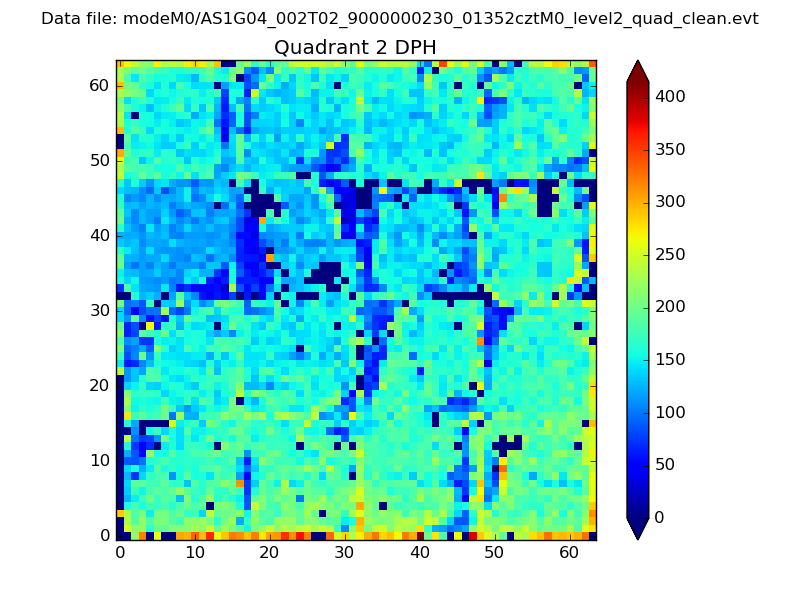
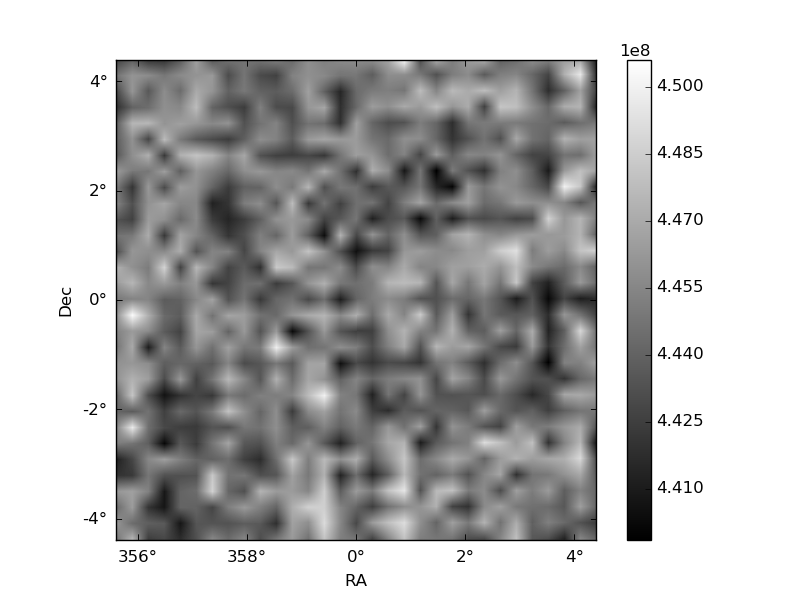
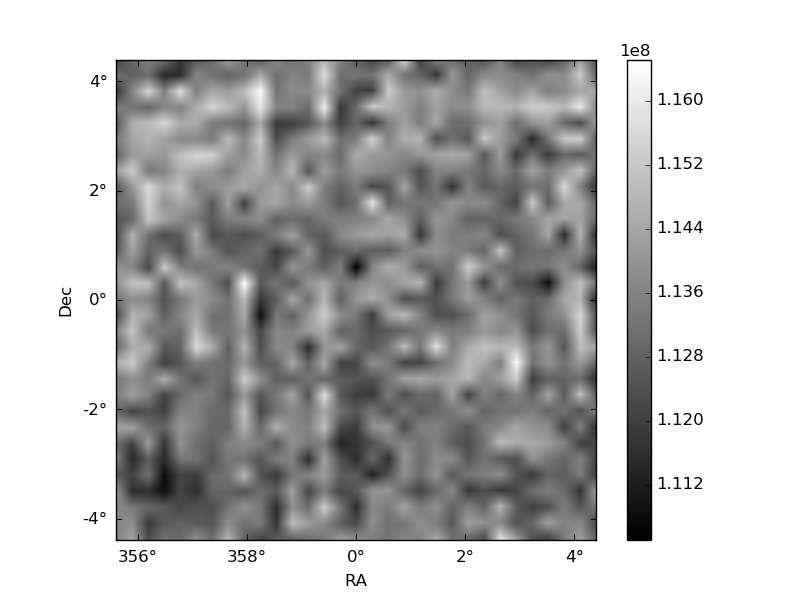
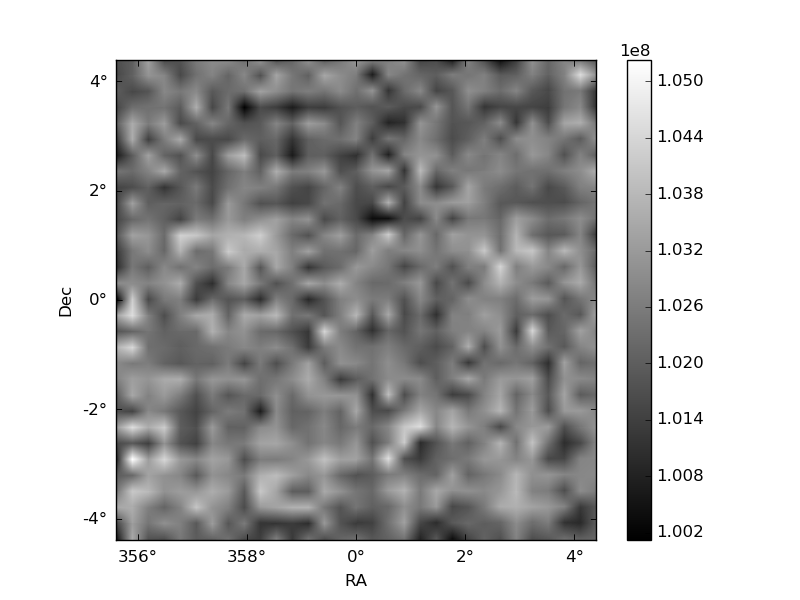
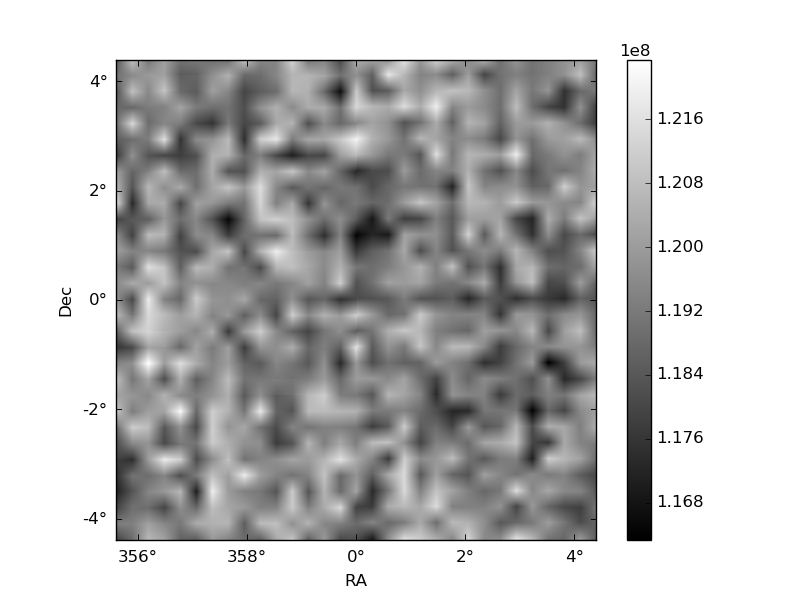
Histogram calculated using DETX and DETY for each event in the final _common_clean file
| Quadrant A | 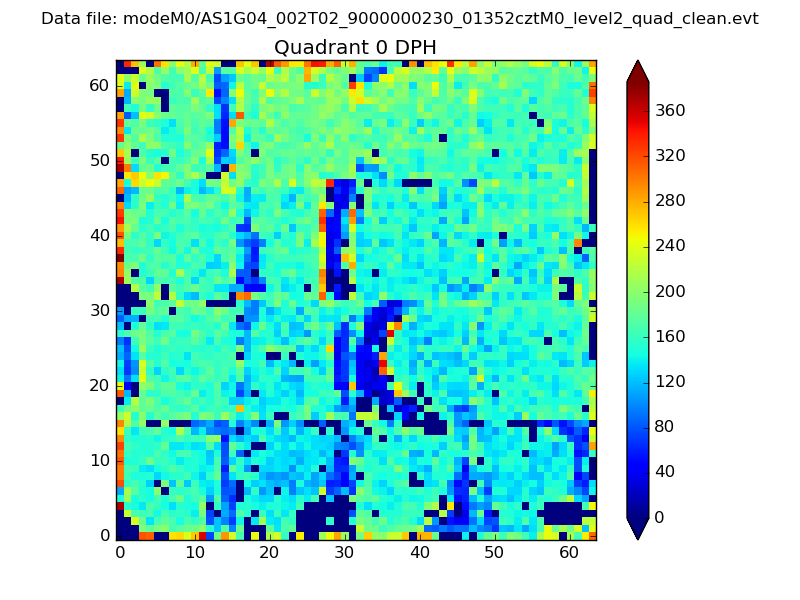 |
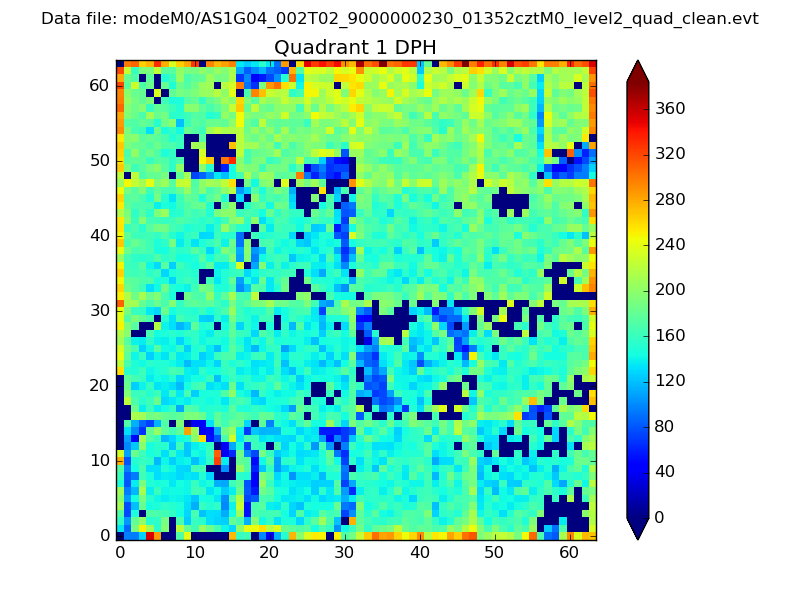 |
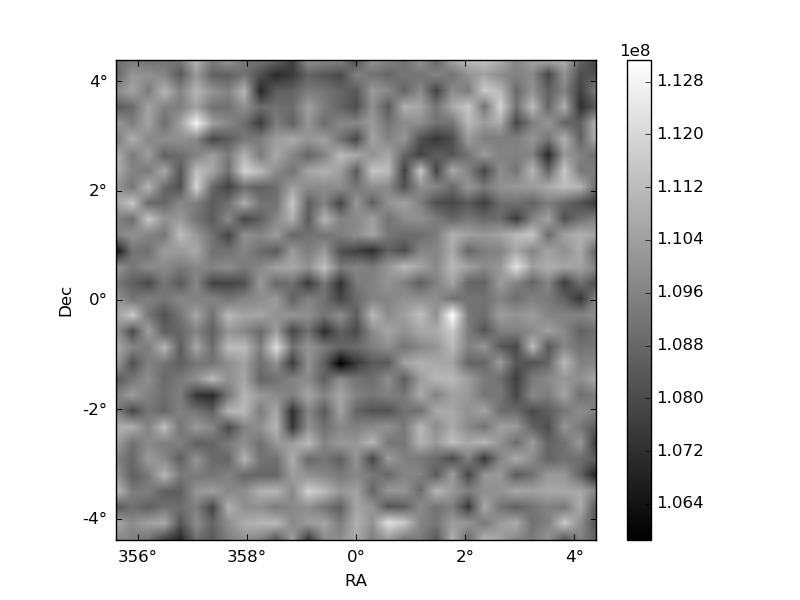
Quadrant B |
|---|---|---|---|
| Quadrant D | 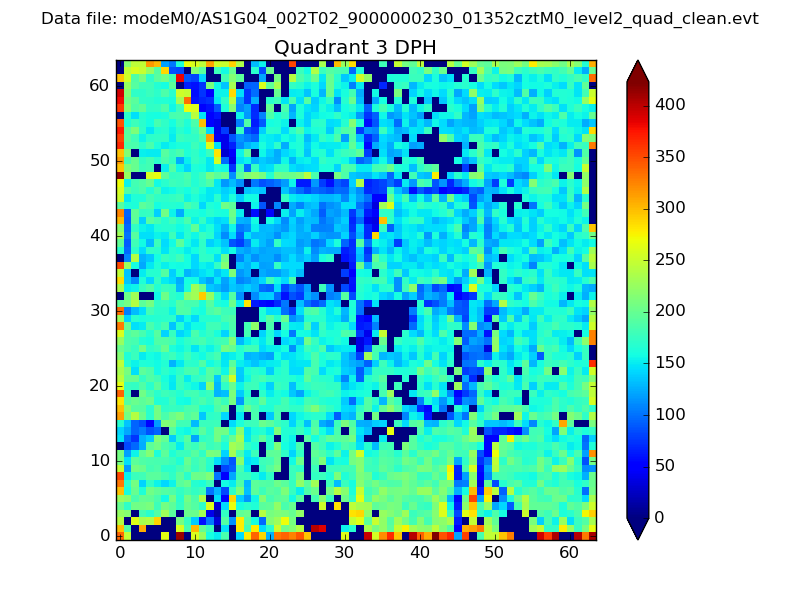 |
 |
Quadrant C |
| Plot type | Count rate plots | Images |
|---|---|---|
| Comparison with Poisson distribution Blue bars denote a histogram of data divided into 1 sec bins. Red curve is a Poisson curve with rate = median count rate of data. |
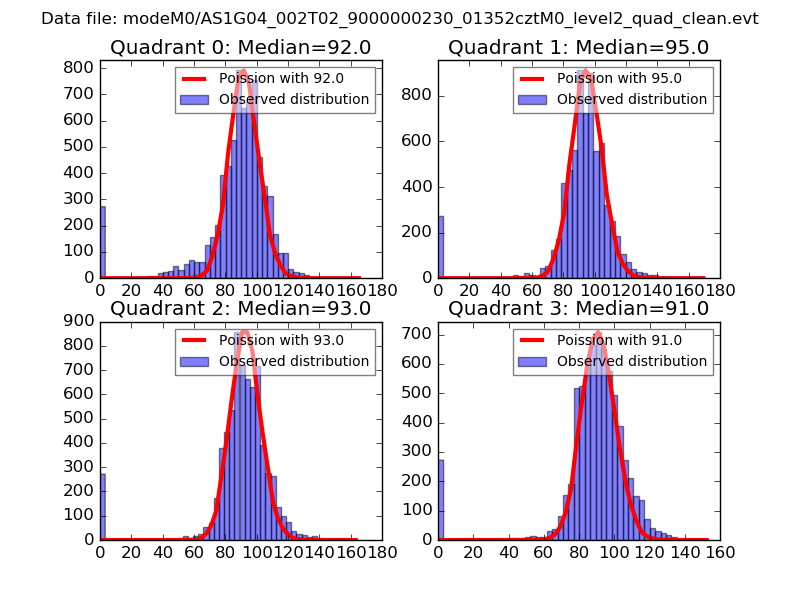 |
 |
| Quadrant-wise count rates Data is divided into 100 sec bins |
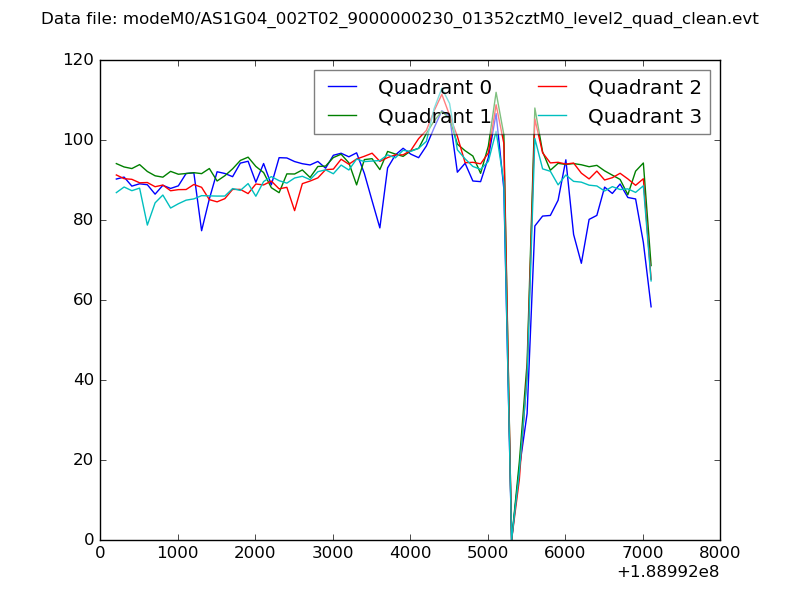 |
|
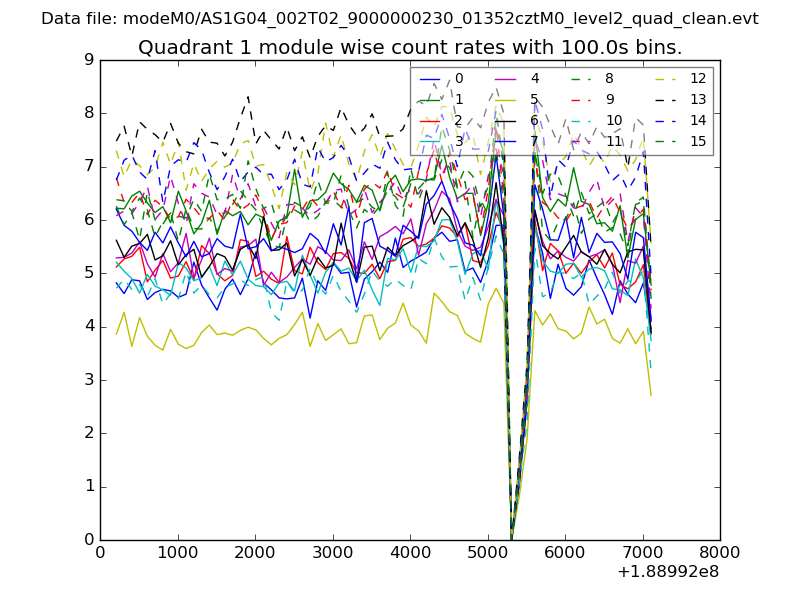
| Module-wise count rates for Quadrant A Data is divided into 100 sec bins |
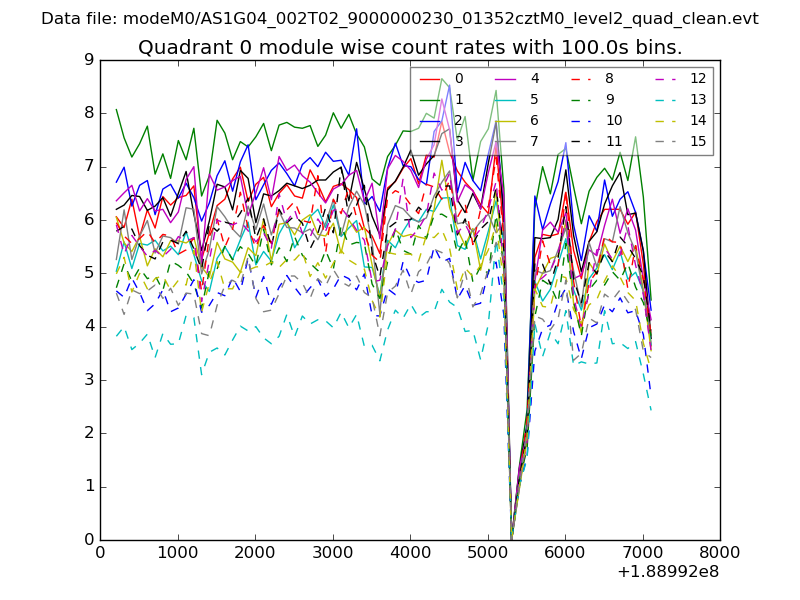 |
 |
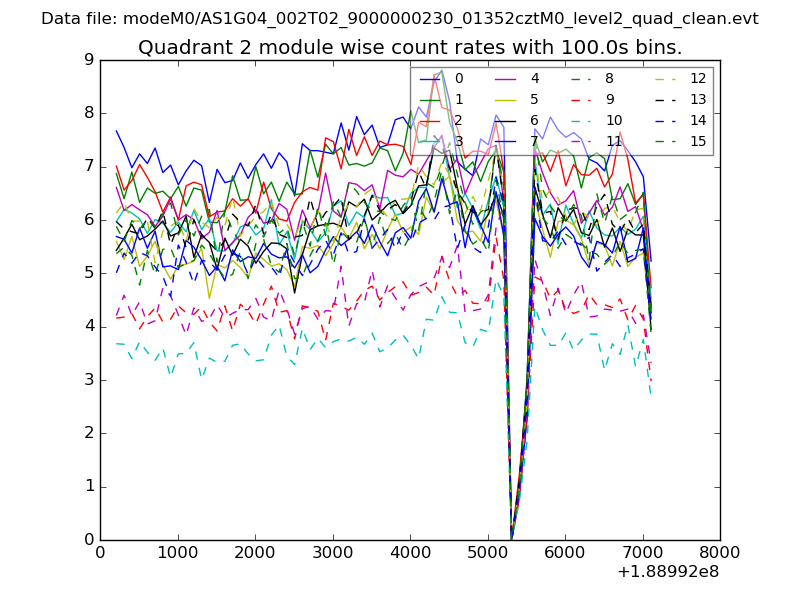
| Module-wise count rates for Quadrant B Data is divided into 100 sec bins |
 |
 |
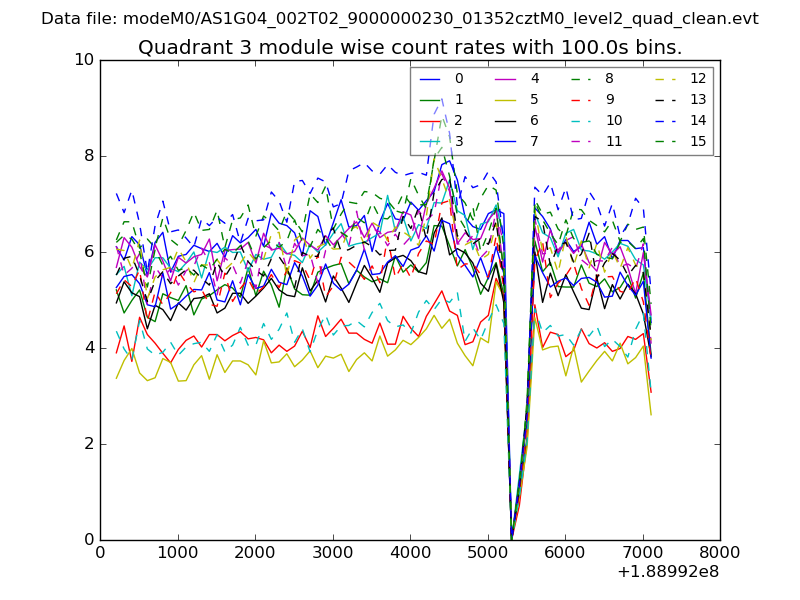
| Module-wise count rates for Quadrant C Data is divided into 100 sec bins |
 |
 |
| Module-wise count rates for Quadrant D Data is divided into 100 sec bins |
 |
 |
| Parameter | Plot |
|---|---|
| CZT HV Monitor | 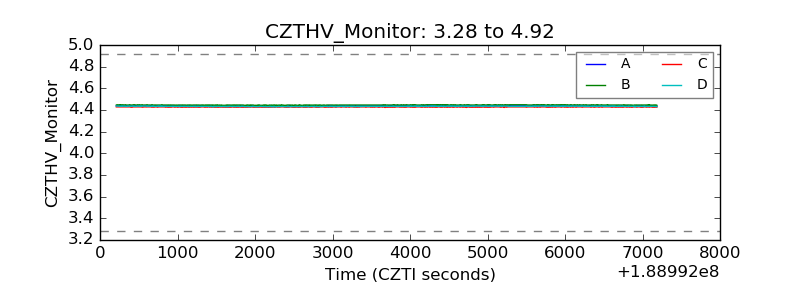 |
| D_VDD | 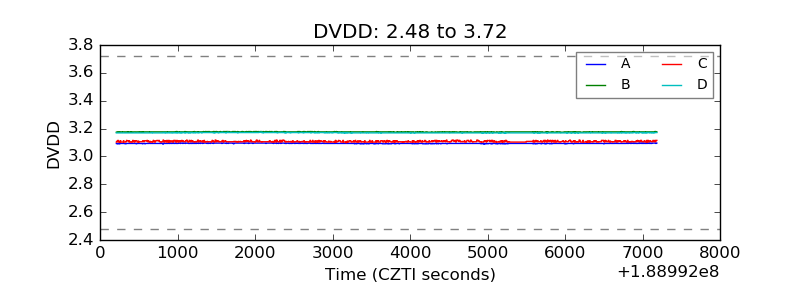 |
| Temperature 1 | 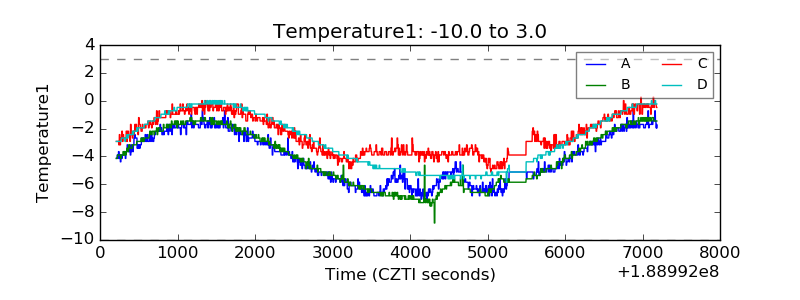 |
| Veto HV Monitor | 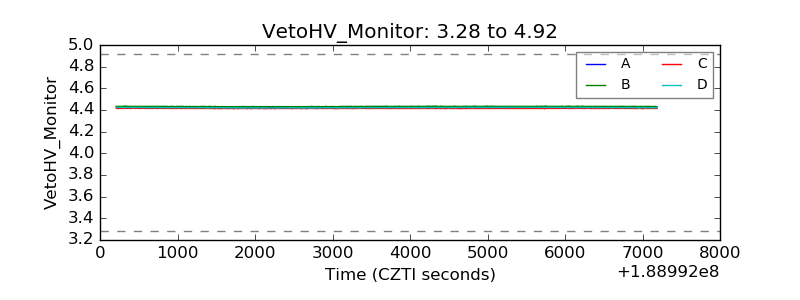 |
| Veto LLD | 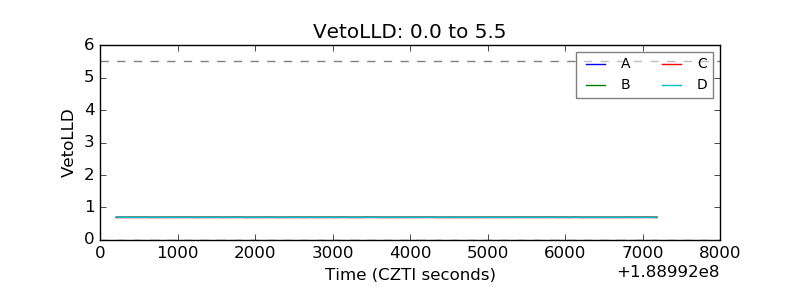 |
| Alpha Counter | 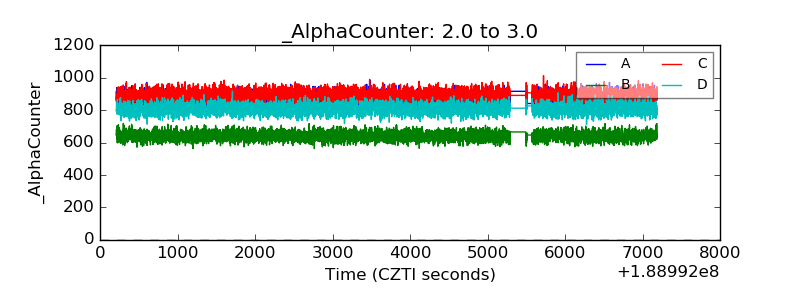 |
| _CPM_Rate | 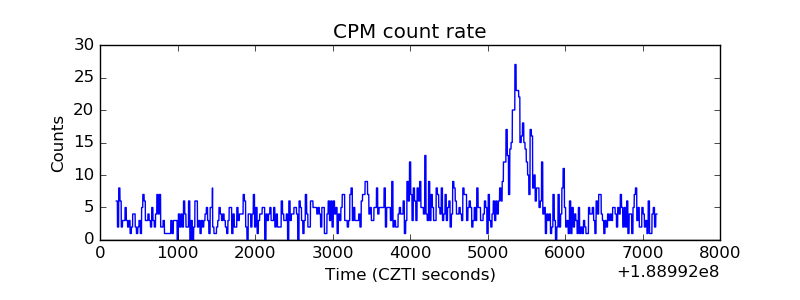 |
| CZT Counter | 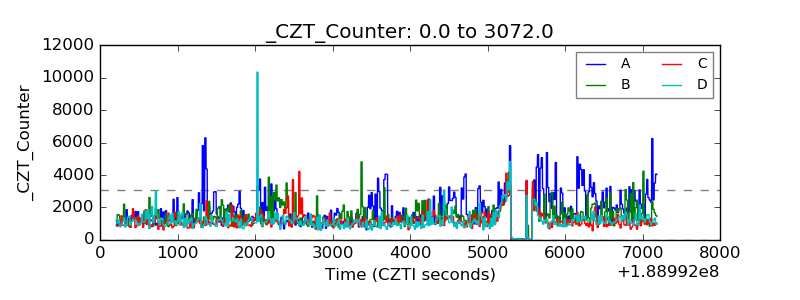 |
| +2.5 Volts monitor | 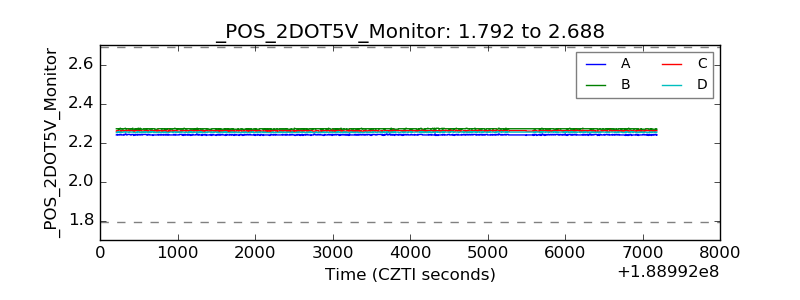 |
| +5 Volts monitor | 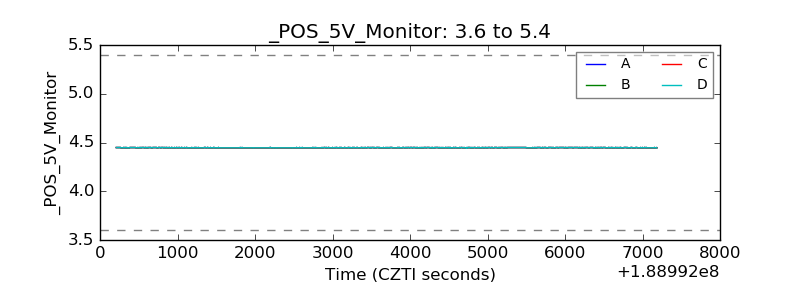 |
| _ROLL_ROT | 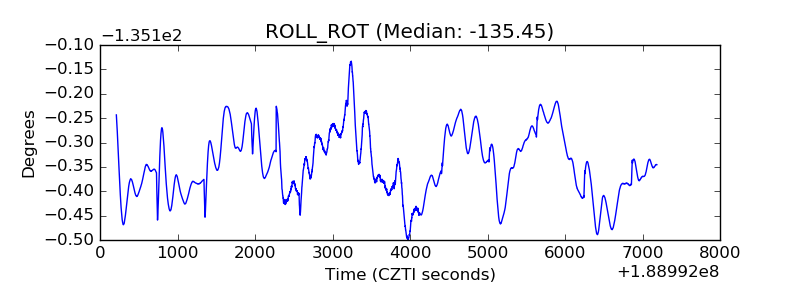 |
| _Roll_DEC | 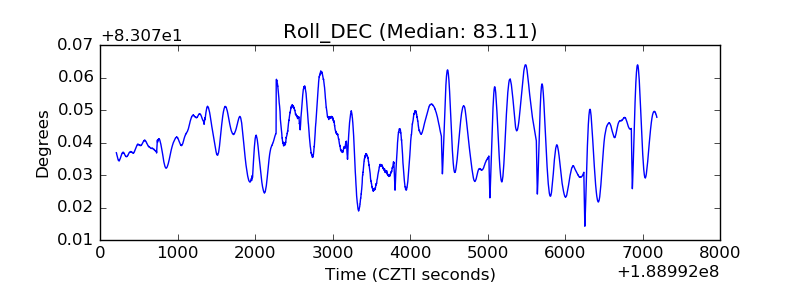 |
| _Roll_RA | 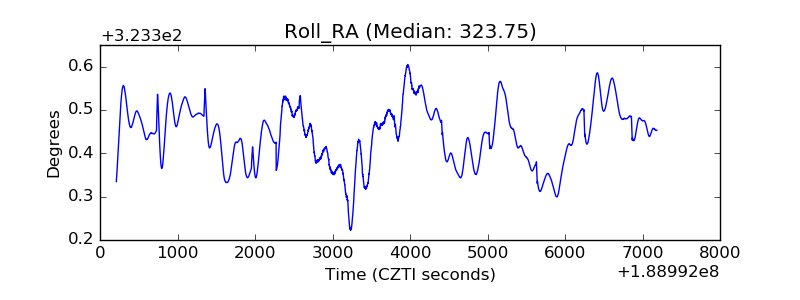 |
| Veto Counter | 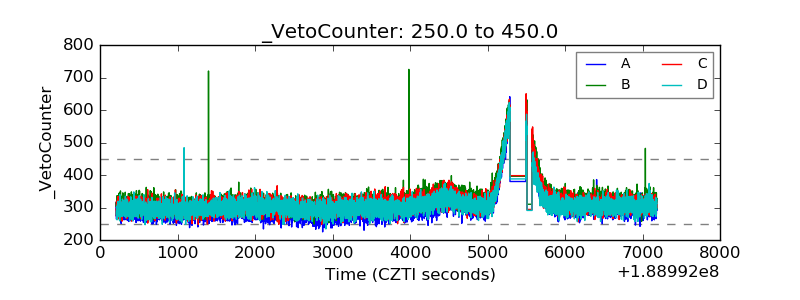 |