| Param | Original file | Final file |
|---|---|---|
| Filename | modeM0/AS1G04_002T02_9000000230_01353cztM0_level2.evt | modeM0/AS1G04_002T02_9000000230_01353cztM0_level2_quad_clean.evt |
| Size (bytes) | 1,272,611,520 | 96,770,880 |
| Size | 1.2 GB | 92.3 MB |
| Events in quadrant A | 12,569,997 | 598,072 |
| Events in quadrant B | 10,066,160 | 634,184 |
| Events in quadrant C | 7,955,728 | 620,496 |
| Events in quadrant D | 7,509,842 | 612,659 |
| Mode M9 | |||
|---|---|---|---|
| Quadrant | BADHDUFLAG | Total packets | Discarded packets |
| A | 0 | 5 | 0 |
| B | 0 | 5 | 0 |
| C | 0 | 5 | 0 |
| D | 0 | 5 | 0 |
| Mode M0 | |||
|---|---|---|---|
| Quadrant | BADHDUFLAG | Total packets | Discarded packets |
| A | 0 | 42142 | 2 |
| B | 0 | 34558 | 1 |
| C | 0 | 28371 | 1 |
| D | 0 | 27054 | 1 |
| Mode SS | |||
|---|---|---|---|
| Quadrant | BADHDUFLAG | Total packets | Discarded packets |
| A | 0 | 136 | 0 |
| B | 0 | 136 | 0 |
| C | 0 | 136 | 0 |
| D | 0 | 136 | 0 |
| Quadrant | Total seconds | Saturated seconds | Saturation percentage |
|---|---|---|---|
| A | 6665 | 938 | 14.073518% |
| B | 6665 | 130 | 1.950488% |
| C | 6665 | 41 | 0.615154% |
| D | 6665 | 51 | 0.765191% |
Noise dominated data is calculated using 1-second bins in cleaned event files. If a bin has >2000 counts, and if more than 50% of those come from <1% of pixels, then it is considered to be noise-dominated and hence unusable.
| Quadrant | # 1 sec bins | Bins with >0 counts | Bins with >2000 counts | High rate bins dominated by noise | Noise dominated (total time) | Noise dominated (detector-on time) | Marked lightcurve |
|---|---|---|---|---|---|---|---|
| A | 7195 | 6665 | 2473 | 2473 | 34.37% | 37.10% | 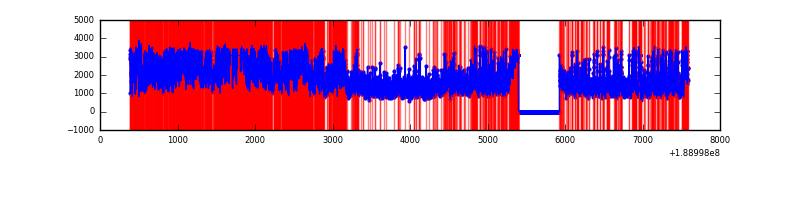 |
| B | 7195 | 6666 | 960 | 960 | 13.34% | 14.40% | 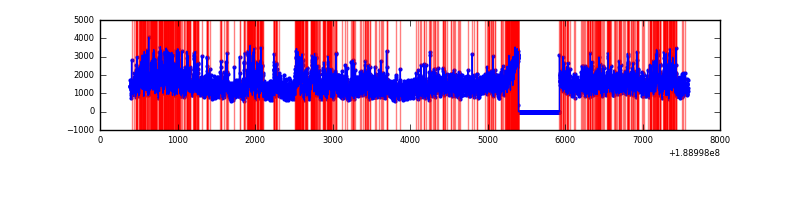 |
| C | 7195 | 6665 | 173 | 173 | 2.40% | 2.60% | 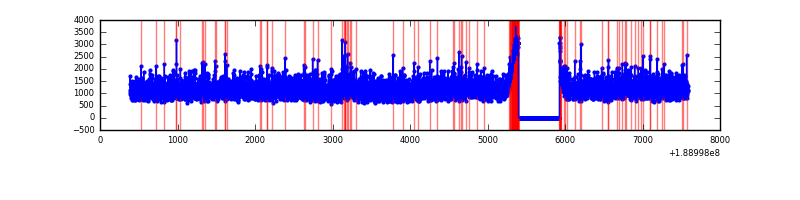 |
| D | 7195 | 6665 | 172 | 172 | 2.39% | 2.58% | 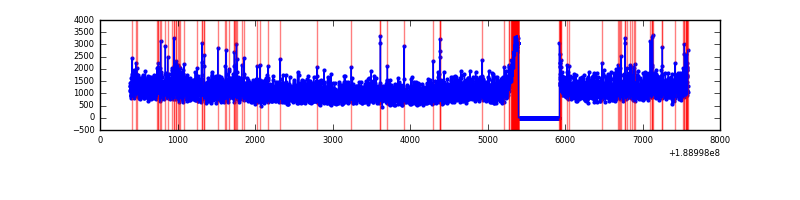 |
Top three noisy pixels from each quadrant. If the there are fewer than three noisy pixels in the level2.evt file, extra rows are filled as -1
| Pixel properties | Quadrant properties | ||||||
|---|---|---|---|---|---|---|---|
| Quadrant | DetID | PixID | Counts | Sigma | Mean | Median | Sigma |
| A | 15 | 127 | 4635702 | 9539.12 | 2001 | 2009 | 485.8 |
| A | 4 | 32 | 207296 | 422.61 | 2001 | 2009 | 485.8 |
| A | 12 | 133 | 23538 | 44.32 | 2001 | 2009 | 485.8 |
| B | 8 | 4 | 1349676 | 2675.63 | 2123 | 2133 | 503.6 |
| B | 12 | 52 | 262236 | 516.45 | 2123 | 2133 | 503.6 |
| B | 4 | 200 | 141134 | 276.0 | 2123 | 2133 | 503.6 |
| C | 15 | 241 | 192158 | 348.51 | 1953 | 2022 | 545.6 |
| C | 3 | 79 | 44063 | 77.06 | 1953 | 2022 | 545.6 |
| C | 3 | 111 | 32545 | 55.95 | 1953 | 2022 | 545.6 |
| D | 13 | 205 | 128579 | 214.1 | 1898 | 1968 | 591.4 |
| D | 10 | 84 | 70153 | 115.3 | 1898 | 1968 | 591.4 |
| D | 10 | 125 | 52730 | 85.84 | 1898 | 1968 | 591.4 |
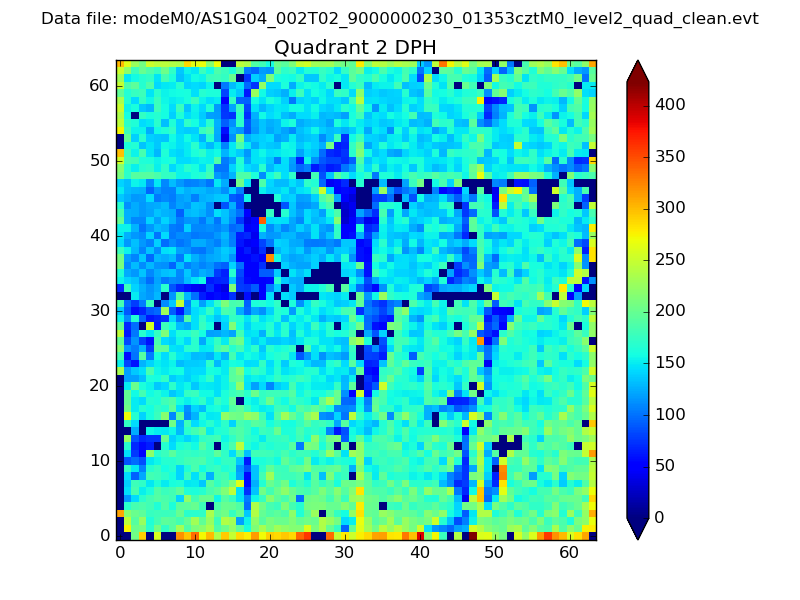
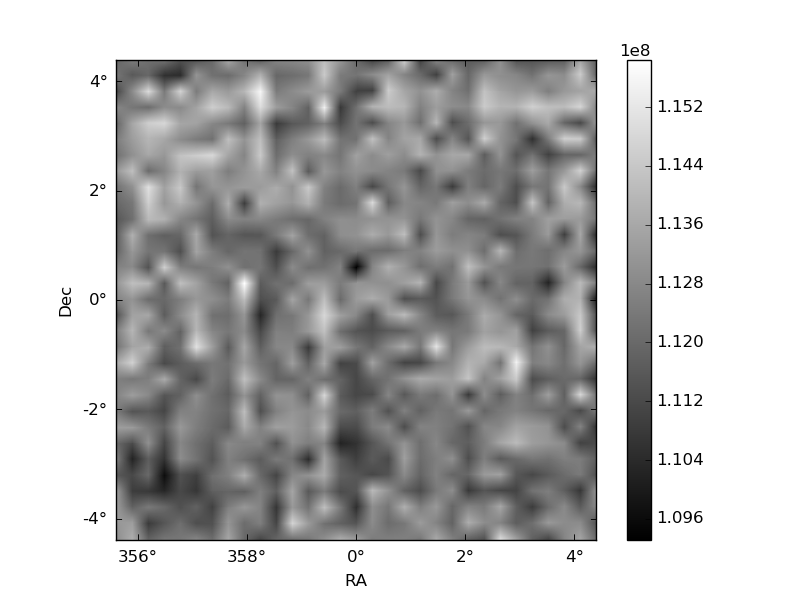
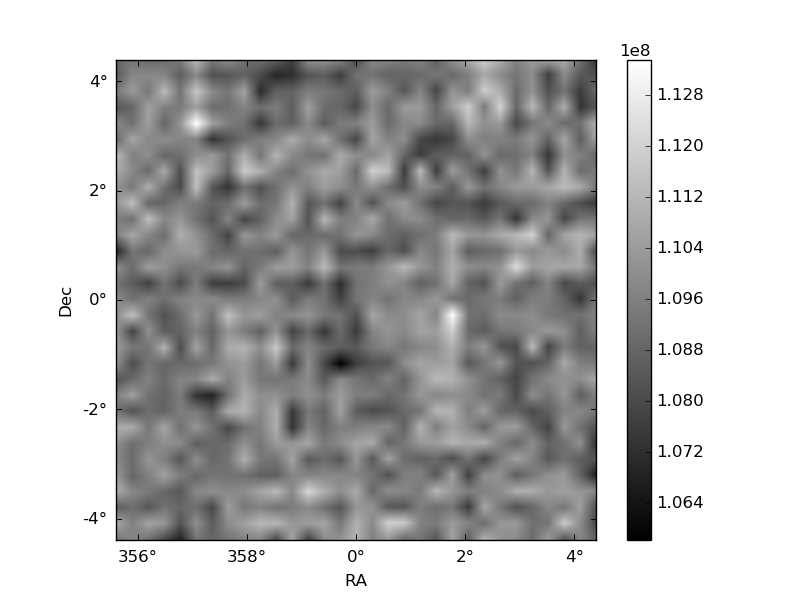
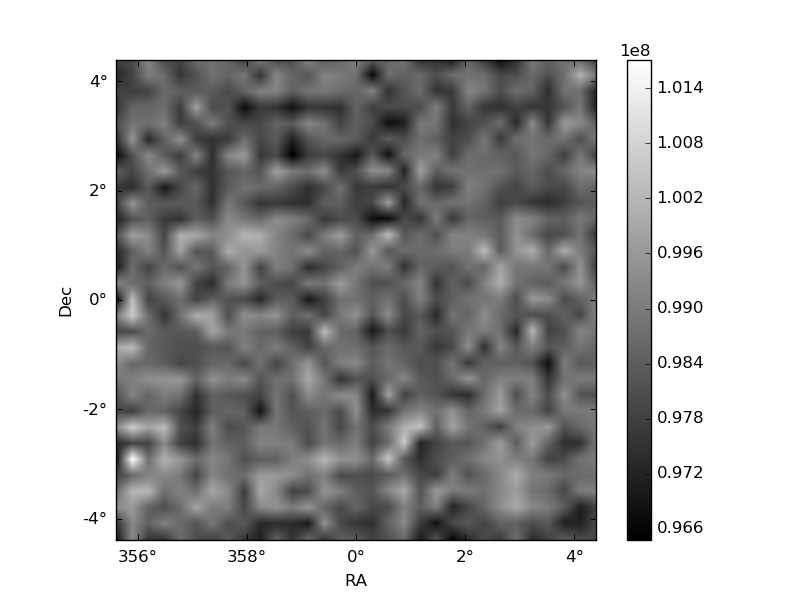
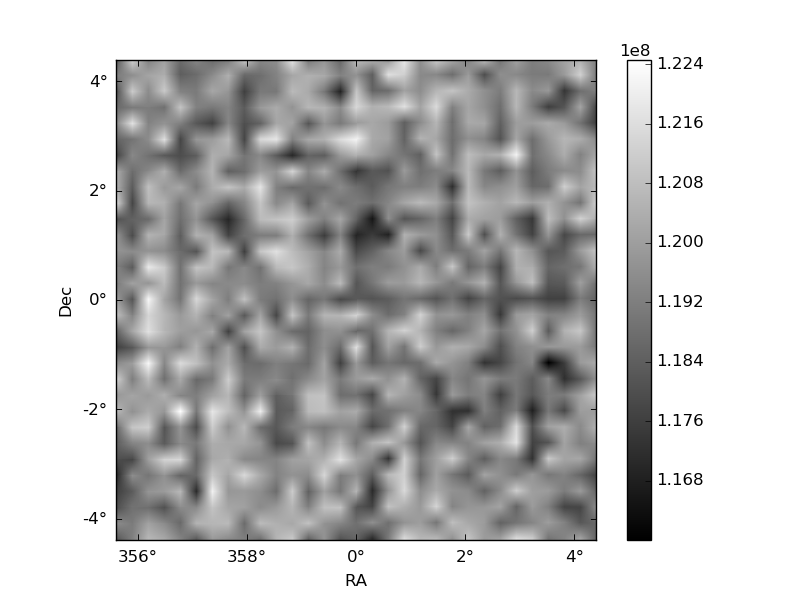
Histogram calculated using DETX and DETY for each event in the final _common_clean file
| Quadrant A | 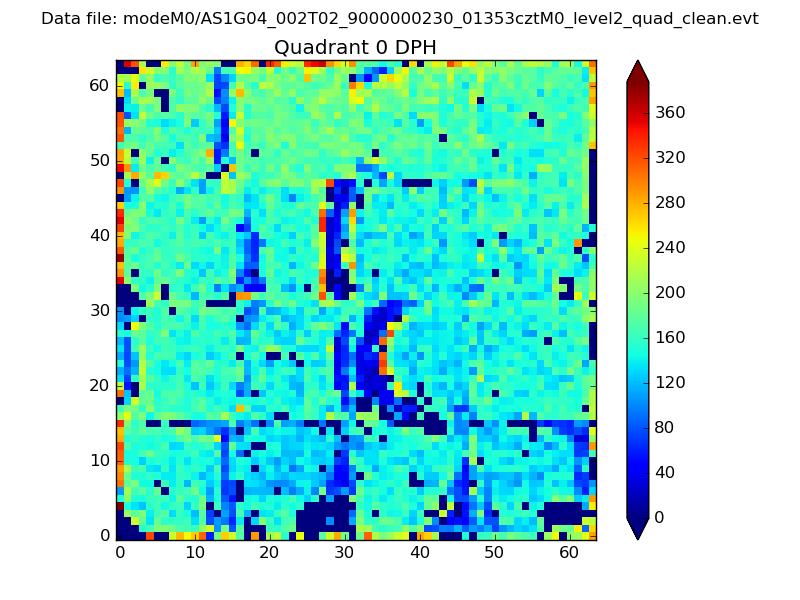 |
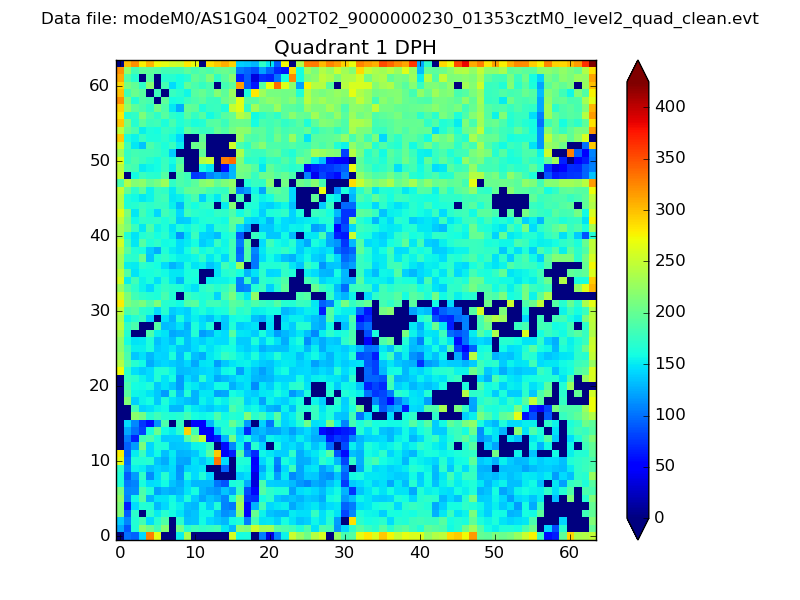 |
Quadrant B |
|---|---|---|---|
| Quadrant D | 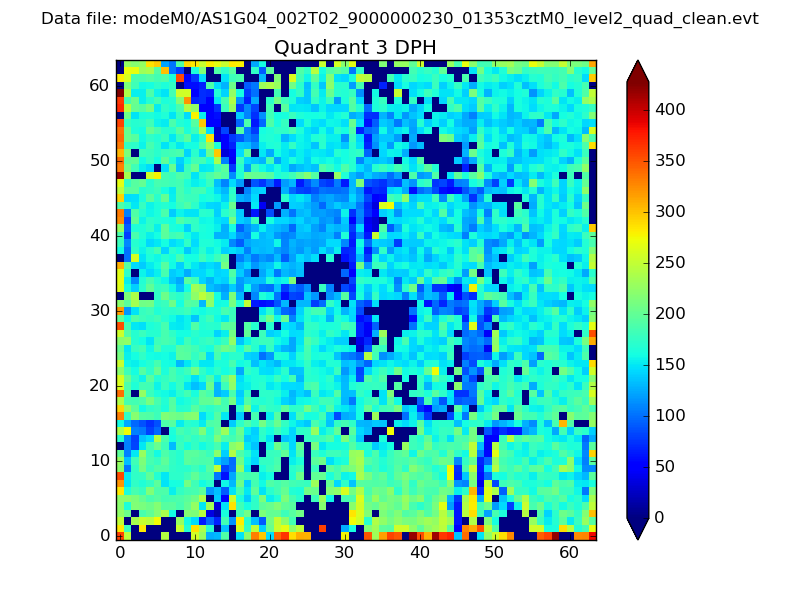 |
 |
Quadrant C |
| Plot type | Count rate plots | Images |
|---|---|---|
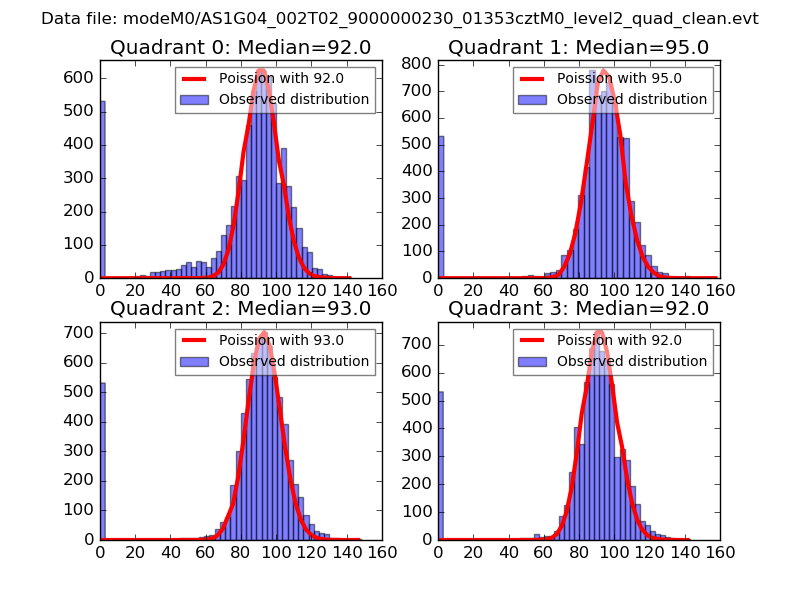
| Comparison with Poisson distribution Blue bars denote a histogram of data divided into 1 sec bins. Red curve is a Poisson curve with rate = median count rate of data. |
 |
 |
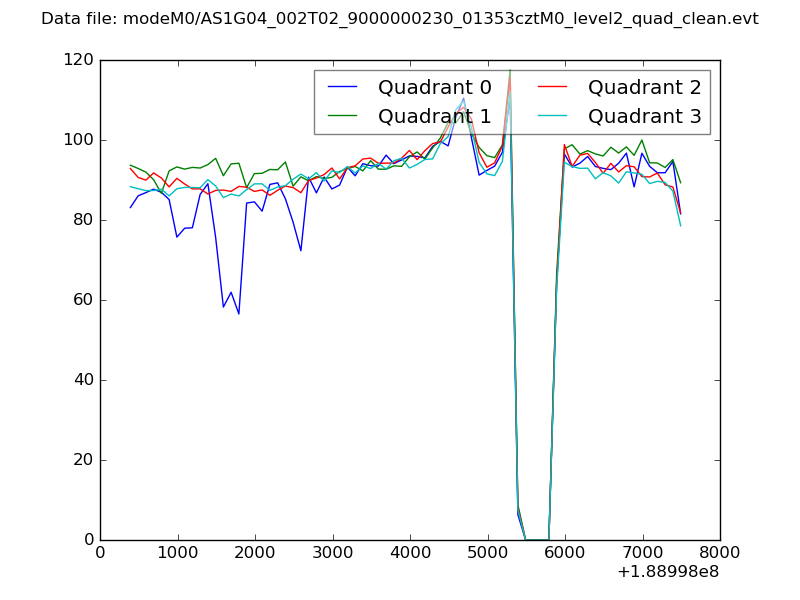
| Quadrant-wise count rates Data is divided into 100 sec bins |
 |
|
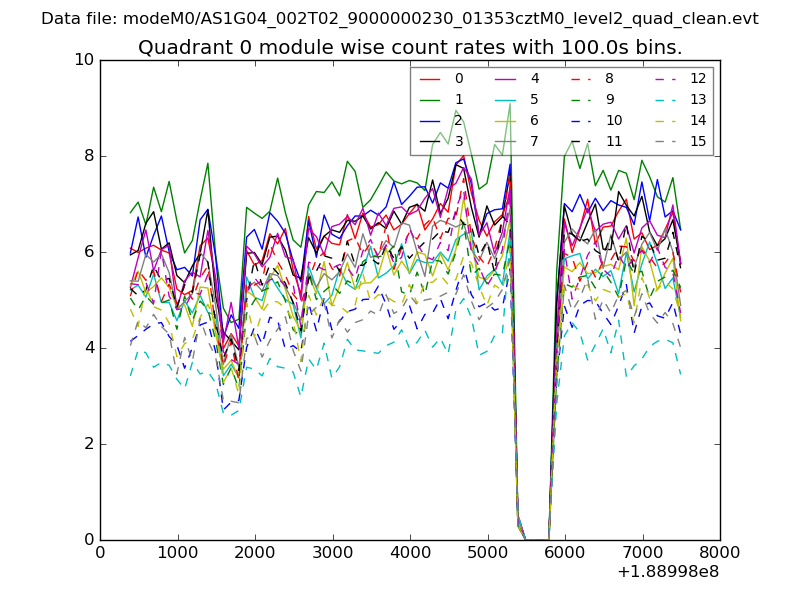
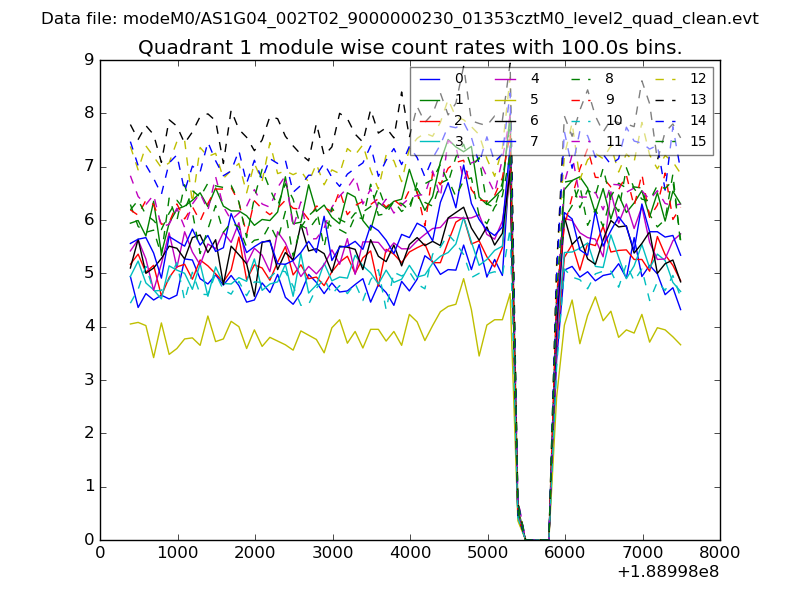
| Module-wise count rates for Quadrant A Data is divided into 100 sec bins |
 |
 |
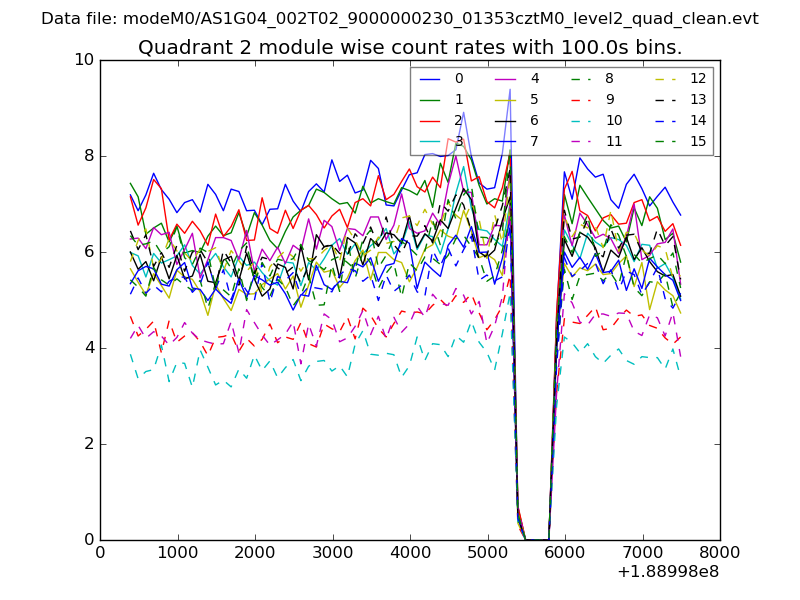
| Module-wise count rates for Quadrant B Data is divided into 100 sec bins |
 |
 |
| Module-wise count rates for Quadrant C Data is divided into 100 sec bins |
 |
 |
| Module-wise count rates for Quadrant D Data is divided into 100 sec bins |
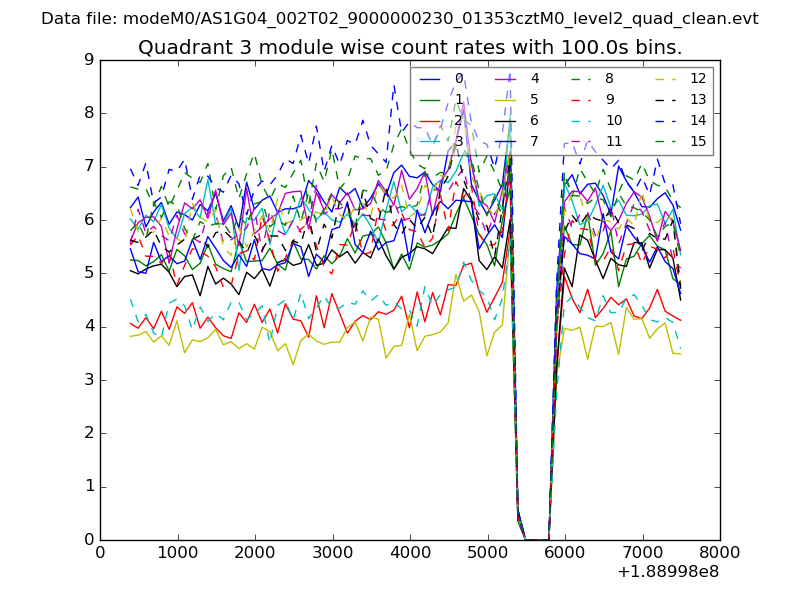 |
 |
| Parameter | Plot |
|---|---|
| CZT HV Monitor | 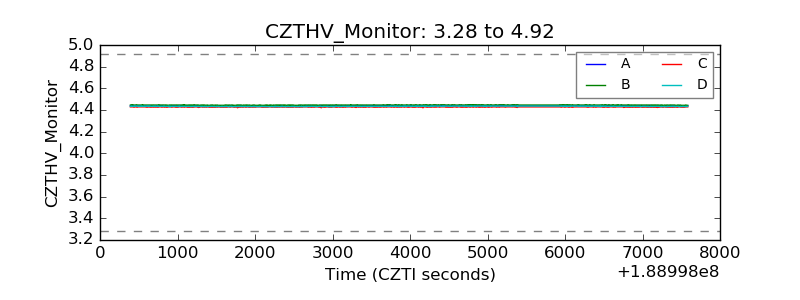 |
| D_VDD |  |
| Temperature 1 | 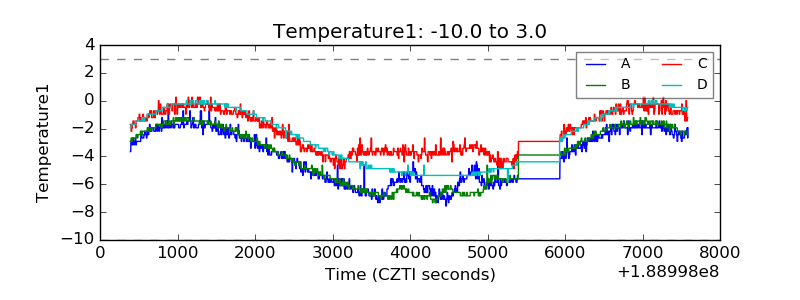 |
| Veto HV Monitor | 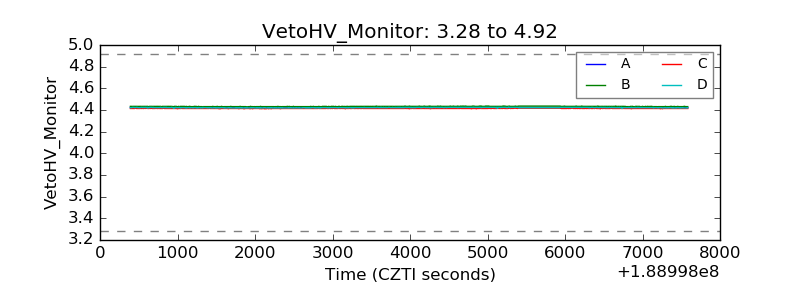 |
| Veto LLD | 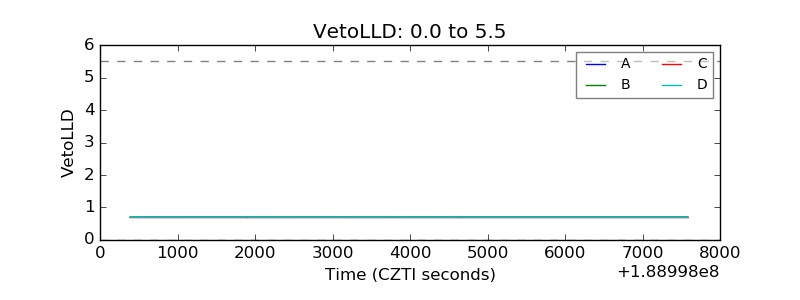 |
| Alpha Counter | 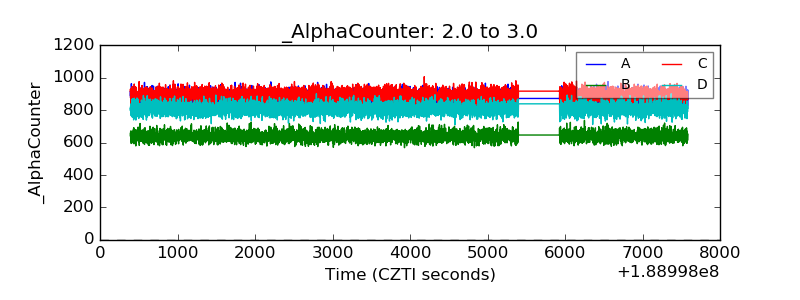 |
| _CPM_Rate | 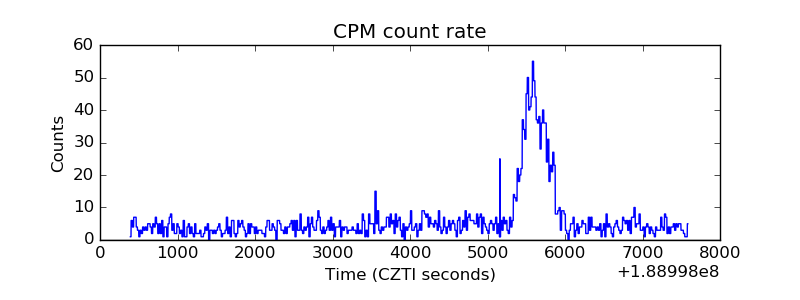 |
| CZT Counter | 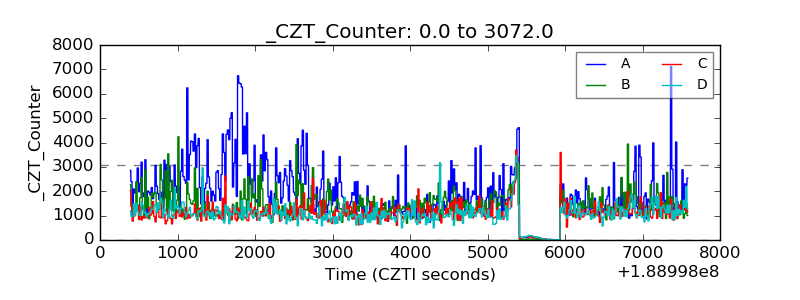 |
| +2.5 Volts monitor |  |
| +5 Volts monitor |  |
| _ROLL_ROT | 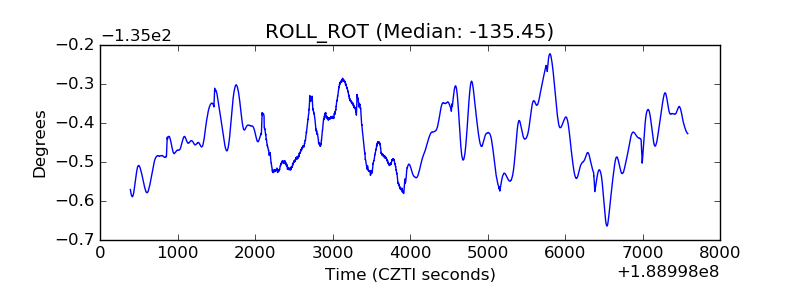 |
| _Roll_DEC | 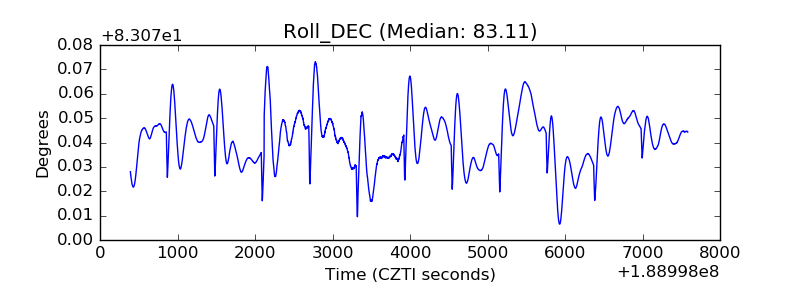 |
| _Roll_RA |  |
| Veto Counter | 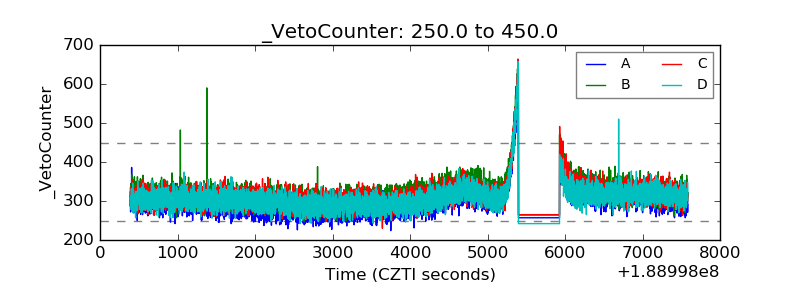 |