| Param | Original file | Final file |
|---|---|---|
| Filename | modeM0/AS1G04_002T02_9000000230_01354cztM0_level2.evt | modeM0/AS1G04_002T02_9000000230_01354cztM0_level2_quad_clean.evt |
| Size (bytes) | 1,209,303,360 | 93,360,960 |
| Size | 1.1 GB | 89.0 MB |
| Events in quadrant A | 10,075,373 | 608,216 |
| Events in quadrant B | 9,373,518 | 616,443 |
| Events in quadrant C | 7,628,321 | 602,413 |
| Events in quadrant D | 9,121,924 | 550,657 |
| Mode M9 | |||
|---|---|---|---|
| Quadrant | BADHDUFLAG | Total packets | Discarded packets |
| A | 0 | 7 | 0 |
| B | 0 | 7 | 0 |
| C | 0 | 7 | 0 |
| D | 0 | 7 | 0 |
| Mode M0 | |||
|---|---|---|---|
| Quadrant | BADHDUFLAG | Total packets | Discarded packets |
| A | 0 | 34495 | 2 |
| B | 0 | 32376 | 1 |
| C | 0 | 27229 | 1 |
| D | 0 | 31839 | 1 |
| Mode SS | |||
|---|---|---|---|
| Quadrant | BADHDUFLAG | Total packets | Discarded packets |
| A | 0 | 130 | 0 |
| B | 0 | 130 | 0 |
| C | 0 | 130 | 0 |
| D | 0 | 130 | 0 |
| Quadrant | Total seconds | Saturated seconds | Saturation percentage |
|---|---|---|---|
| A | 6440 | 243 | 3.773292% |
| B | 6440 | 66 | 1.024845% |
| C | 6440 | 44 | 0.683230% |
| D | 6440 | 907 | 14.083851% |
Noise dominated data is calculated using 1-second bins in cleaned event files. If a bin has >2000 counts, and if more than 50% of those come from <1% of pixels, then it is considered to be noise-dominated and hence unusable.
| Quadrant | # 1 sec bins | Bins with >0 counts | Bins with >2000 counts | High rate bins dominated by noise | Noise dominated (total time) | Noise dominated (detector-on time) | Marked lightcurve |
|---|---|---|---|---|---|---|---|
| A | 7130 | 6440 | 1157 | 1157 | 16.23% | 17.97% | 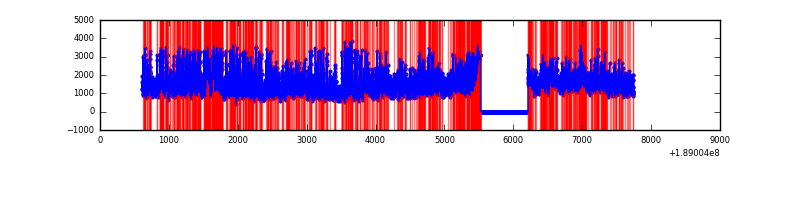 |
| B | 7130 | 6440 | 734 | 734 | 10.29% | 11.40% | 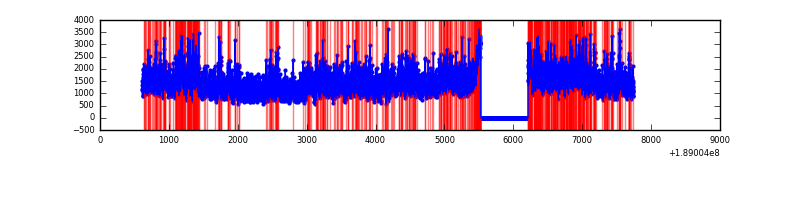 |
| C | 7130 | 6440 | 152 | 152 | 2.13% | 2.36% | 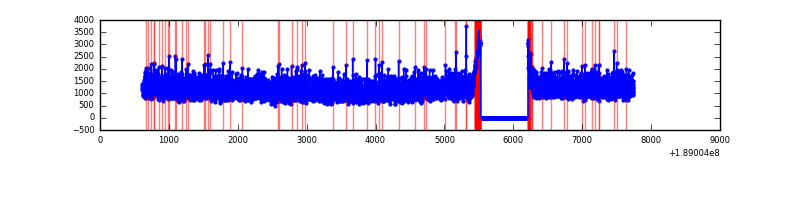 |
| D | 7130 | 6440 | 1192 | 1192 | 16.72% | 18.51% | 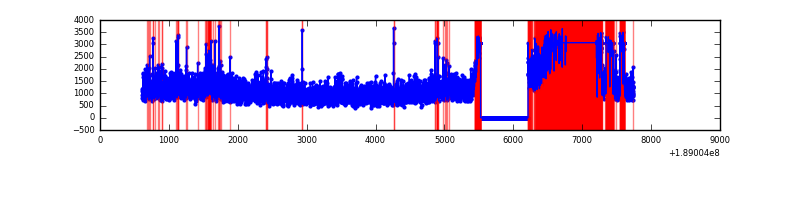 |
Top three noisy pixels from each quadrant. If the there are fewer than three noisy pixels in the level2.evt file, extra rows are filled as -1
| Pixel properties | Quadrant properties | ||||||
|---|---|---|---|---|---|---|---|
| Quadrant | DetID | PixID | Counts | Sigma | Mean | Median | Sigma |
| A | 15 | 127 | 2265283 | 4710.9 | 1970 | 1982 | 480.4 |
| A | 4 | 32 | 167930 | 345.41 | 1970 | 1982 | 480.4 |
| A | 15 | 233 | 47420 | 94.57 | 1970 | 1982 | 480.4 |
| B | 8 | 4 | 1113441 | 2299.44 | 2054 | 2063 | 483.3 |
| B | 12 | 52 | 176218 | 360.33 | 2054 | 2063 | 483.3 |
| B | 6 | 53 | 121418 | 246.94 | 2054 | 2063 | 483.3 |
| C | 15 | 241 | 137762 | 257.28 | 1890 | 1959 | 527.8 |
| C | 3 | 79 | 36136 | 64.75 | 1890 | 1959 | 527.8 |
| C | 3 | 111 | 27943 | 49.23 | 1890 | 1959 | 527.8 |
| D | 12 | 22 | 2229478 | 4151.3 | 1723 | 1788 | 536.6 |
| D | 9 | 53 | 108599 | 199.04 | 1723 | 1788 | 536.6 |
| D | 10 | 84 | 54829 | 98.84 | 1723 | 1788 | 536.6 |
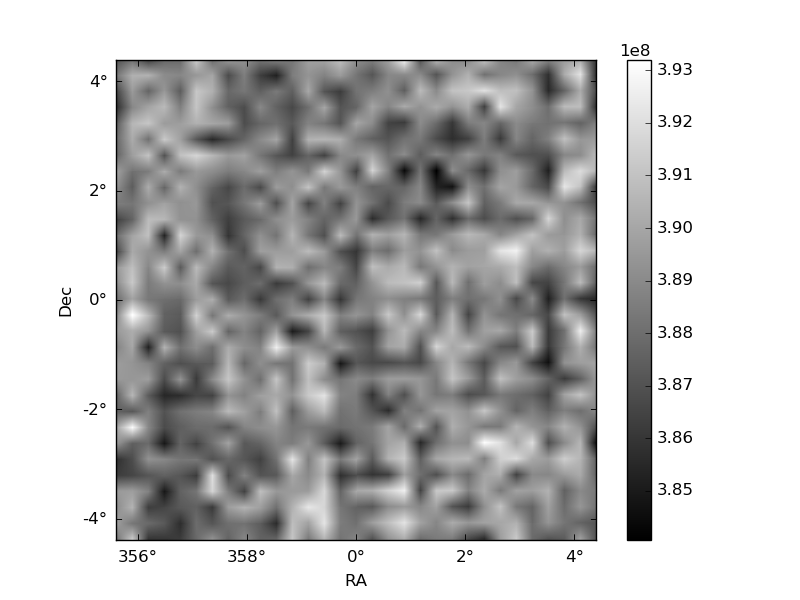
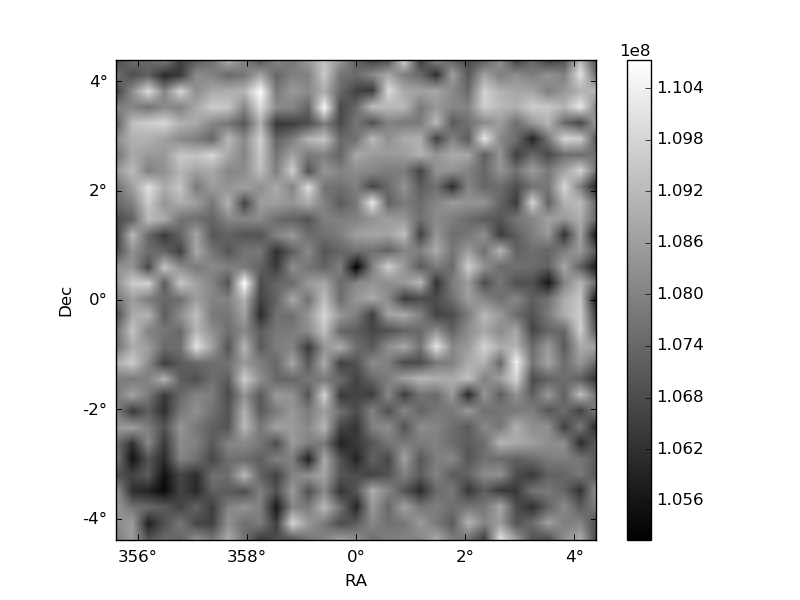
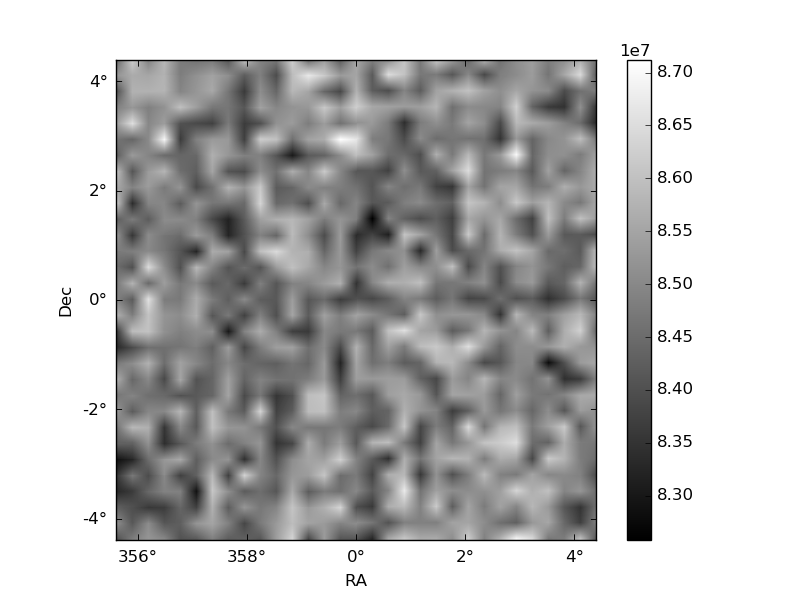
Histogram calculated using DETX and DETY for each event in the final _common_clean file
| Quadrant A | 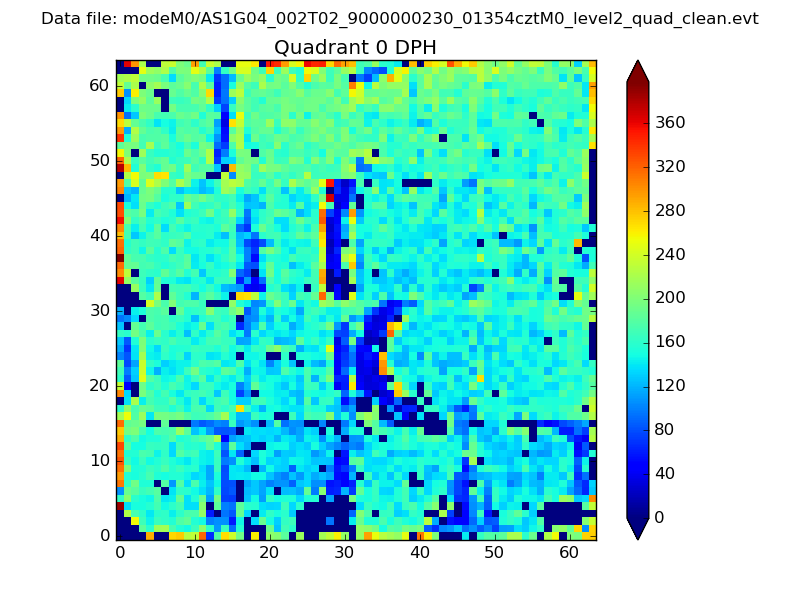 |
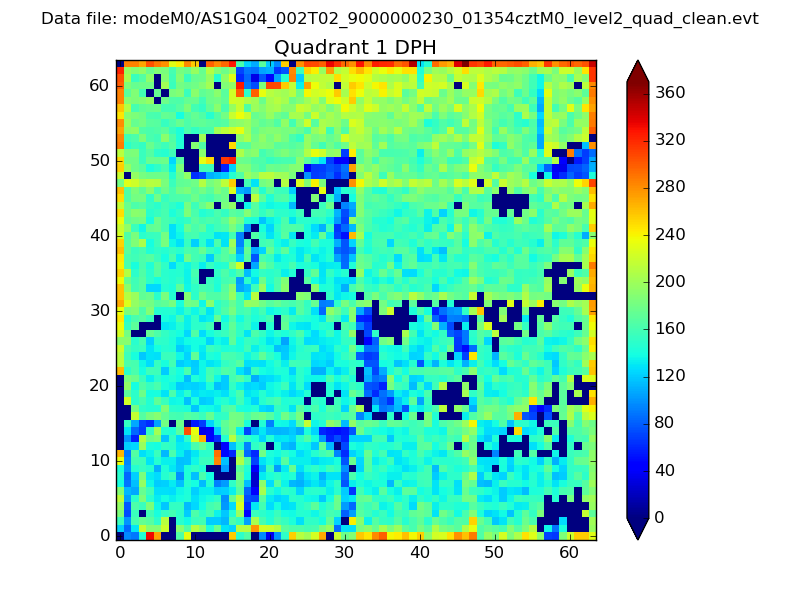 |
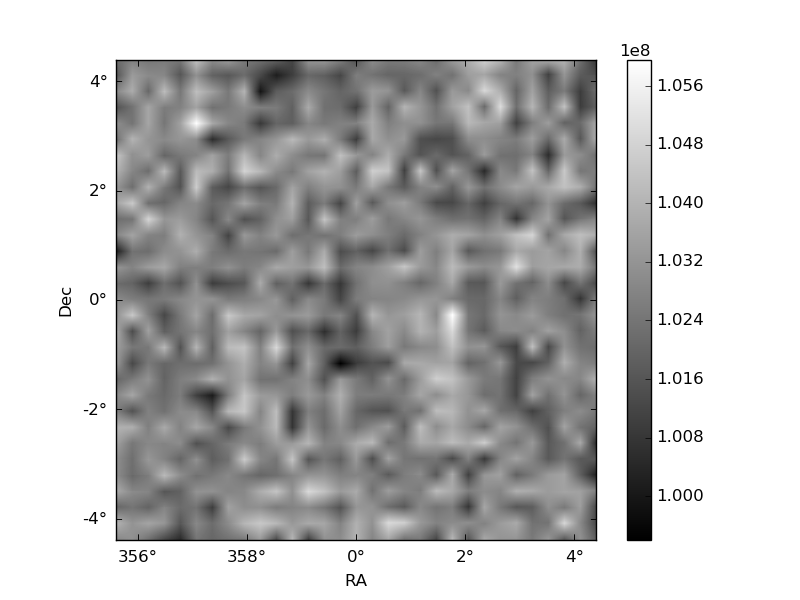
Quadrant B |
|---|---|---|---|
| Quadrant D | 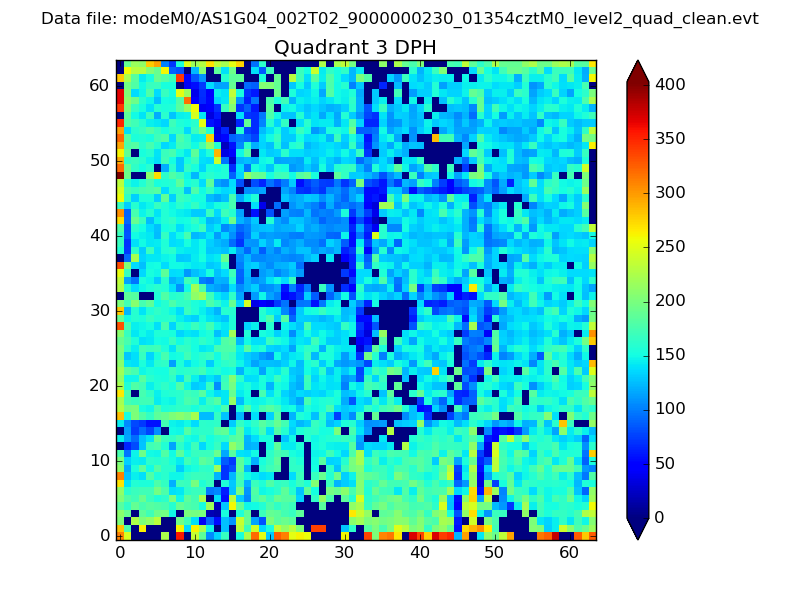 |
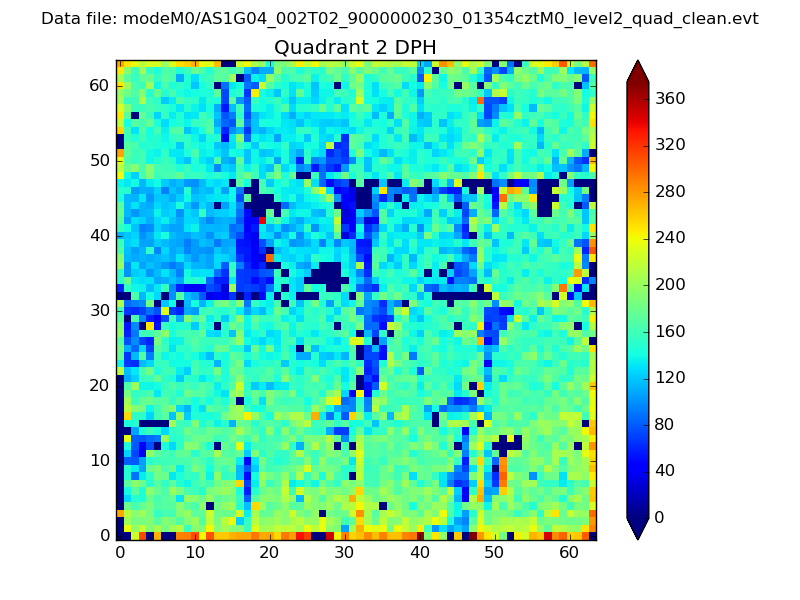 |
Quadrant C |
| Plot type | Count rate plots | Images |
|---|---|---|
| Comparison with Poisson distribution Blue bars denote a histogram of data divided into 1 sec bins. Red curve is a Poisson curve with rate = median count rate of data. |
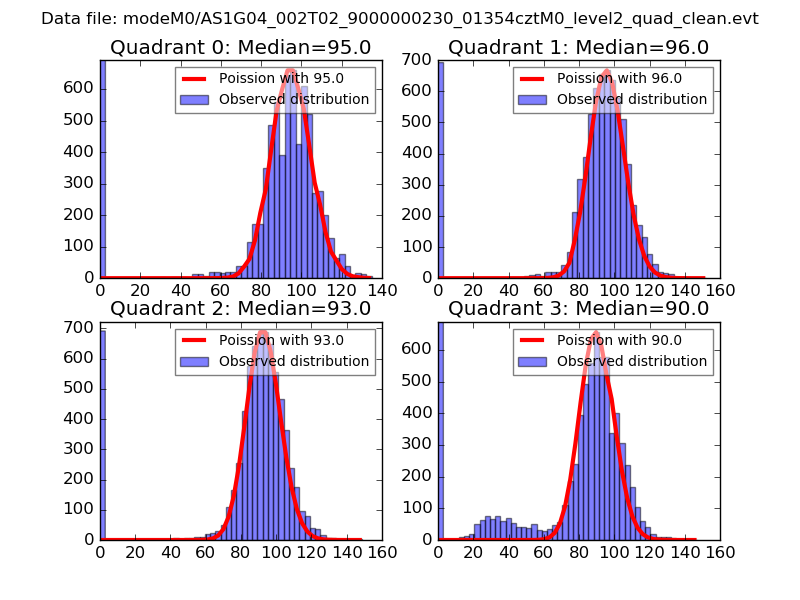 |
 |
| Quadrant-wise count rates Data is divided into 100 sec bins |
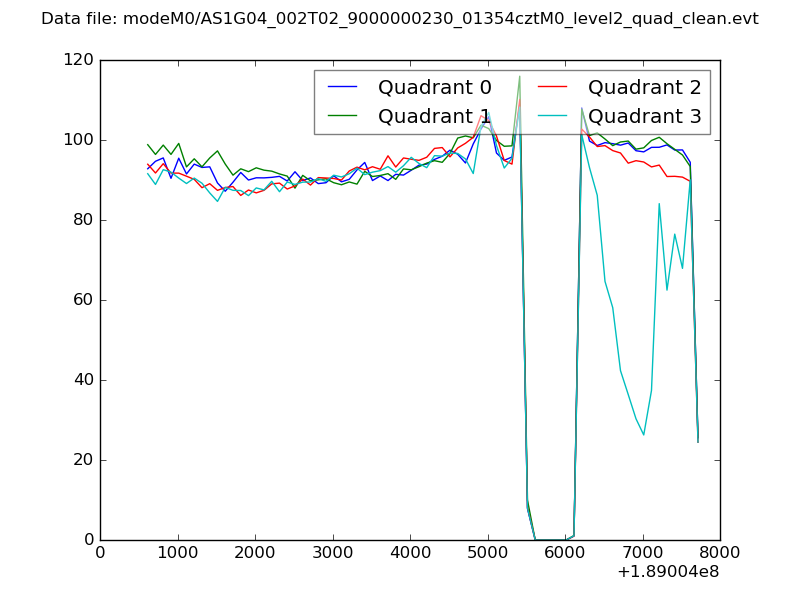 |
|
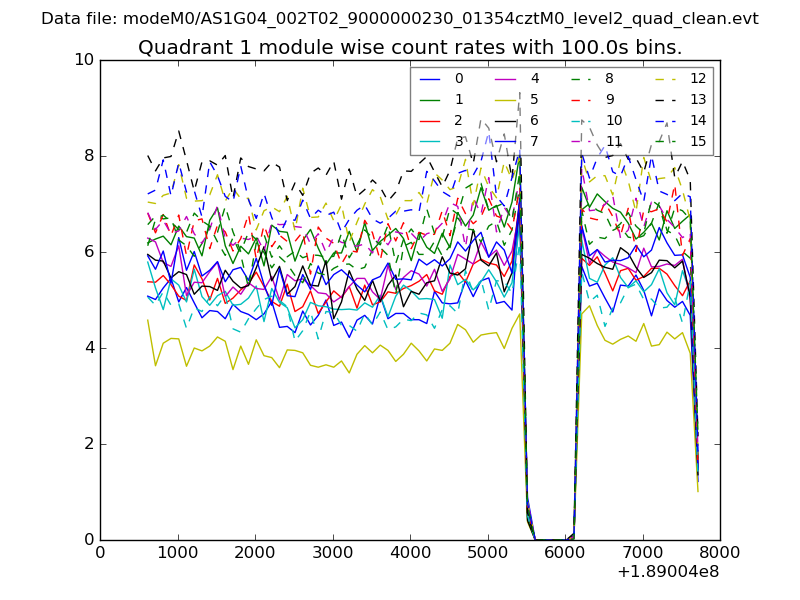
| Module-wise count rates for Quadrant A Data is divided into 100 sec bins |
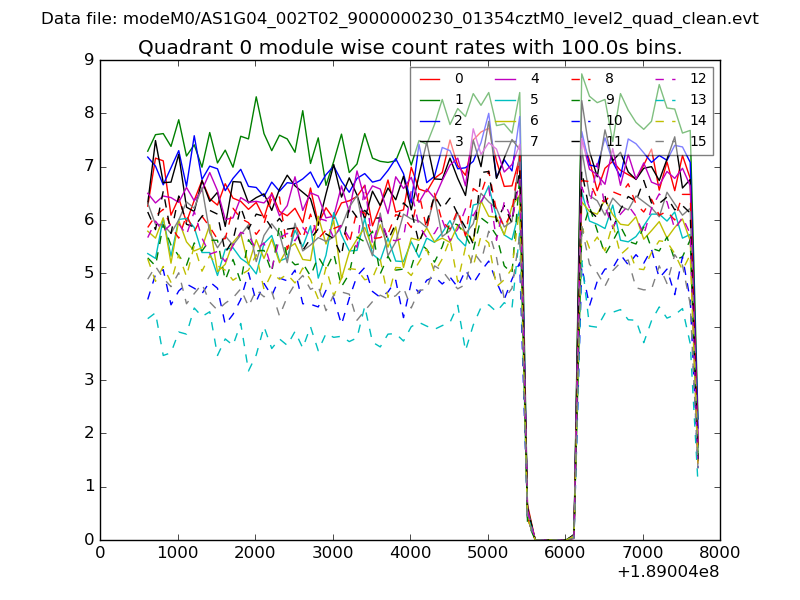 |
 |
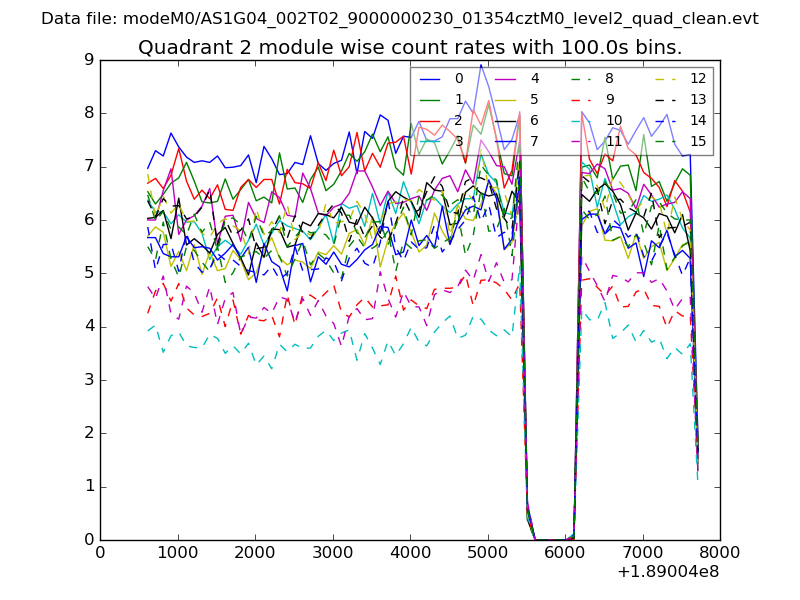
| Module-wise count rates for Quadrant B Data is divided into 100 sec bins |
 |
 |
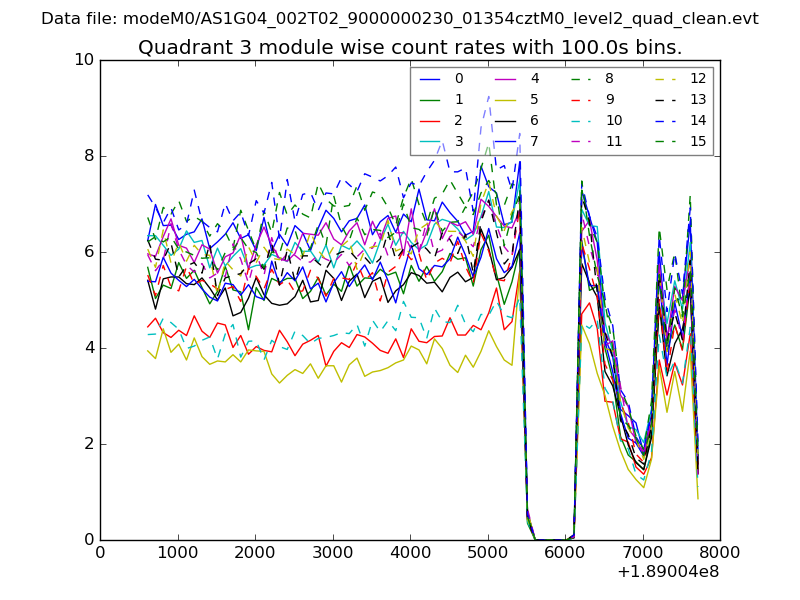
| Module-wise count rates for Quadrant C Data is divided into 100 sec bins |
 |
 |
| Module-wise count rates for Quadrant D Data is divided into 100 sec bins |
 |
 |
| Parameter | Plot |
|---|---|
| CZT HV Monitor | 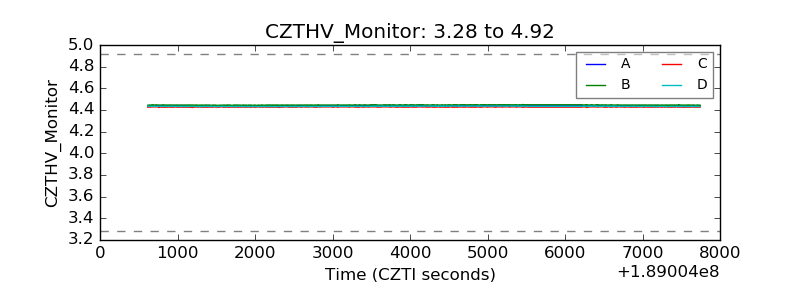 |
| D_VDD | 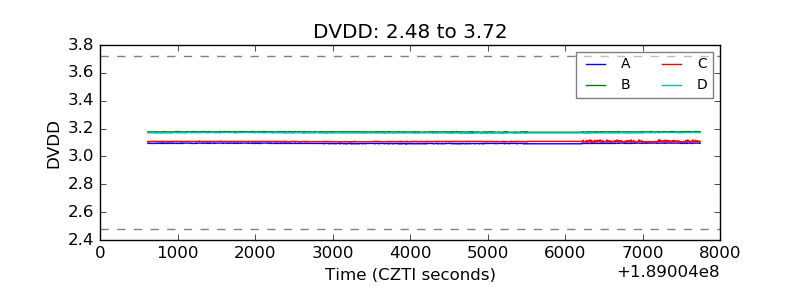 |
| Temperature 1 | 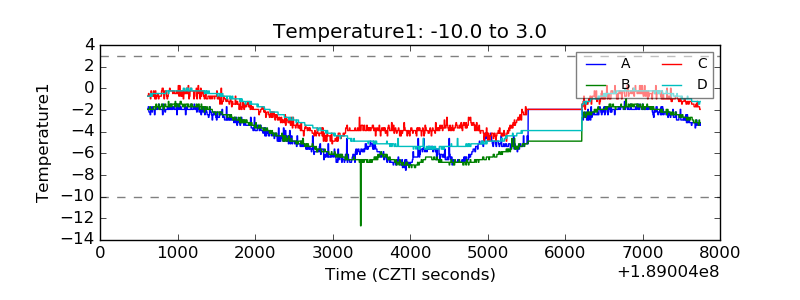 |
| Veto HV Monitor | 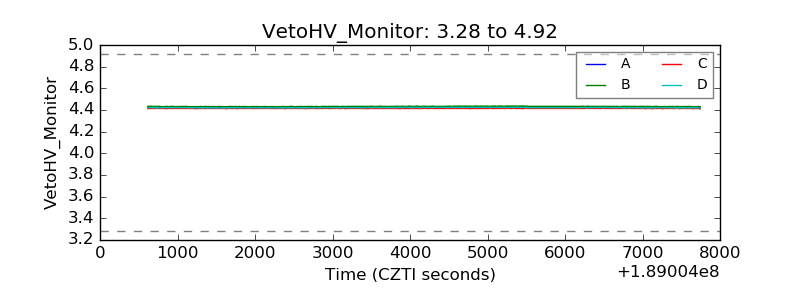 |
| Veto LLD | 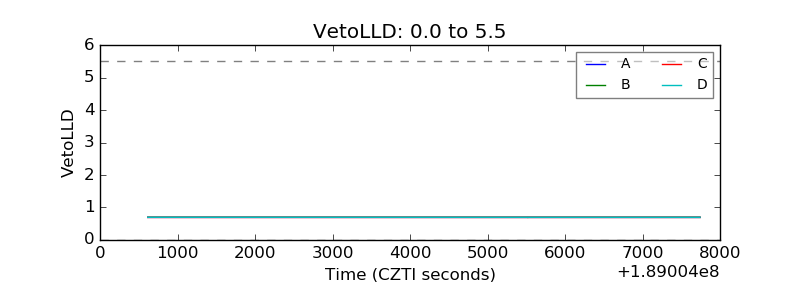 |
| Alpha Counter | 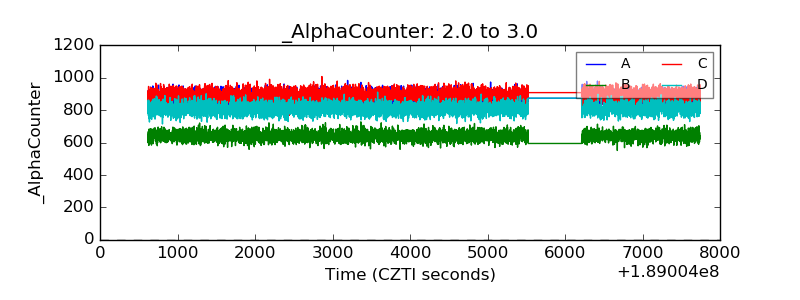 |
| _CPM_Rate | 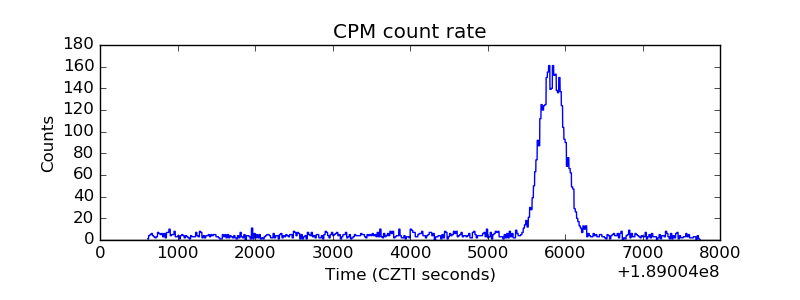 |
| CZT Counter | 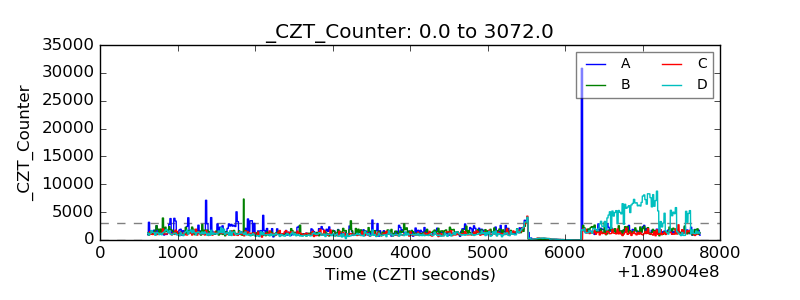 |
| +2.5 Volts monitor |  |
| +5 Volts monitor |  |
| _ROLL_ROT | 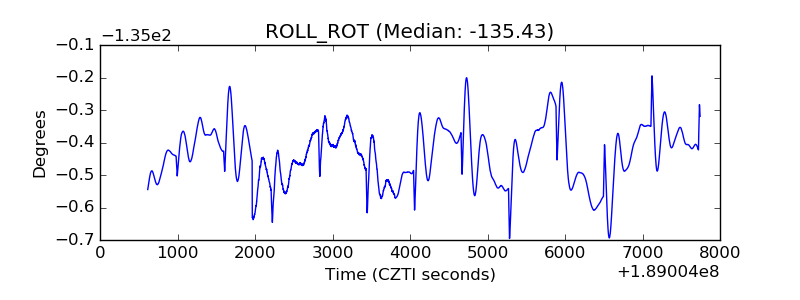 |
| _Roll_DEC | 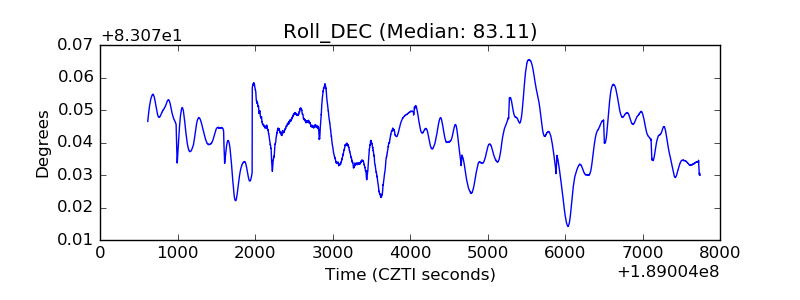 |
| _Roll_RA | 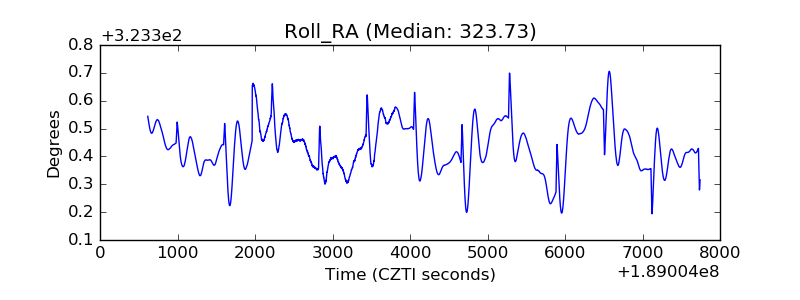 |
| Veto Counter | 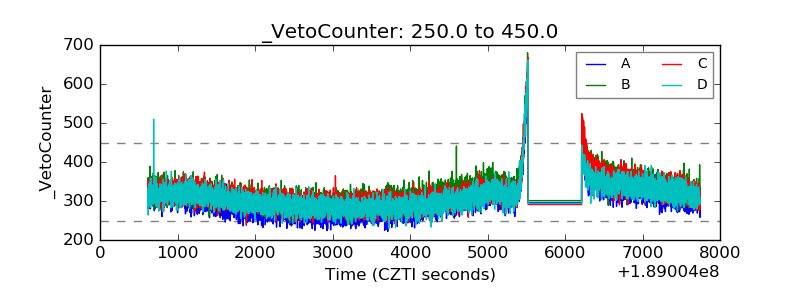 |