| Param | Original file | Final file |
|---|---|---|
| Filename | modeM0/AS1G04_002T02_9000000230_01355cztM0_level2.evt | modeM0/AS1G04_002T02_9000000230_01355cztM0_level2_quad_clean.evt |
| Size (bytes) | 1,108,149,120 | 89,233,920 |
| Size | 1.0 GB | 85.1 MB |
| Events in quadrant A | 10,636,563 | 561,253 |
| Events in quadrant B | 7,803,777 | 591,559 |
| Events in quadrant C | 7,107,555 | 576,949 |
| Events in quadrant D | 7,610,378 | 547,447 |
| Mode M9 | |||
|---|---|---|---|
| Quadrant | BADHDUFLAG | Total packets | Discarded packets |
| A | 0 | 9 | 0 |
| B | 0 | 9 | 0 |
| C | 0 | 9 | 0 |
| D | 0 | 9 | 0 |
| Mode M0 | |||
|---|---|---|---|
| Quadrant | BADHDUFLAG | Total packets | Discarded packets |
| A | 0 | 35974 | 2 |
| B | 0 | 27480 | 1 |
| C | 0 | 25425 | 1 |
| D | 0 | 27016 | 1 |
| Mode SS | |||
|---|---|---|---|
| Quadrant | BADHDUFLAG | Total packets | Discarded packets |
| A | 0 | 124 | 0 |
| B | 0 | 124 | 0 |
| C | 0 | 124 | 0 |
| D | 0 | 124 | 0 |
| Quadrant | Total seconds | Saturated seconds | Saturation percentage |
|---|---|---|---|
| A | 6079 | 678 | 11.153150% |
| B | 6079 | 30 | 0.493502% |
| C | 6079 | 8 | 0.131601% |
| D | 6079 | 446 | 7.336733% |
Noise dominated data is calculated using 1-second bins in cleaned event files. If a bin has >2000 counts, and if more than 50% of those come from <1% of pixels, then it is considered to be noise-dominated and hence unusable.
| Quadrant | # 1 sec bins | Bins with >0 counts | Bins with >2000 counts | High rate bins dominated by noise | Noise dominated (total time) | Noise dominated (detector-on time) | Marked lightcurve |
|---|---|---|---|---|---|---|---|
| A | 6979 | 6079 | 1824 | 1824 | 26.14% | 30.00% | 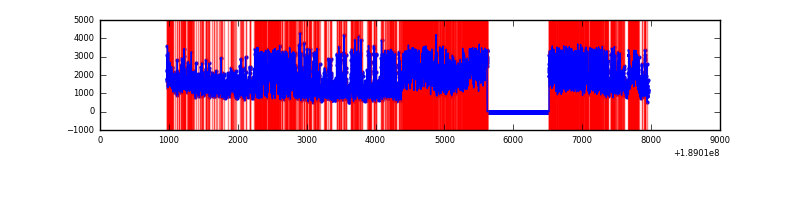 |
| B | 6979 | 6080 | 321 | 321 | 4.60% | 5.28% |  |
| C | 6979 | 6080 | 107 | 107 | 1.53% | 1.76% | 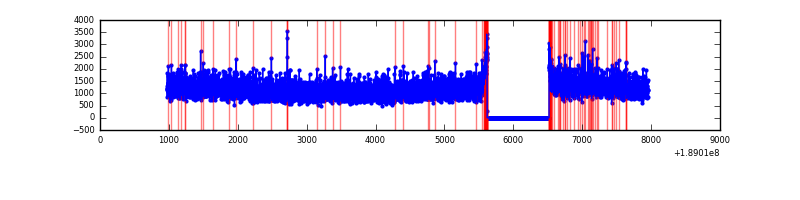 |
| D | 6979 | 6079 | 611 | 611 | 8.75% | 10.05% | 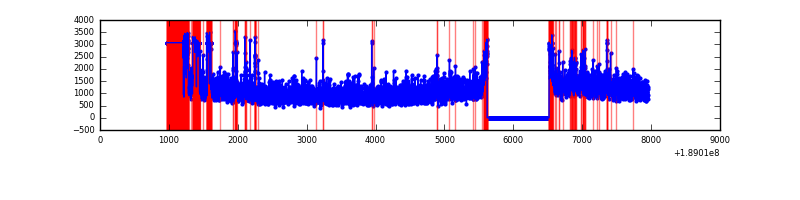 |
Top three noisy pixels from each quadrant. If the there are fewer than three noisy pixels in the level2.evt file, extra rows are filled as -1
| Pixel properties | Quadrant properties | ||||||
|---|---|---|---|---|---|---|---|
| Quadrant | DetID | PixID | Counts | Sigma | Mean | Median | Sigma |
| A | 15 | 127 | 3515345 | 8176.32 | 1786 | 1799 | 429.7 |
| A | 4 | 32 | 207635 | 479.0 | 1786 | 1799 | 429.7 |
| A | 0 | 51 | 35650 | 78.77 | 1786 | 1799 | 429.7 |
| B | 8 | 4 | 233373 | 511.38 | 1921 | 1931 | 452.6 |
| B | 6 | 53 | 153172 | 334.18 | 1921 | 1931 | 452.6 |
| B | 12 | 52 | 31108 | 64.47 | 1921 | 1931 | 452.6 |
| C | 15 | 241 | 132174 | 263.92 | 1764 | 1828 | 493.9 |
| C | 3 | 79 | 32880 | 62.87 | 1764 | 1828 | 493.9 |
| C | 3 | 111 | 27919 | 52.83 | 1764 | 1828 | 493.9 |
| D | 12 | 22 | 1120705 | 2206.62 | 1643 | 1705 | 507.1 |
| D | 9 | 53 | 97883 | 189.66 | 1643 | 1705 | 507.1 |
| D | 13 | 73 | 54730 | 104.56 | 1643 | 1705 | 507.1 |
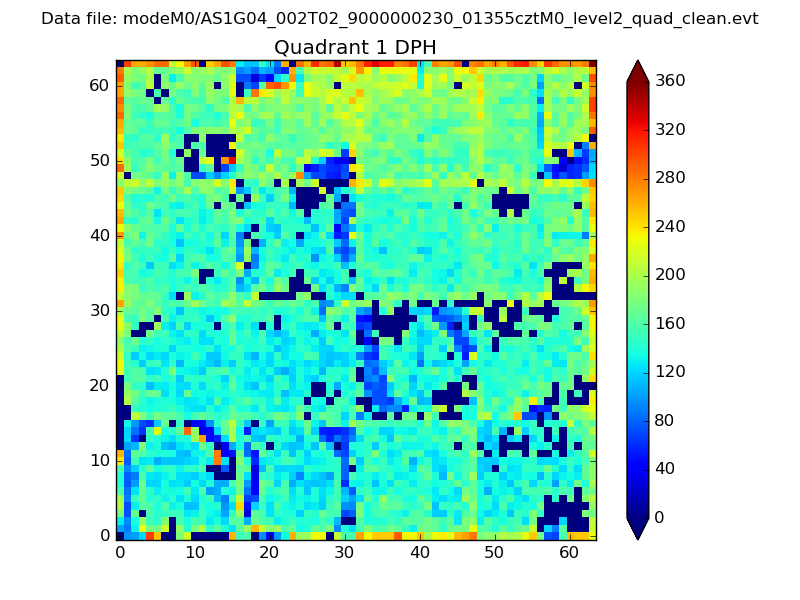
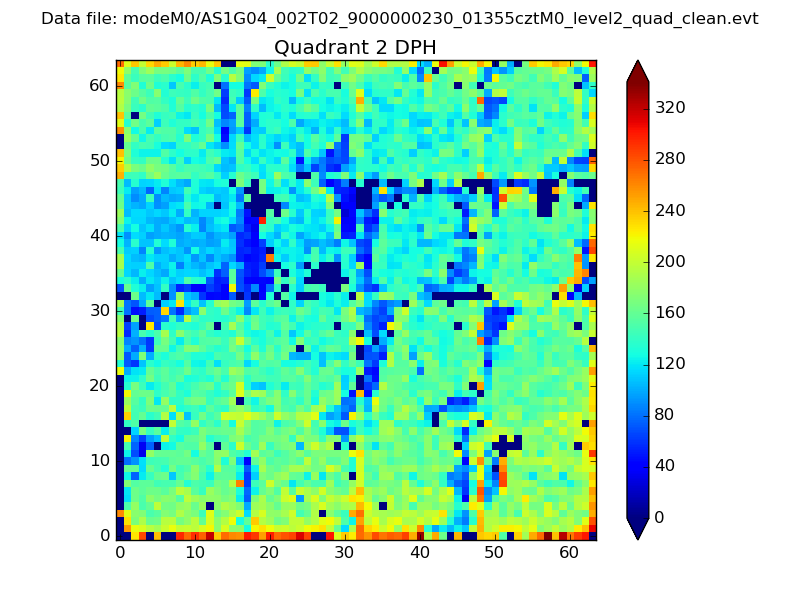
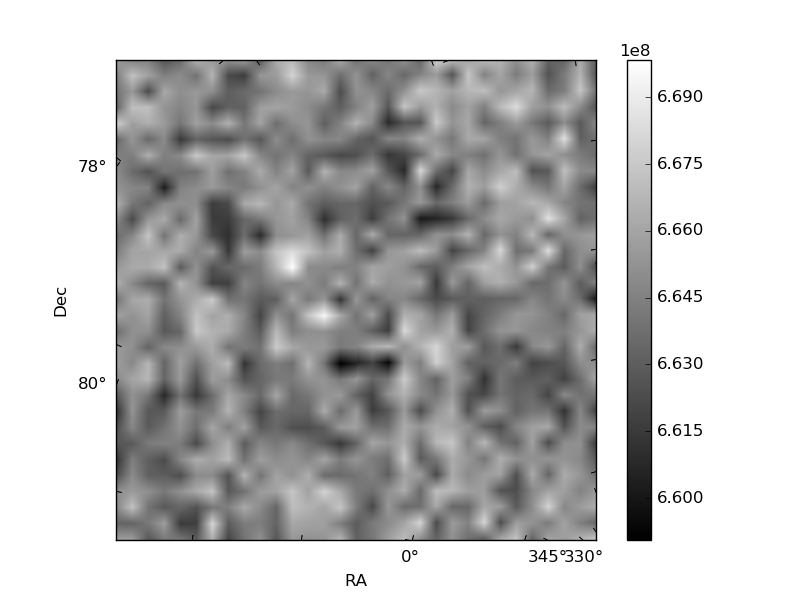
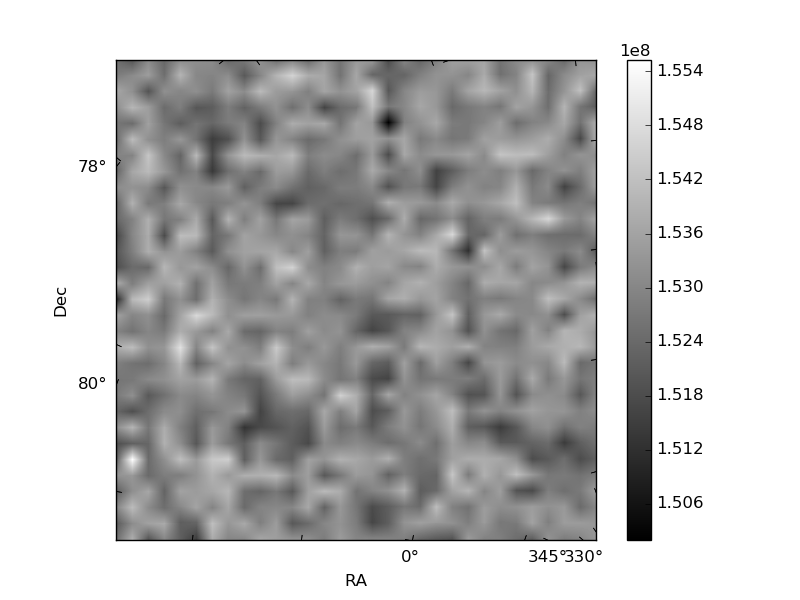
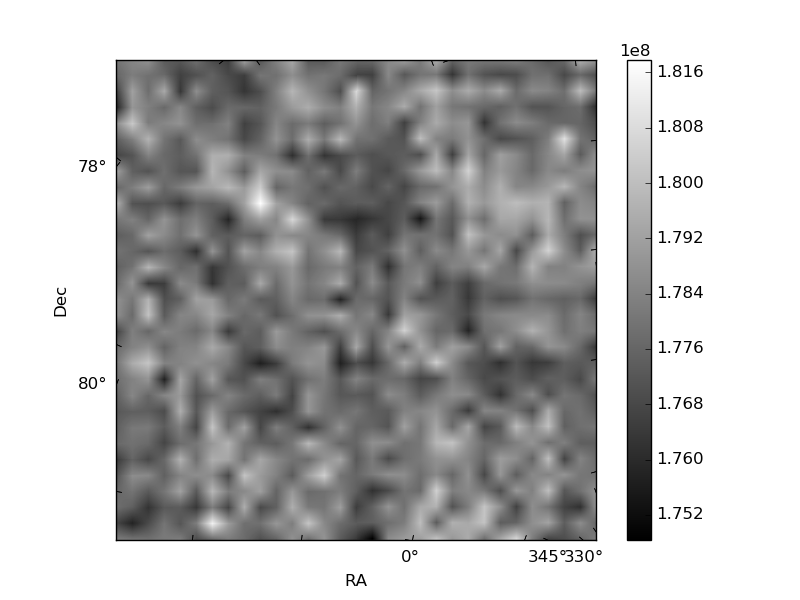
Histogram calculated using DETX and DETY for each event in the final _common_clean file
| Quadrant A | 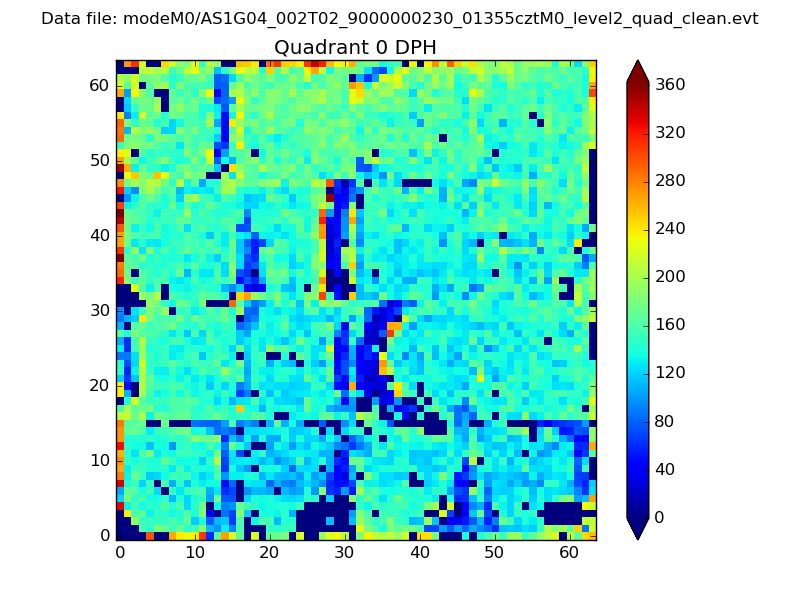 |
 |
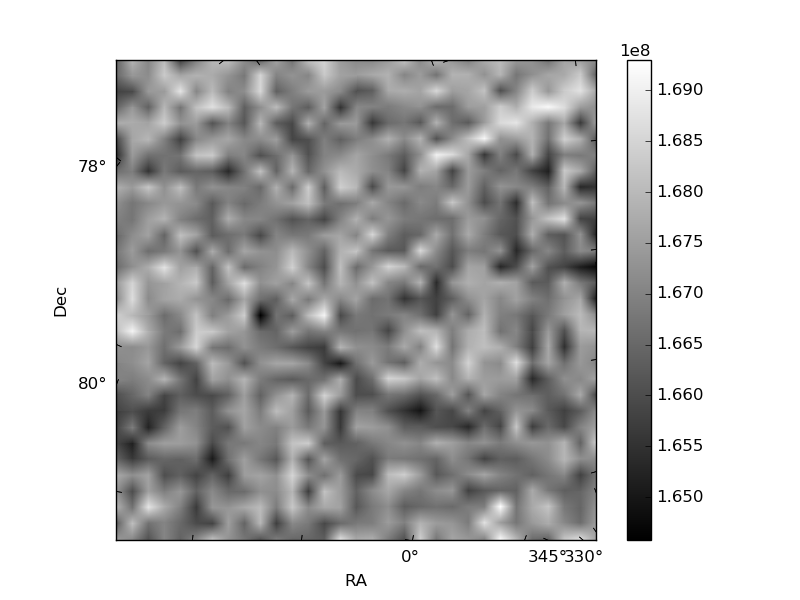
Quadrant B |
|---|---|---|---|
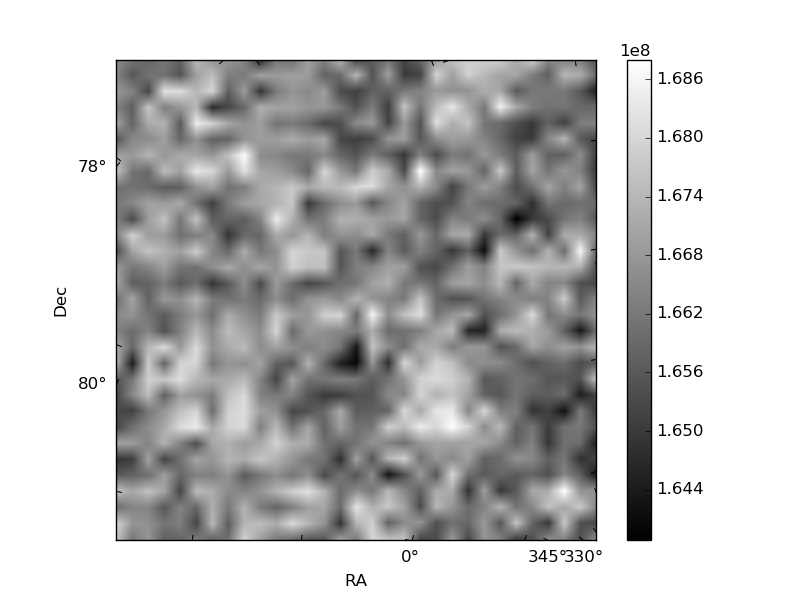
| Quadrant D | 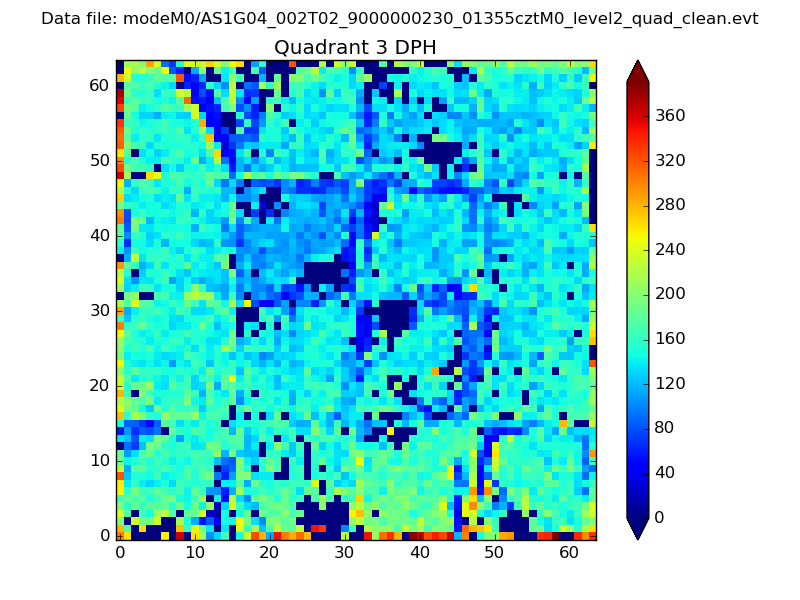 |
 |
Quadrant C |
| Plot type | Count rate plots | Images |
|---|---|---|
| Comparison with Poisson distribution Blue bars denote a histogram of data divided into 1 sec bins. Red curve is a Poisson curve with rate = median count rate of data. |
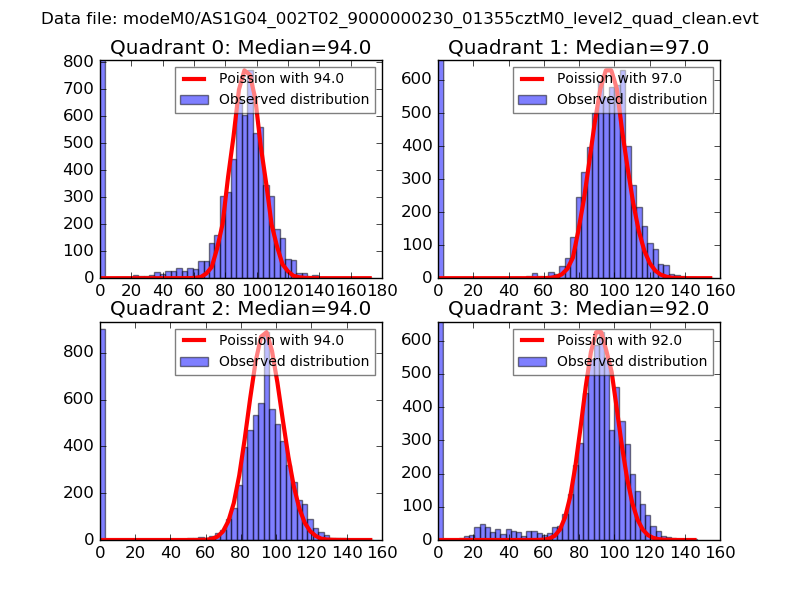 |
 |
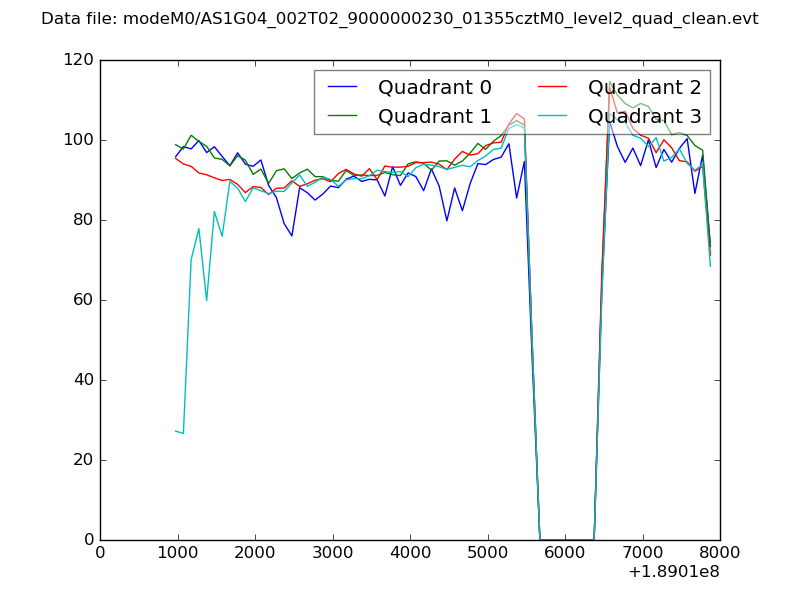
| Quadrant-wise count rates Data is divided into 100 sec bins |
 |
|
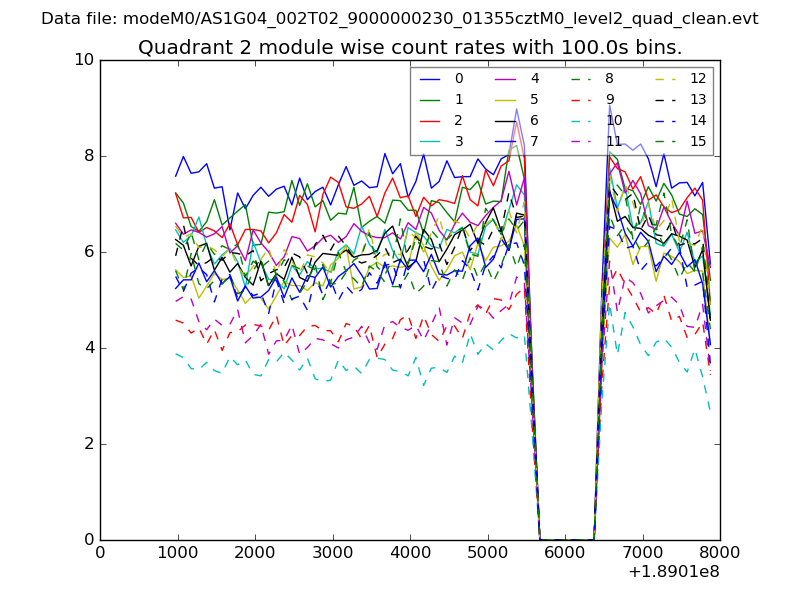
| Module-wise count rates for Quadrant A Data is divided into 100 sec bins |
 |
 |
| Module-wise count rates for Quadrant B Data is divided into 100 sec bins |
 |
 |
| Module-wise count rates for Quadrant C Data is divided into 100 sec bins |
 |
 |
| Module-wise count rates for Quadrant D Data is divided into 100 sec bins |
 |
 |
| Parameter | Plot |
|---|---|
| CZT HV Monitor | 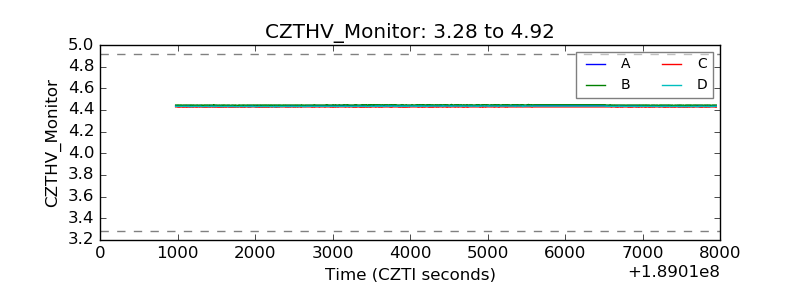 |
| D_VDD | 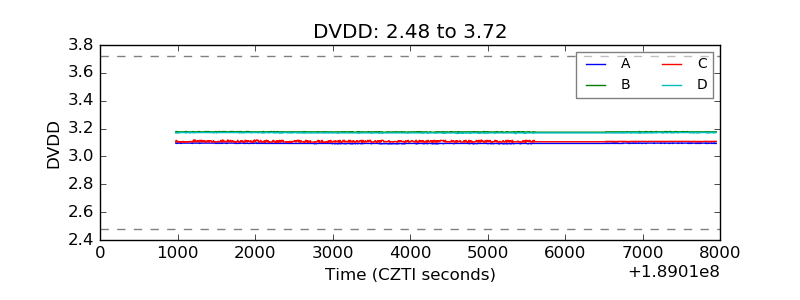 |
| Temperature 1 | 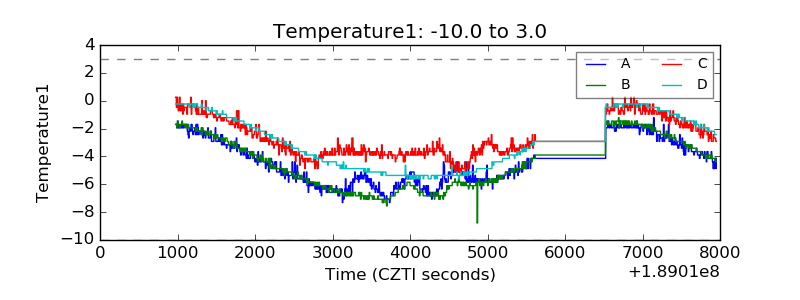 |
| Veto HV Monitor | 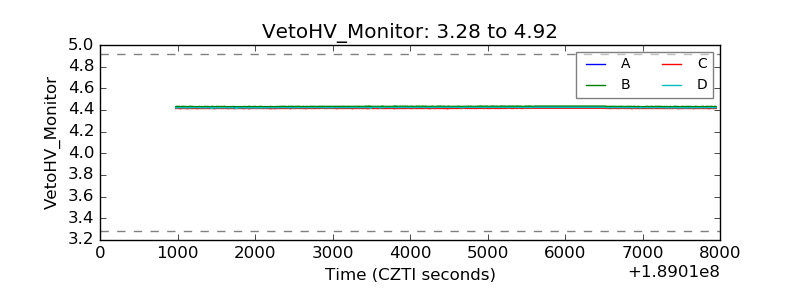 |
| Veto LLD | 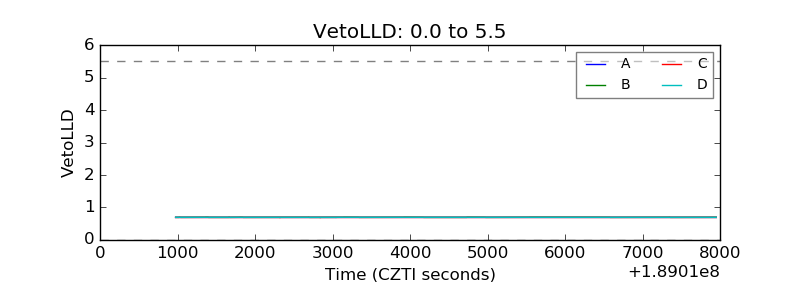 |
| Alpha Counter | 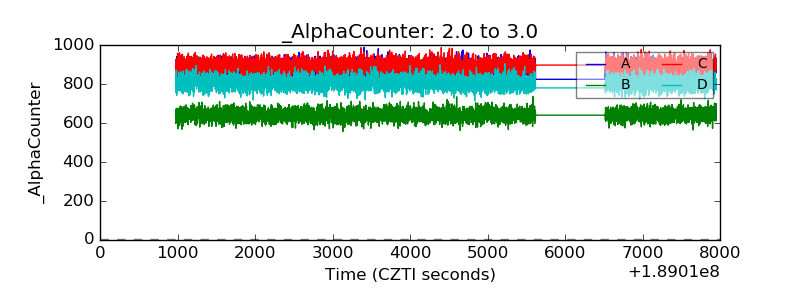 |
| _CPM_Rate | 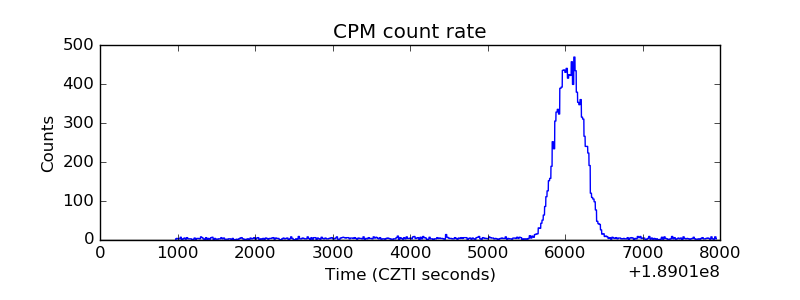 |
| CZT Counter | 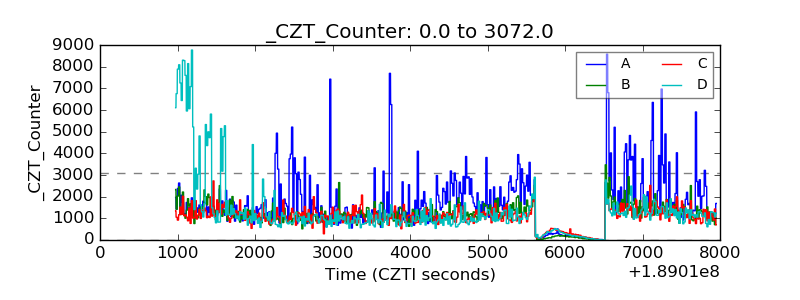 |
| +2.5 Volts monitor |  |
| +5 Volts monitor |  |
| _ROLL_ROT | 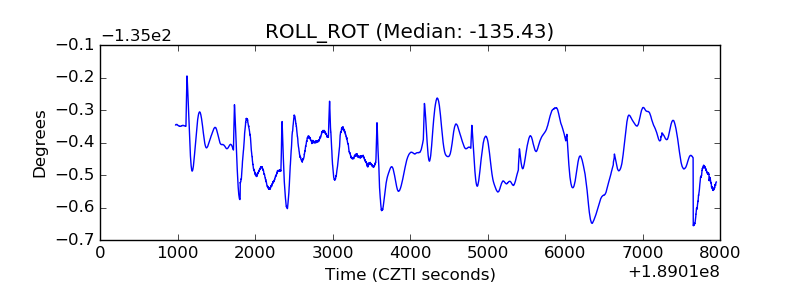 |
| _Roll_DEC | 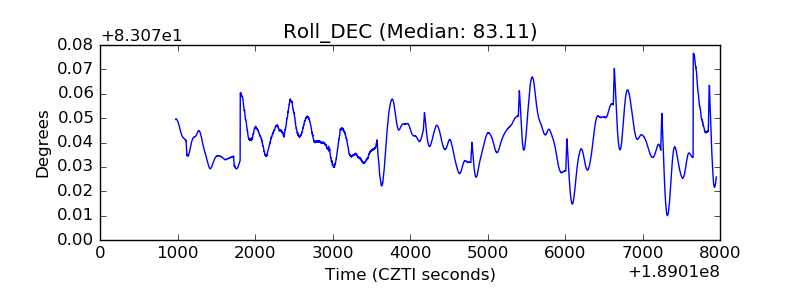 |
| _Roll_RA | 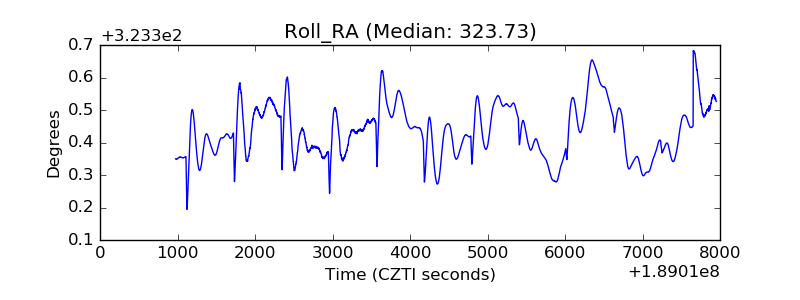 |
| Veto Counter | 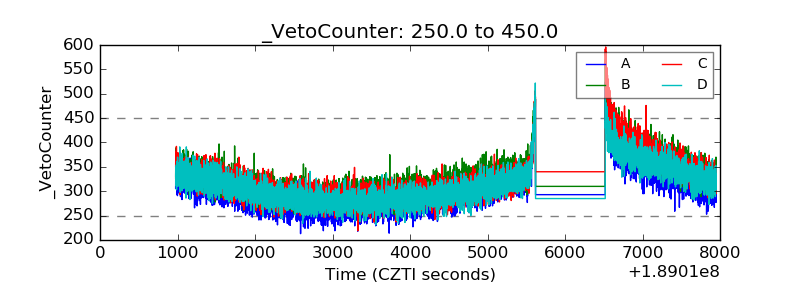 |