| Param | Original file | Final file |
|---|---|---|
| Filename | modeM0/AS1G04_002T02_9000000230_01358cztM0_level2.evt | modeM0/AS1G04_002T02_9000000230_01358cztM0_level2_quad_clean.evt |
| Size (bytes) | 1,180,212,480 | 96,802,560 |
| Size | 1.1 GB | 92.3 MB |
| Events in quadrant A | 12,602,075 | 568,743 |
| Events in quadrant B | 8,092,194 | 651,200 |
| Events in quadrant C | 7,476,796 | 643,828 |
| Events in quadrant D | 7,154,277 | 626,271 |
| Mode M9 | |||
|---|---|---|---|
| Quadrant | BADHDUFLAG | Total packets | Discarded packets |
| A | 0 | 12 | 0 |
| B | 0 | 12 | 0 |
| C | 0 | 12 | 0 |
| D | 0 | 12 | 0 |
| Mode M0 | |||
|---|---|---|---|
| Quadrant | BADHDUFLAG | Total packets | Discarded packets |
| A | 0 | 42123 | 3 |
| B | 0 | 28496 | 2 |
| C | 0 | 26637 | 2 |
| D | 0 | 25752 | 2 |
| Mode SS | |||
|---|---|---|---|
| Quadrant | BADHDUFLAG | Total packets | Discarded packets |
| A | 0 | 128 | 0 |
| B | 0 | 128 | 0 |
| C | 0 | 128 | 0 |
| D | 0 | 128 | 0 |
| Quadrant | Total seconds | Saturated seconds | Saturation percentage |
|---|---|---|---|
| A | 6320 | 1394 | 22.056962% |
| B | 6320 | 40 | 0.632911% |
| C | 6320 | 8 | 0.126582% |
| D | 6320 | 31 | 0.490506% |
Noise dominated data is calculated using 1-second bins in cleaned event files. If a bin has >2000 counts, and if more than 50% of those come from <1% of pixels, then it is considered to be noise-dominated and hence unusable.
| Quadrant | # 1 sec bins | Bins with >0 counts | Bins with >2000 counts | High rate bins dominated by noise | Noise dominated (total time) | Noise dominated (detector-on time) | Marked lightcurve |
|---|---|---|---|---|---|---|---|
| A | 7469 | 6320 | 2828 | 2828 | 37.86% | 44.75% | 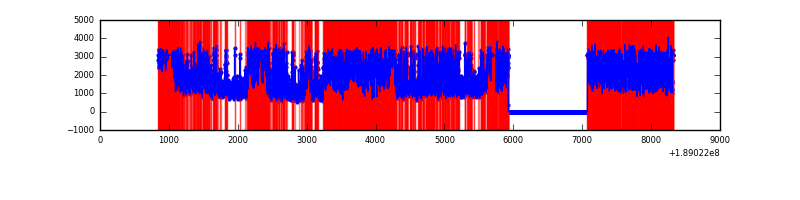 |
| B | 7470 | 6321 | 316 | 316 | 4.23% | 5.00% | 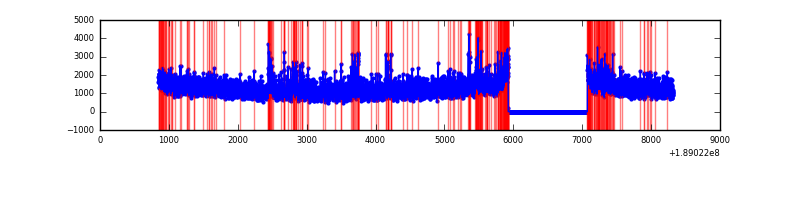 |
| C | 7470 | 6321 | 149 | 149 | 1.99% | 2.36% | 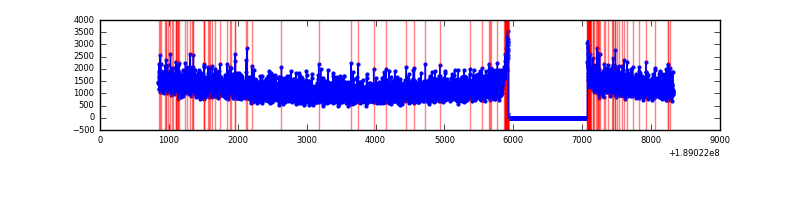 |
| D | 7470 | 6320 | 347 | 347 | 4.65% | 5.49% | 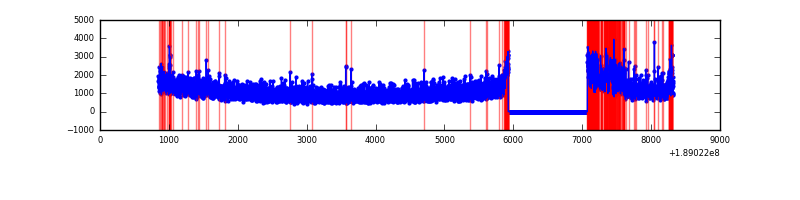 |
Top three noisy pixels from each quadrant. If the there are fewer than three noisy pixels in the level2.evt file, extra rows are filled as -1
| Pixel properties | Quadrant properties | ||||||
|---|---|---|---|---|---|---|---|
| Quadrant | DetID | PixID | Counts | Sigma | Mean | Median | Sigma |
| A | 15 | 127 | 5758562 | 13573.81 | 1756 | 1766 | 424.1 |
| A | 4 | 32 | 80139 | 184.79 | 1756 | 1766 | 424.1 |
| A | 12 | 133 | 19861 | 42.67 | 1756 | 1766 | 424.1 |
| B | 8 | 4 | 201147 | 428.34 | 1999 | 2005 | 464.9 |
| B | 5 | 249 | 86561 | 181.87 | 1999 | 2005 | 464.9 |
| B | 12 | 52 | 80415 | 168.65 | 1999 | 2005 | 464.9 |
| C | 15 | 241 | 198857 | 384.04 | 1852 | 1916 | 512.8 |
| C | 3 | 111 | 21813 | 38.8 | 1852 | 1916 | 512.8 |
| C | 3 | 79 | 18539 | 32.42 | 1852 | 1916 | 512.8 |
| D | 12 | 22 | 346467 | 627.94 | 1783 | 1854 | 548.8 |
| D | 9 | 53 | 52335 | 91.98 | 1783 | 1854 | 548.8 |
| D | 13 | 252 | 17472 | 28.46 | 1783 | 1854 | 548.8 |
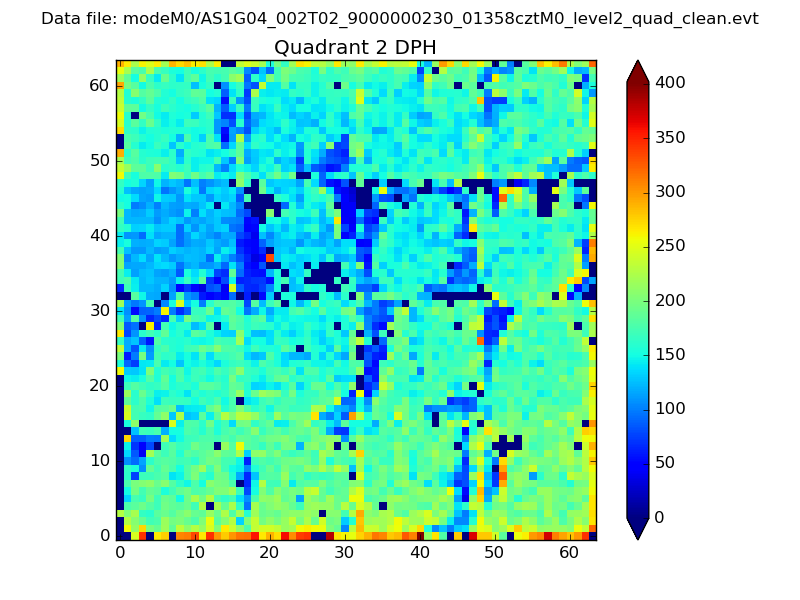
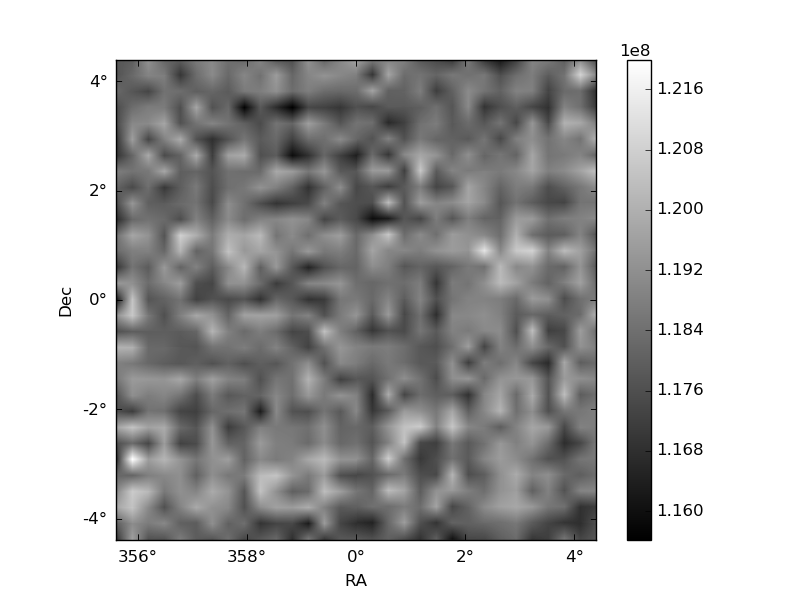
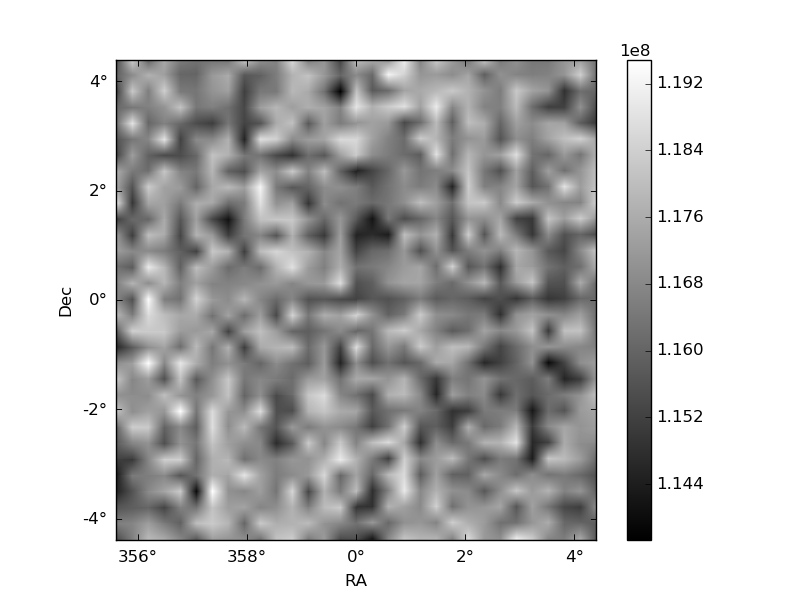
Histogram calculated using DETX and DETY for each event in the final _common_clean file
| Quadrant A | 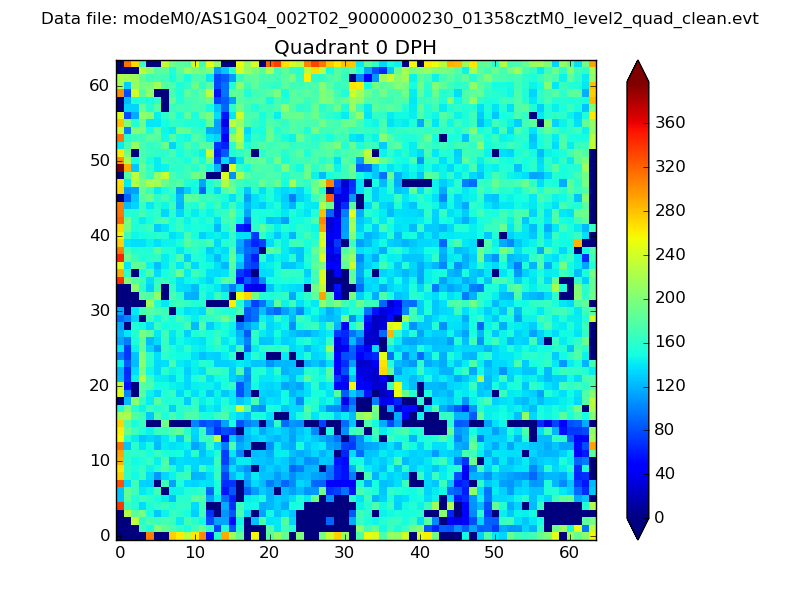 |
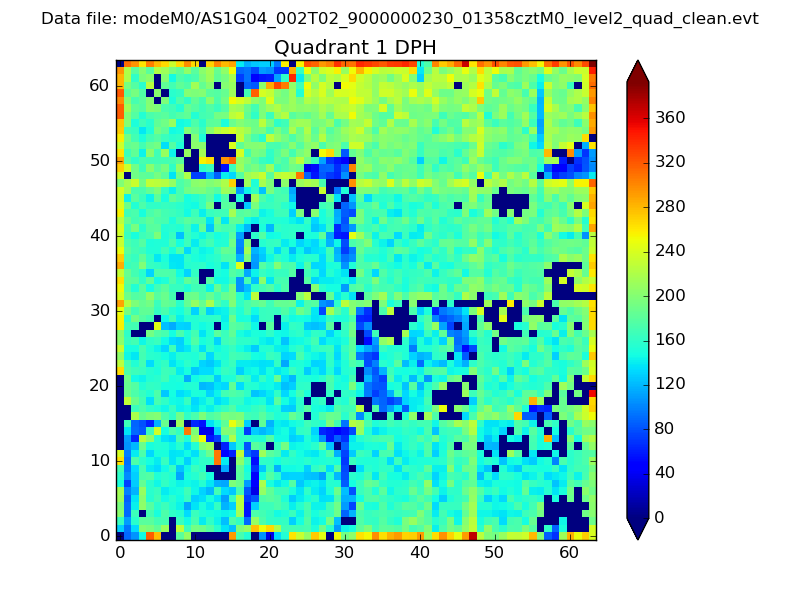 |
Quadrant B |
|---|---|---|---|
| Quadrant D | 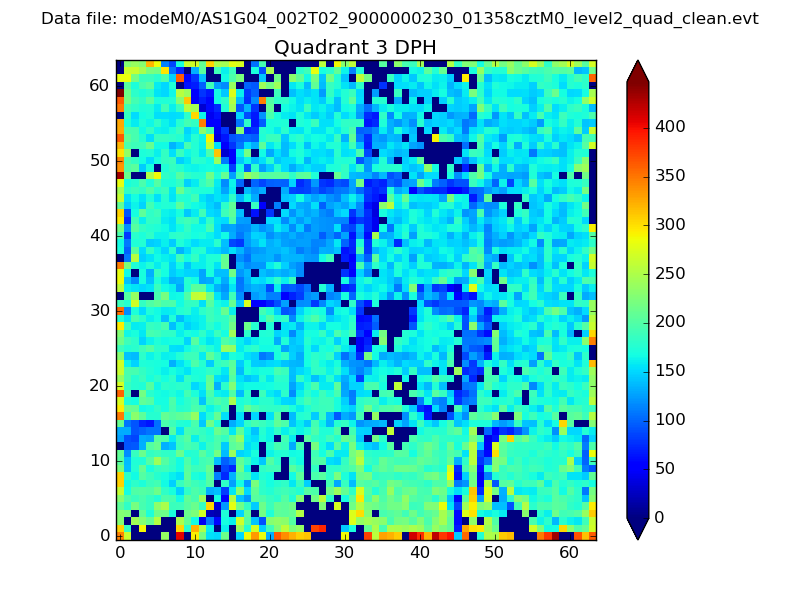 |
 |
Quadrant C |
| Plot type | Count rate plots | Images |
|---|---|---|
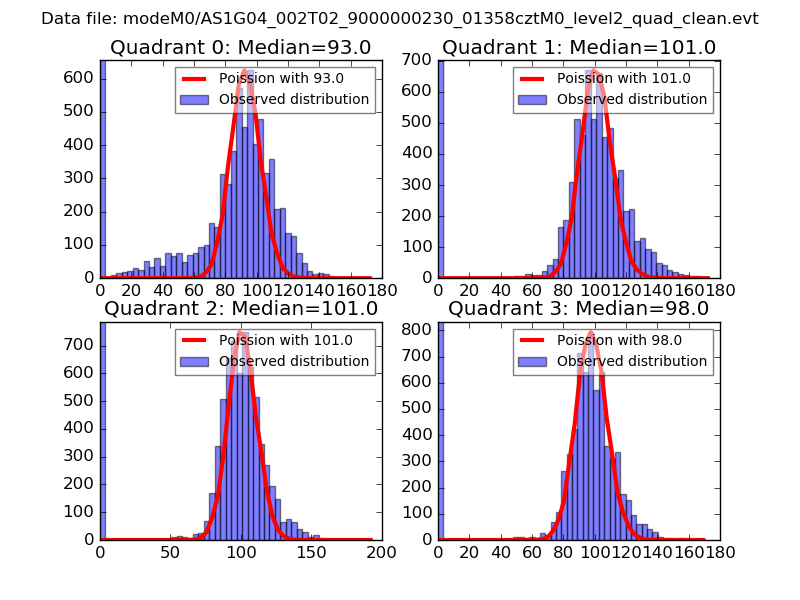
| Comparison with Poisson distribution Blue bars denote a histogram of data divided into 1 sec bins. Red curve is a Poisson curve with rate = median count rate of data. |
 |
 |
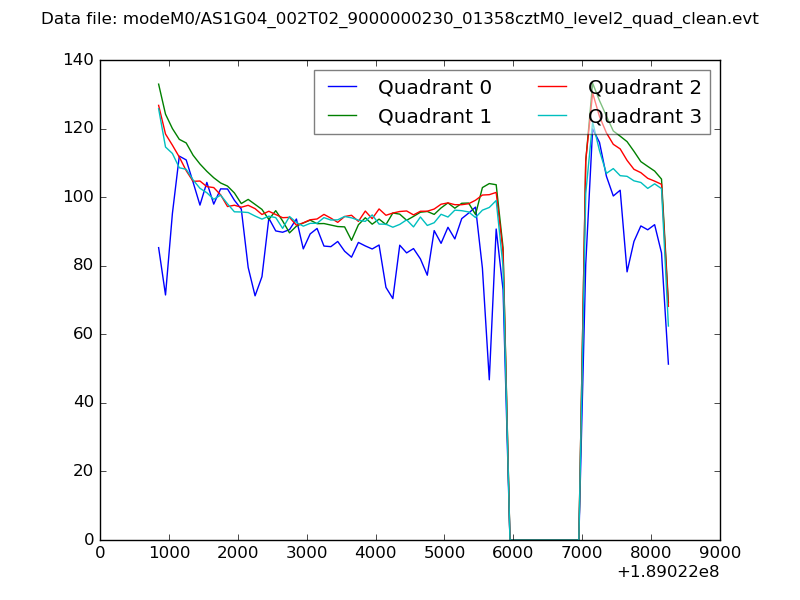
| Quadrant-wise count rates Data is divided into 100 sec bins |
 |
|
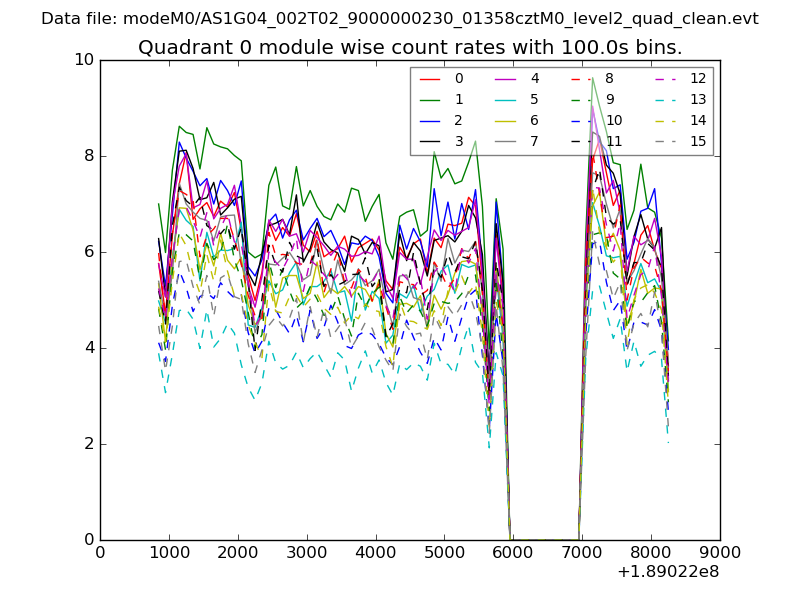
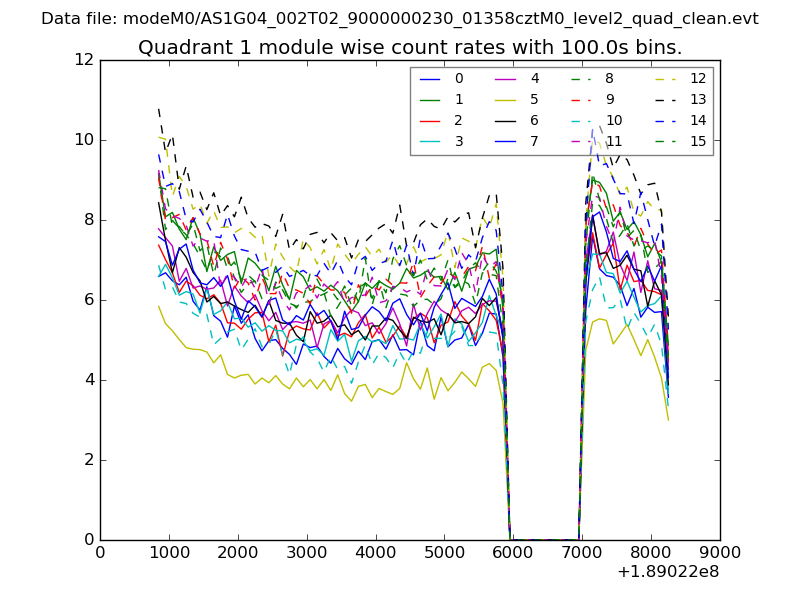
| Module-wise count rates for Quadrant A Data is divided into 100 sec bins |
 |
 |
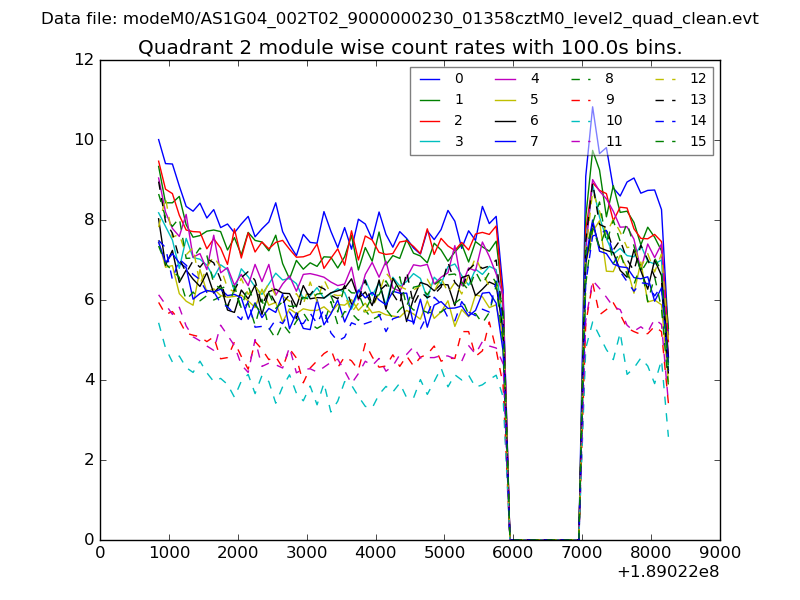
| Module-wise count rates for Quadrant B Data is divided into 100 sec bins |
 |
 |
| Module-wise count rates for Quadrant C Data is divided into 100 sec bins |
 |
 |
| Module-wise count rates for Quadrant D Data is divided into 100 sec bins |
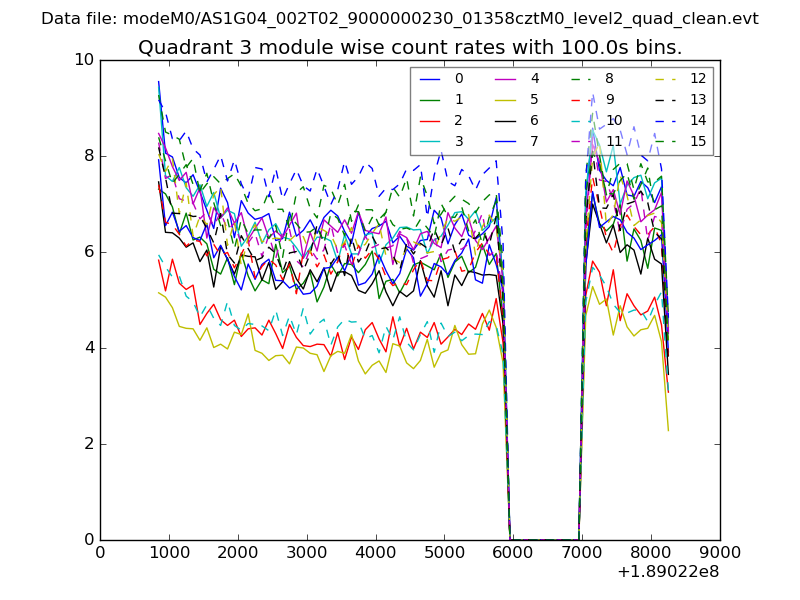 |
 |
| Parameter | Plot |
|---|---|
| CZT HV Monitor | 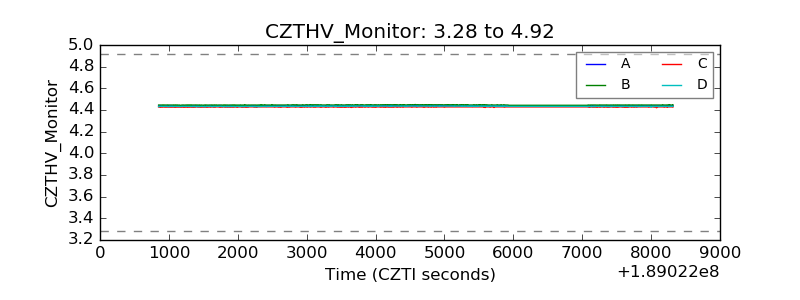 |
| D_VDD | 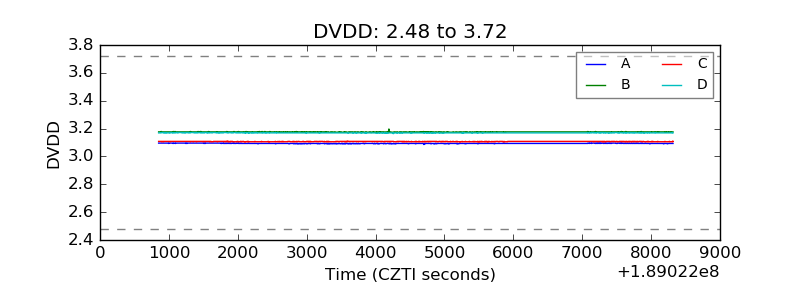 |
| Temperature 1 | 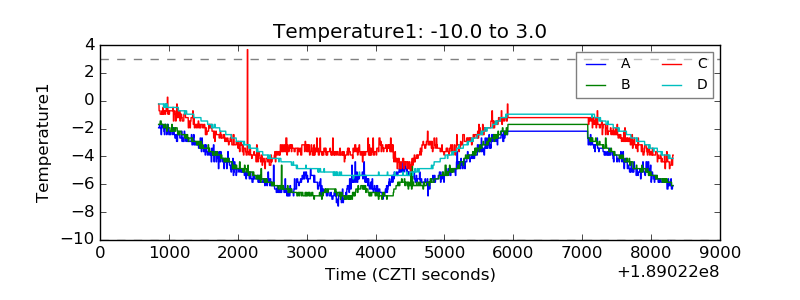 |
| Veto HV Monitor | 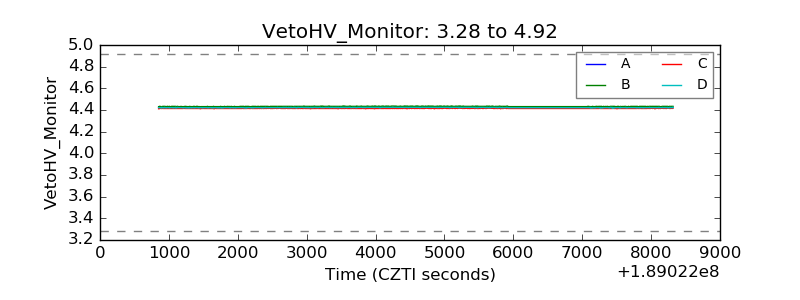 |
| Veto LLD | 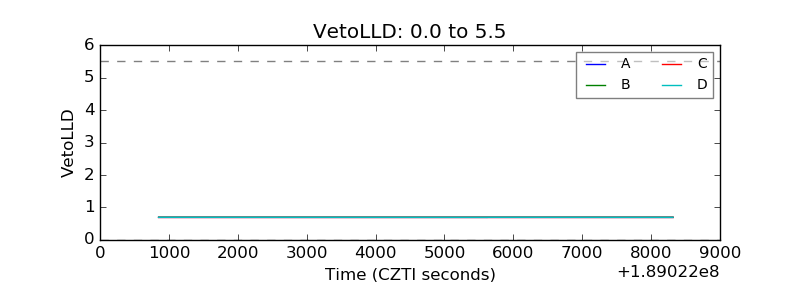 |
| Alpha Counter | 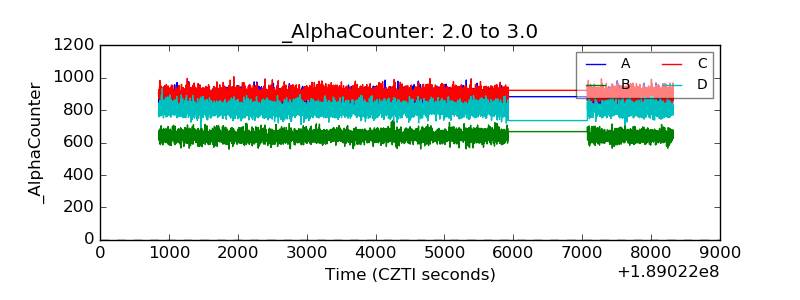 |
| _CPM_Rate | 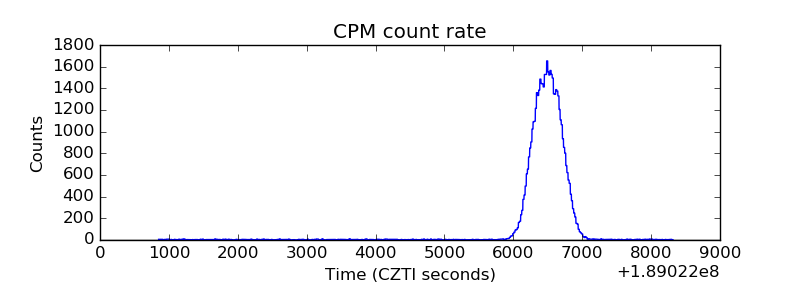 |
| CZT Counter | 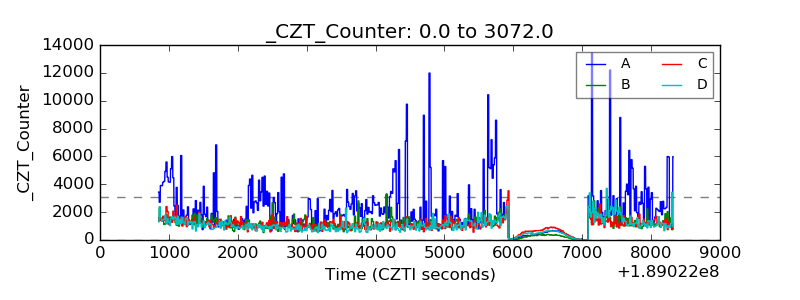 |
| +2.5 Volts monitor |  |
| +5 Volts monitor |  |
| _ROLL_ROT | 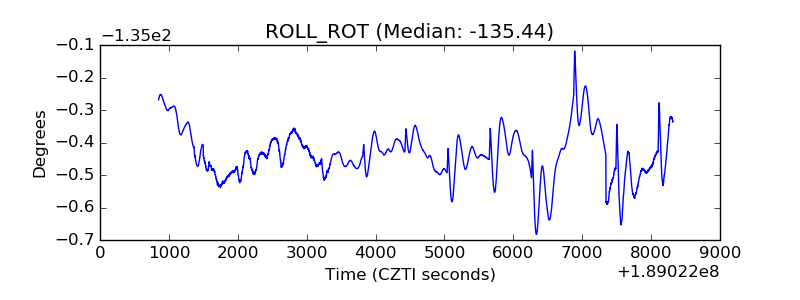 |
| _Roll_DEC | 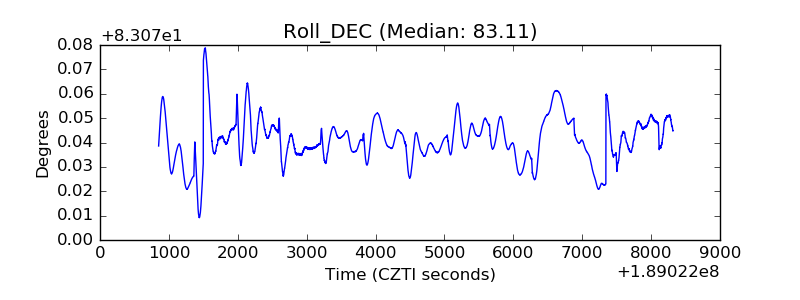 |
| _Roll_RA | 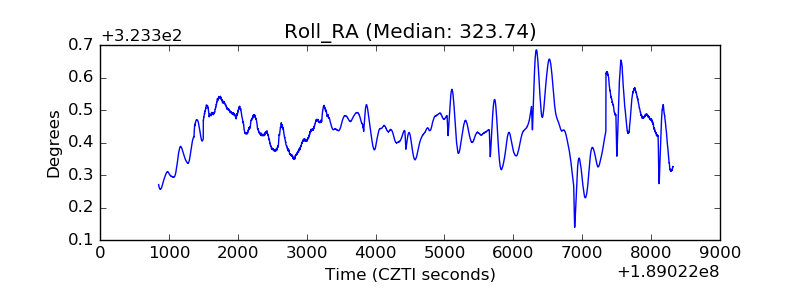 |
| Veto Counter | 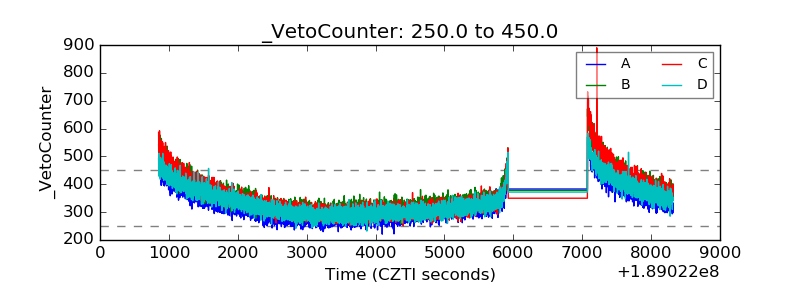 |