| Param | Original file | Final file |
|---|---|---|
| Filename | modeM0/AS1G04_002T02_9000000230_01359cztM0_level2.evt | modeM0/AS1G04_002T02_9000000230_01359cztM0_level2_quad_clean.evt |
| Size (bytes) | 1,202,673,600 | 96,108,480 |
| Size | 1.1 GB | 91.7 MB |
| Events in quadrant A | 12,996,096 | 521,846 |
| Events in quadrant B | 8,005,426 | 663,616 |
| Events in quadrant C | 7,340,427 | 657,257 |
| Events in quadrant D | 7,666,353 | 628,904 |
| Mode M9 | |||
|---|---|---|---|
| Quadrant | BADHDUFLAG | Total packets | Discarded packets |
| A | 0 | 16 | 0 |
| B | 0 | 16 | 0 |
| C | 0 | 16 | 0 |
| D | 0 | 17 | 0 |
| Mode M0 | |||
|---|---|---|---|
| Quadrant | BADHDUFLAG | Total packets | Discarded packets |
| A | 0 | 43387 | 3 |
| B | 0 | 28239 | 2 |
| C | 0 | 26249 | 2 |
| D | 0 | 27279 | 2 |
| Mode SS | |||
|---|---|---|---|
| Quadrant | BADHDUFLAG | Total packets | Discarded packets |
| A | 0 | 128 | 0 |
| B | 0 | 128 | 0 |
| C | 0 | 128 | 0 |
| D | 0 | 128 | 0 |
| Quadrant | Total seconds | Saturated seconds | Saturation percentage |
|---|---|---|---|
| A | 6274 | 2106 | 33.567102% |
| B | 6274 | 21 | 0.334715% |
| C | 6274 | 6 | 0.095633% |
| D | 6274 | 101 | 1.609818% |
Noise dominated data is calculated using 1-second bins in cleaned event files. If a bin has >2000 counts, and if more than 50% of those come from <1% of pixels, then it is considered to be noise-dominated and hence unusable.
| Quadrant | # 1 sec bins | Bins with >0 counts | Bins with >2000 counts | High rate bins dominated by noise | Noise dominated (total time) | Noise dominated (detector-on time) | Marked lightcurve |
|---|---|---|---|---|---|---|---|
| A | 7528 | 6274 | 2975 | 2975 | 39.52% | 47.42% | 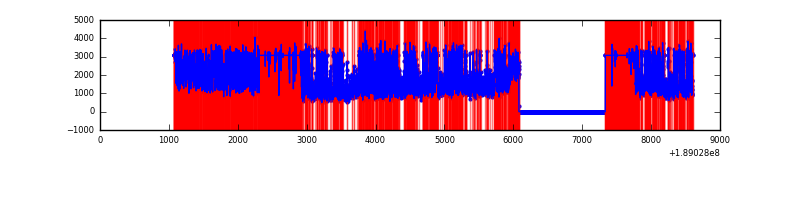 |
| B | 7529 | 6274 | 272 | 272 | 3.61% | 4.34% | 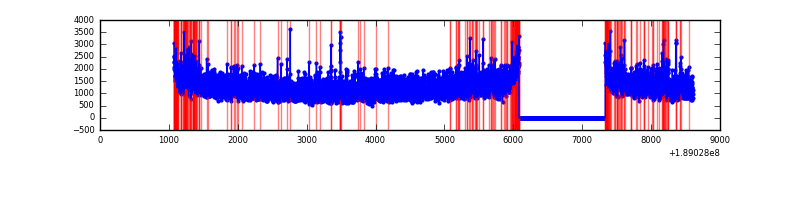 |
| C | 7529 | 6275 | 156 | 156 | 2.07% | 2.49% | 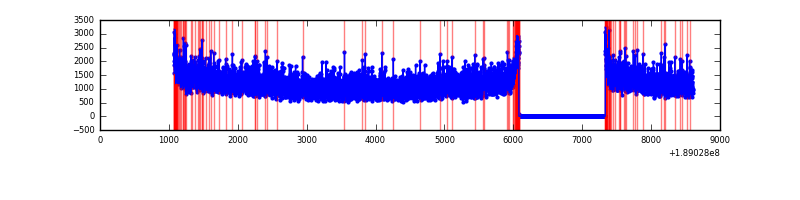 |
| D | 7529 | 6275 | 519 | 519 | 6.89% | 8.27% | 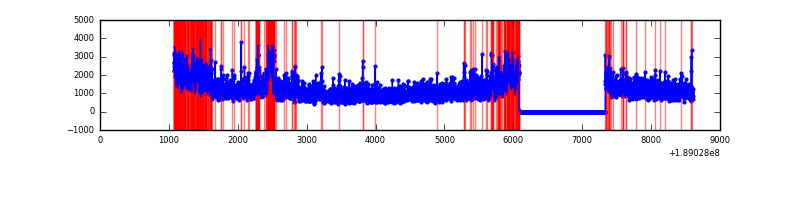 |
Top three noisy pixels from each quadrant. If the there are fewer than three noisy pixels in the level2.evt file, extra rows are filled as -1
| Pixel properties | Quadrant properties | ||||||
|---|---|---|---|---|---|---|---|
| Quadrant | DetID | PixID | Counts | Sigma | Mean | Median | Sigma |
| A | 15 | 127 | 6618849 | 17312.26 | 1599 | 1611 | 382.2 |
| A | 4 | 32 | 110545 | 285.0 | 1599 | 1611 | 382.2 |
| A | 15 | 233 | 78765 | 201.85 | 1599 | 1611 | 382.2 |
| B | 8 | 4 | 279775 | 600.35 | 1985 | 1990 | 462.7 |
| B | 12 | 52 | 89072 | 188.2 | 1985 | 1990 | 462.7 |
| B | 5 | 249 | 26929 | 53.9 | 1985 | 1990 | 462.7 |
| C | 15 | 241 | 194870 | 386.81 | 1818 | 1883 | 498.9 |
| C | 3 | 111 | 19195 | 34.7 | 1818 | 1883 | 498.9 |
| C | 7 | 159 | 13592 | 23.47 | 1818 | 1883 | 498.9 |
| D | 9 | 53 | 523472 | 987.0 | 1733 | 1791 | 528.6 |
| D | 12 | 22 | 469313 | 884.53 | 1733 | 1791 | 528.6 |
| D | 13 | 73 | 58415 | 107.13 | 1733 | 1791 | 528.6 |
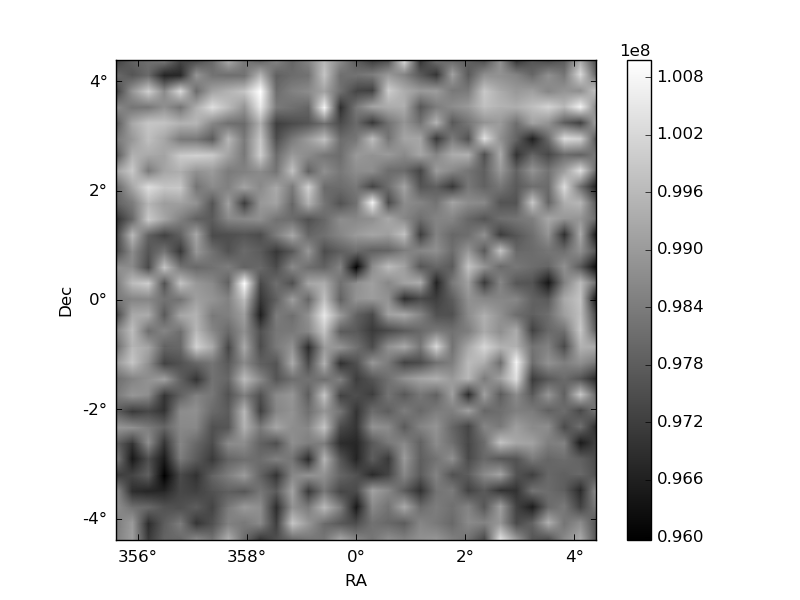
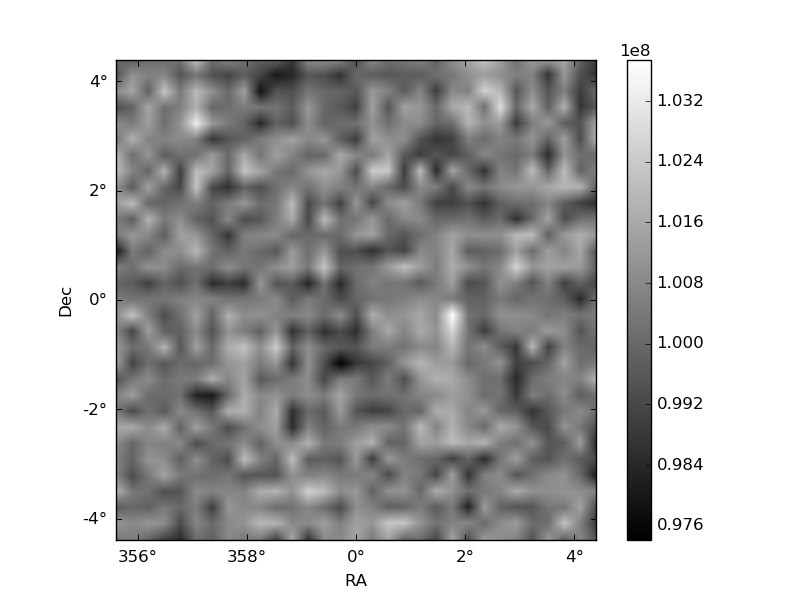
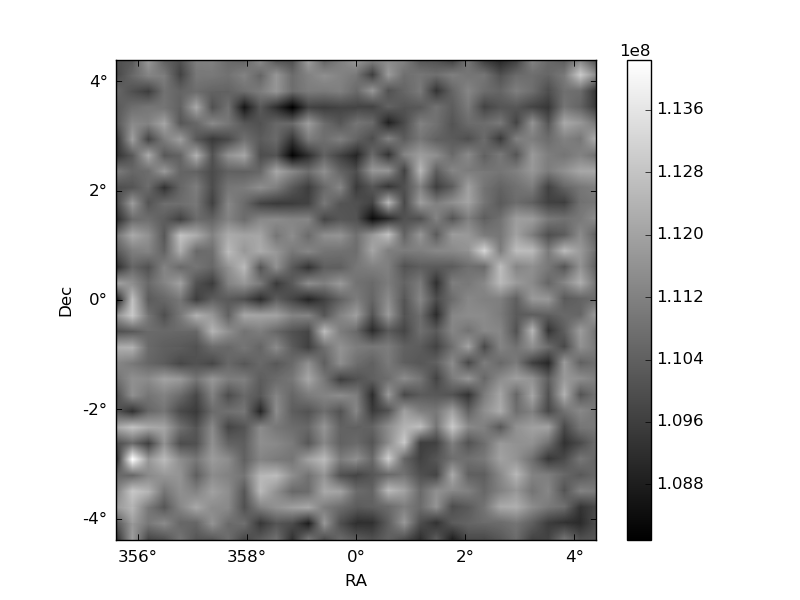
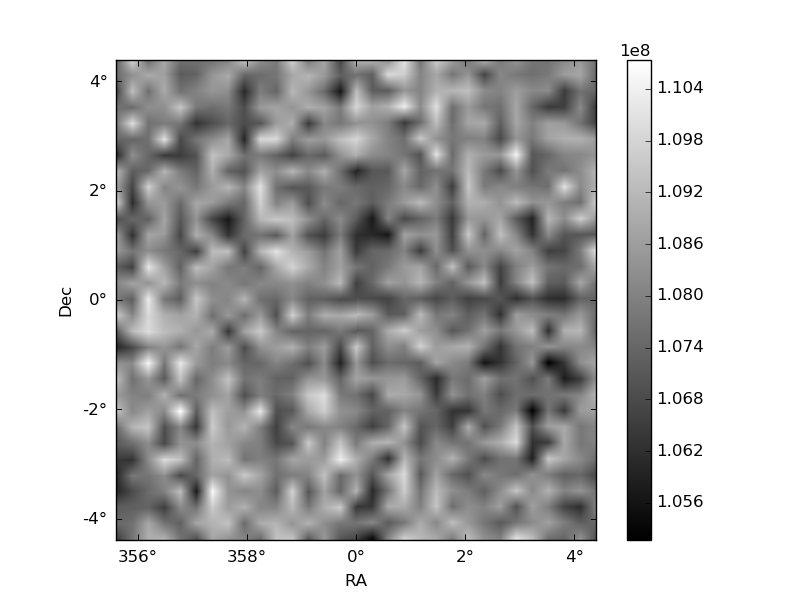
Histogram calculated using DETX and DETY for each event in the final _common_clean file
| Quadrant A | 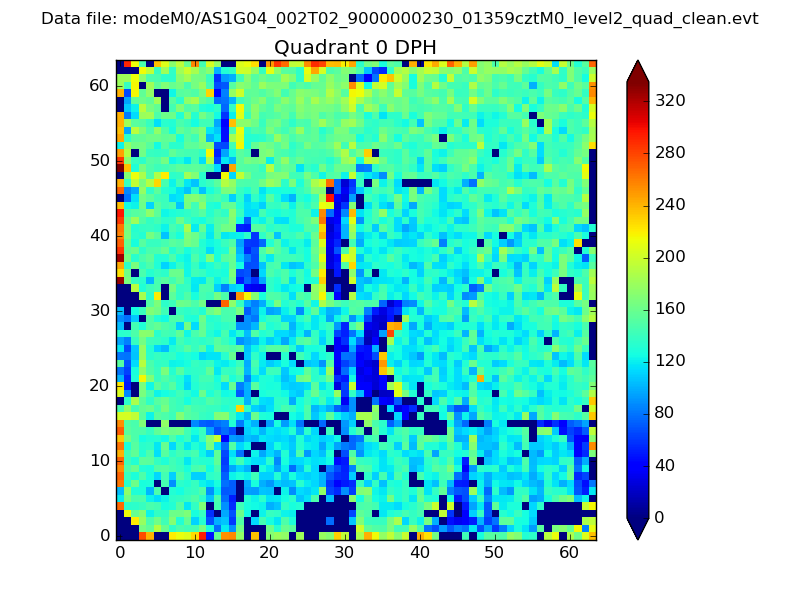 |
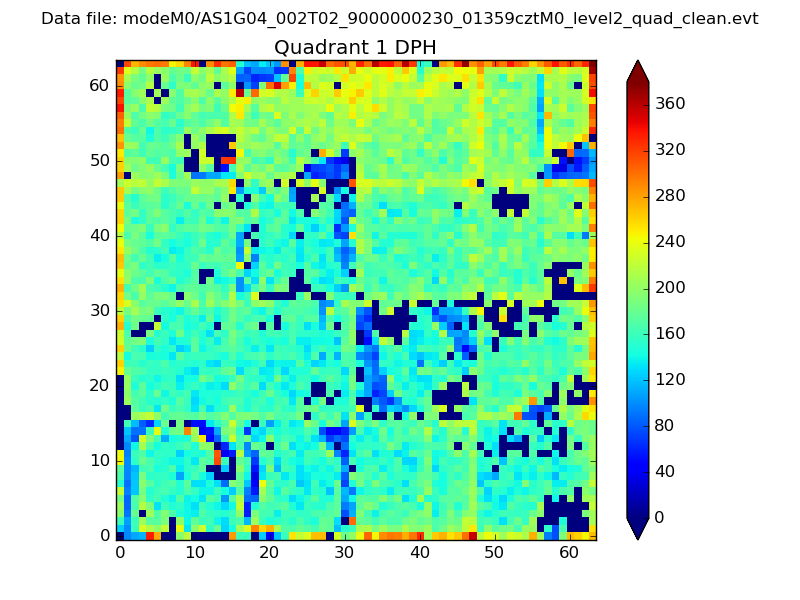 |
Quadrant B |
|---|---|---|---|
| Quadrant D | 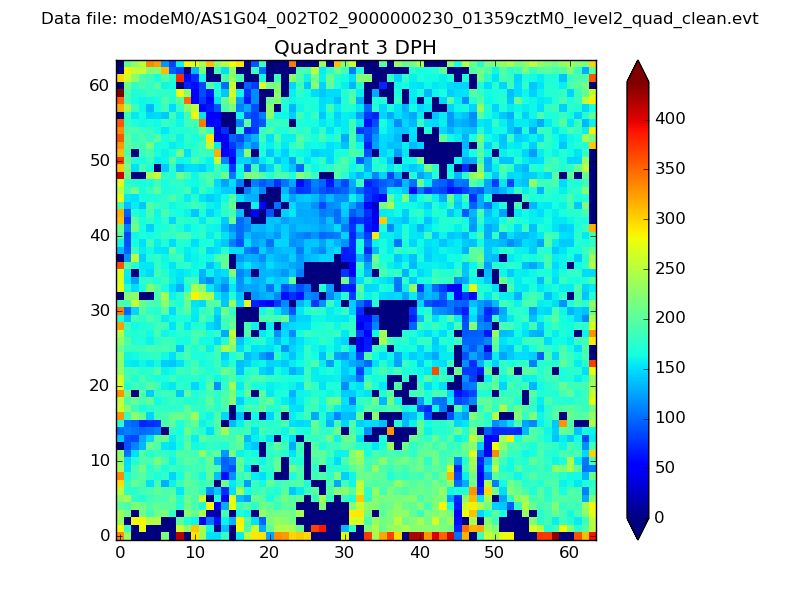 |
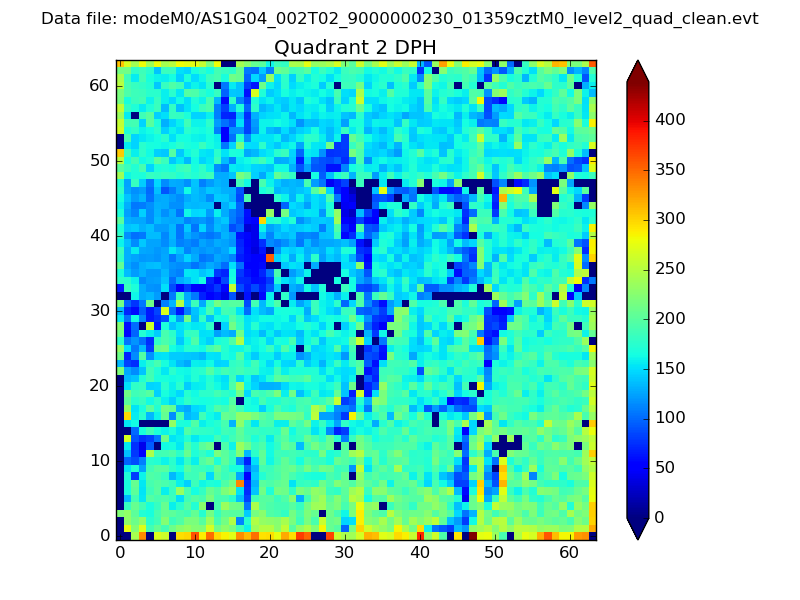 |
Quadrant C |
| Plot type | Count rate plots | Images |
|---|---|---|
| Comparison with Poisson distribution Blue bars denote a histogram of data divided into 1 sec bins. Red curve is a Poisson curve with rate = median count rate of data. |
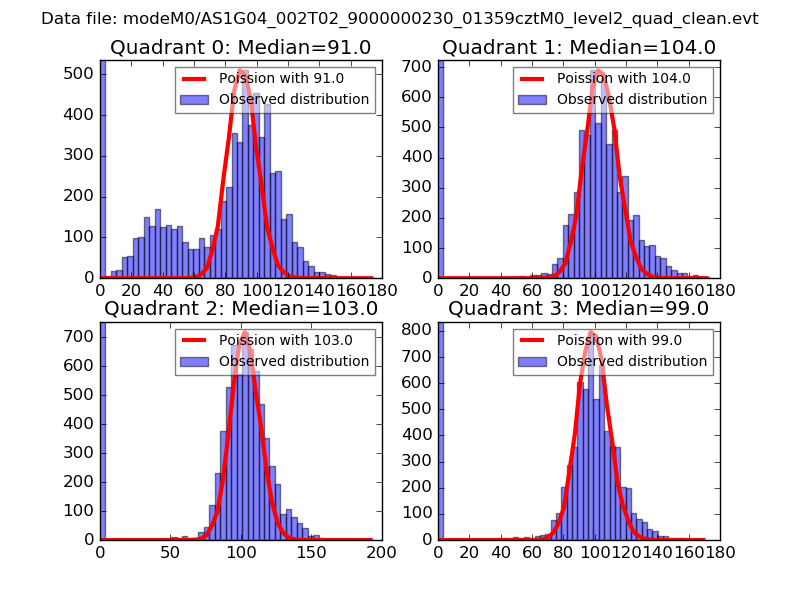 |
 |
| Quadrant-wise count rates Data is divided into 100 sec bins |
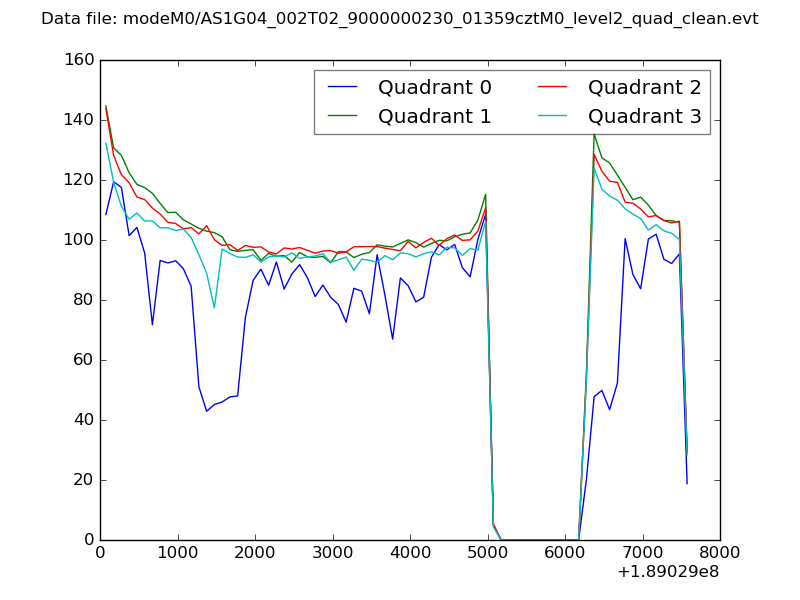 |
|
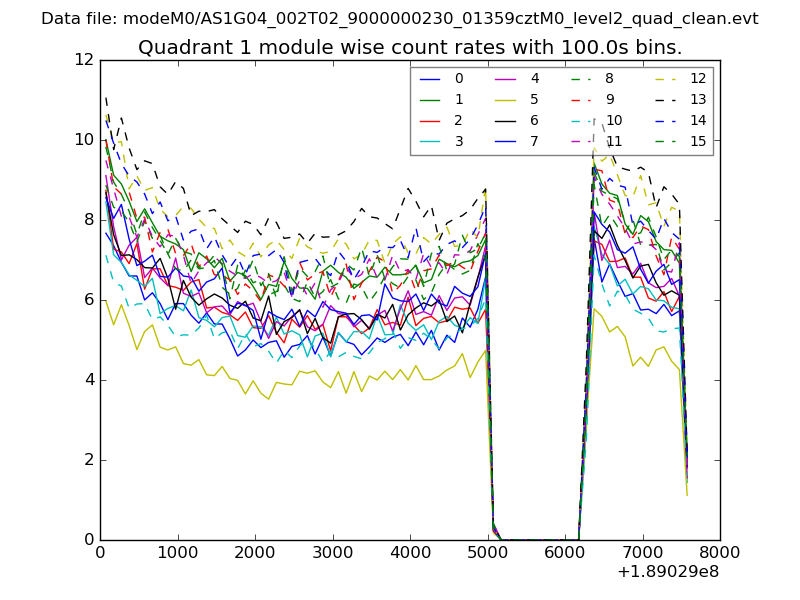
| Module-wise count rates for Quadrant A Data is divided into 100 sec bins |
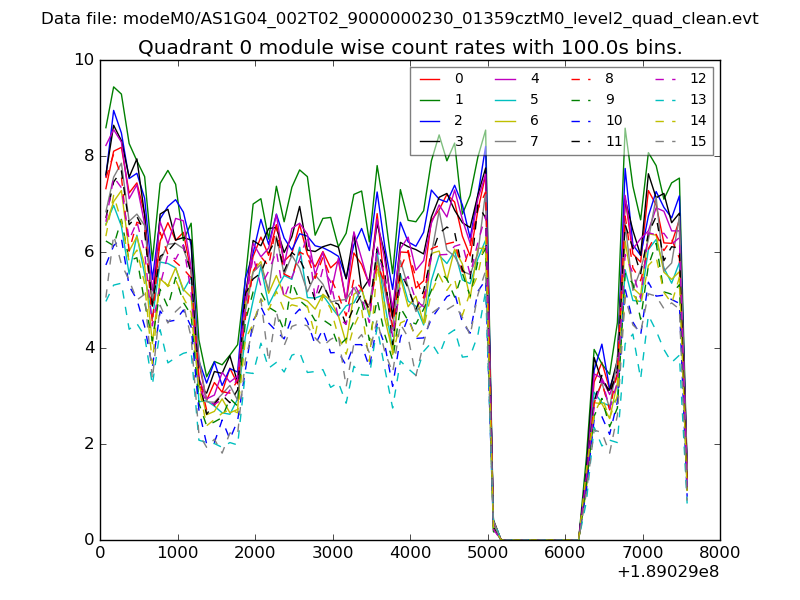 |
 |
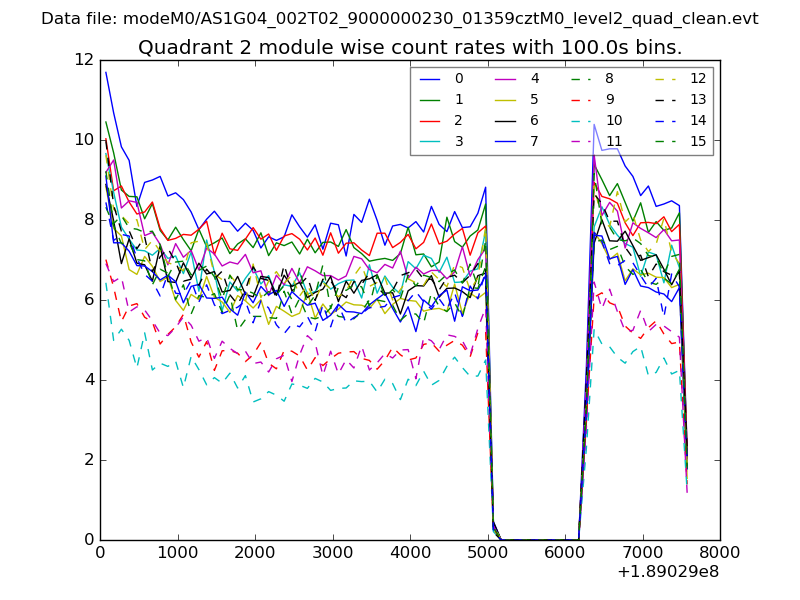
| Module-wise count rates for Quadrant B Data is divided into 100 sec bins |
 |
 |
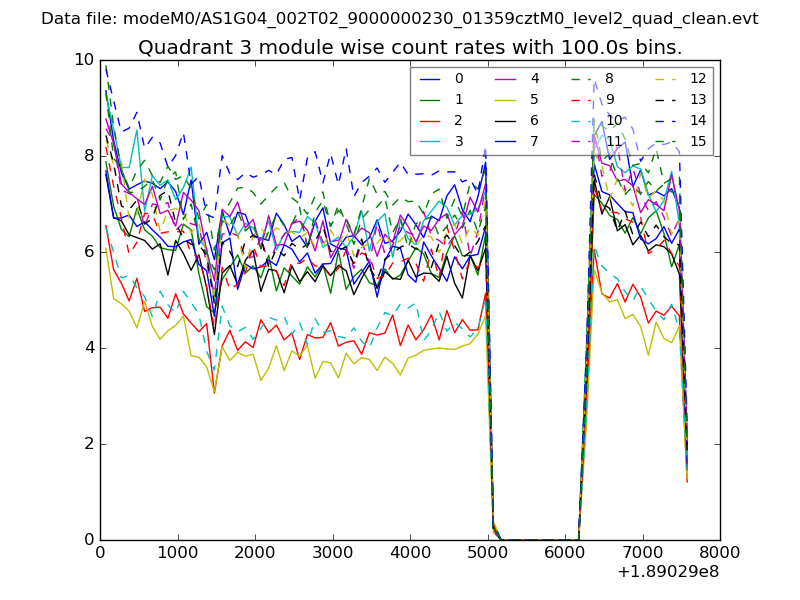
| Module-wise count rates for Quadrant C Data is divided into 100 sec bins |
 |
 |
| Module-wise count rates for Quadrant D Data is divided into 100 sec bins |
 |
 |
| Parameter | Plot |
|---|---|
| CZT HV Monitor | 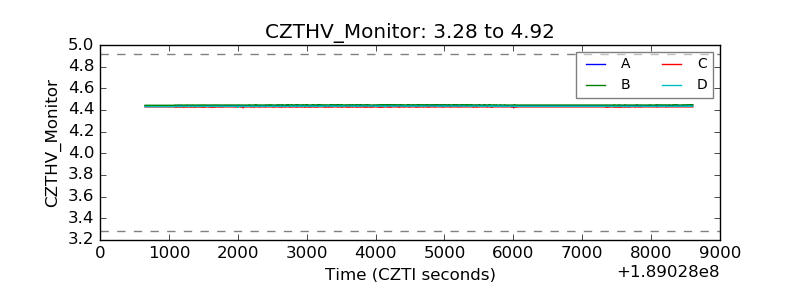 |
| D_VDD |  |
| Temperature 1 | 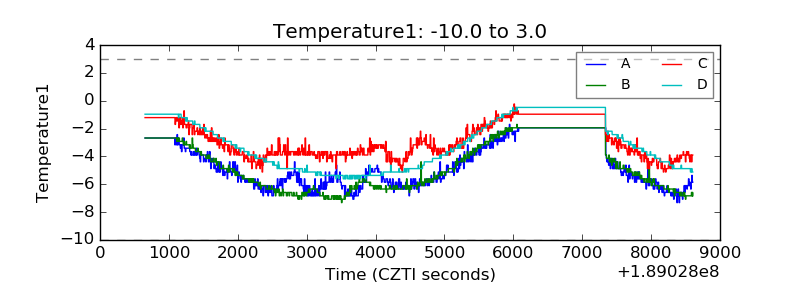 |
| Veto HV Monitor | 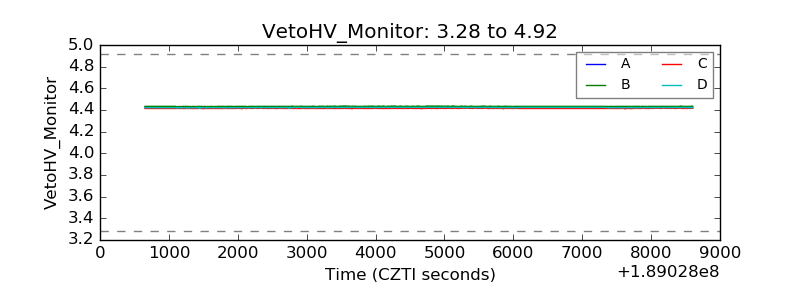 |
| Veto LLD | 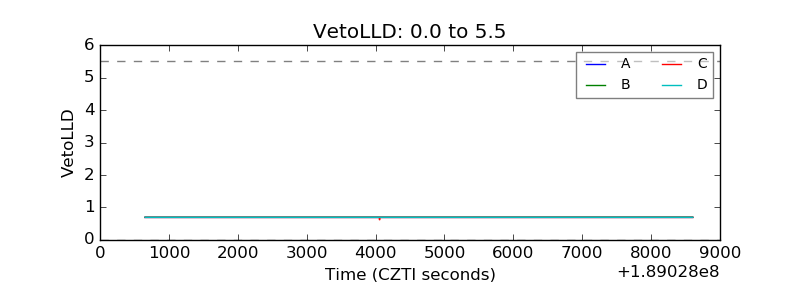 |
| Alpha Counter | 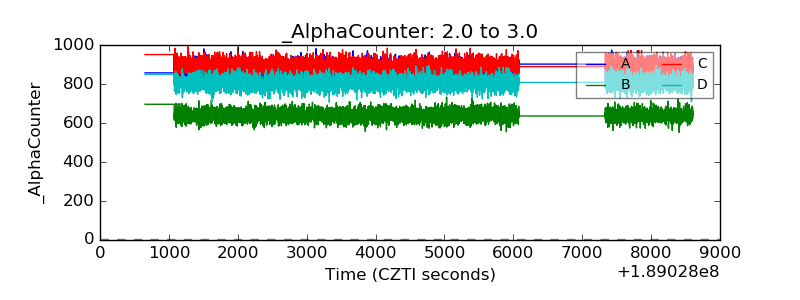 |
| _CPM_Rate | 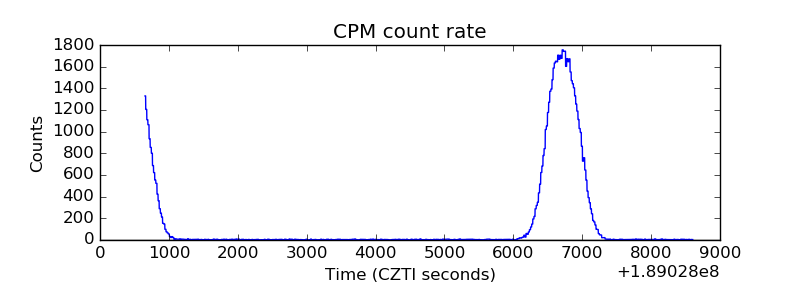 |
| CZT Counter | 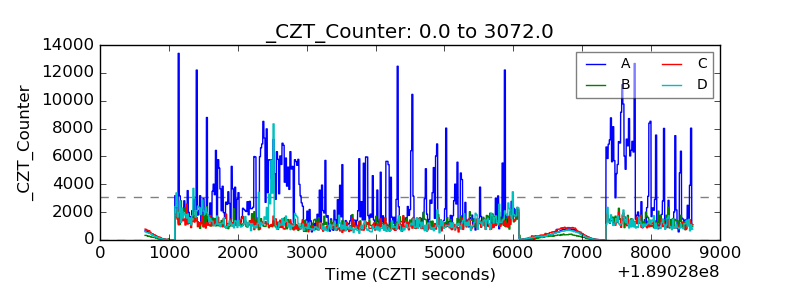 |
| +2.5 Volts monitor |  |
| +5 Volts monitor |  |
| _ROLL_ROT | 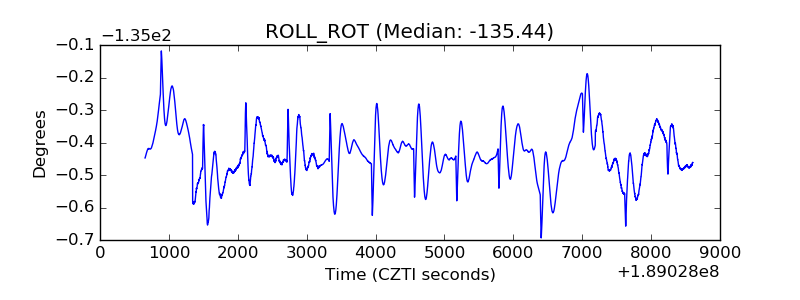 |
| _Roll_DEC | 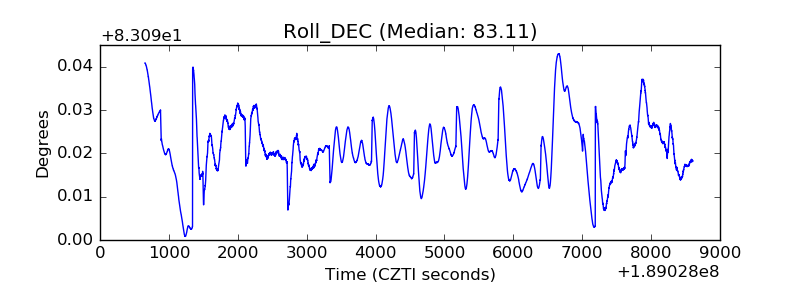 |
| _Roll_RA | 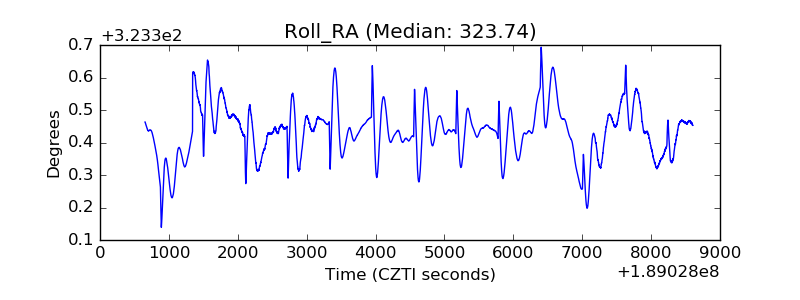 |
| Veto Counter | 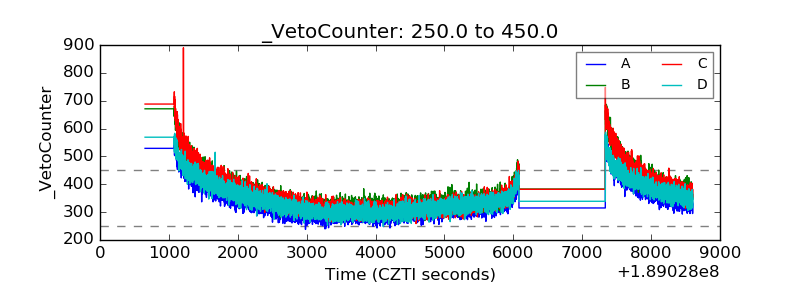 |