| Param | Original file | Final file |
|---|---|---|
| Filename | modeM0/AS1G04_002T02_9000000230_01360cztM0_level2.evt | modeM0/AS1G04_002T02_9000000230_01360cztM0_level2_quad_clean.evt |
| Size (bytes) | 1,082,652,480 | 92,842,560 |
| Size | 1.0 GB | 88.5 MB |
| Events in quadrant A | 11,268,622 | 531,467 |
| Events in quadrant B | 7,912,863 | 630,668 |
| Events in quadrant C | 6,904,997 | 623,428 |
| Events in quadrant D | 6,303,267 | 605,210 |
| Mode M9 | |||
|---|---|---|---|
| Quadrant | BADHDUFLAG | Total packets | Discarded packets |
| A | 0 | 13 | 0 |
| B | 0 | 13 | 0 |
| C | 0 | 13 | 0 |
| D | 0 | 13 | 0 |
| Mode M0 | |||
|---|---|---|---|
| Quadrant | BADHDUFLAG | Total packets | Discarded packets |
| A | 0 | 37971 | 2 |
| B | 0 | 27780 | 1 |
| C | 0 | 24803 | 1 |
| D | 0 | 23064 | 1 |
| Mode SS | |||
|---|---|---|---|
| Quadrant | BADHDUFLAG | Total packets | Discarded packets |
| A | 0 | 122 | 0 |
| B | 0 | 122 | 0 |
| C | 0 | 122 | 0 |
| D | 0 | 122 | 0 |
| Quadrant | Total seconds | Saturated seconds | Saturation percentage |
|---|---|---|---|
| A | 6018 | 1414 | 23.496178% |
| B | 6018 | 65 | 1.080093% |
| C | 6018 | 8 | 0.132935% |
| D | 6018 | 7 | 0.116318% |
Noise dominated data is calculated using 1-second bins in cleaned event files. If a bin has >2000 counts, and if more than 50% of those come from <1% of pixels, then it is considered to be noise-dominated and hence unusable.
| Quadrant | # 1 sec bins | Bins with >0 counts | Bins with >2000 counts | High rate bins dominated by noise | Noise dominated (total time) | Noise dominated (detector-on time) | Marked lightcurve |
|---|---|---|---|---|---|---|---|
| A | 7323 | 6019 | 2182 | 2182 | 29.80% | 36.25% | 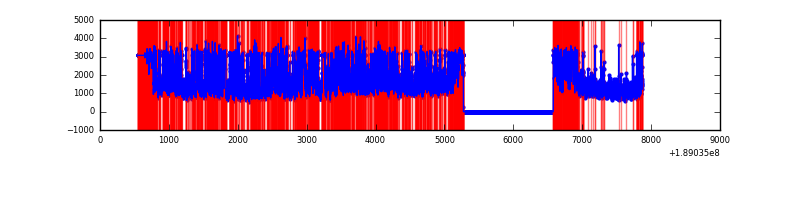 |
| B | 7323 | 6019 | 396 | 396 | 5.41% | 6.58% | 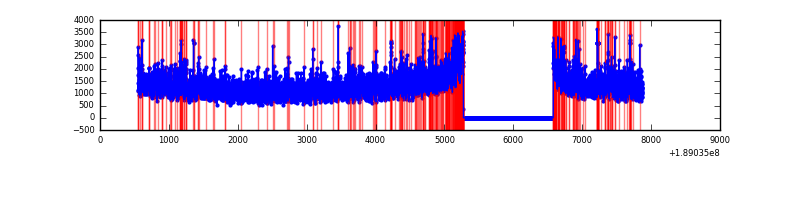 |
| C | 7323 | 6019 | 123 | 123 | 1.68% | 2.04% | 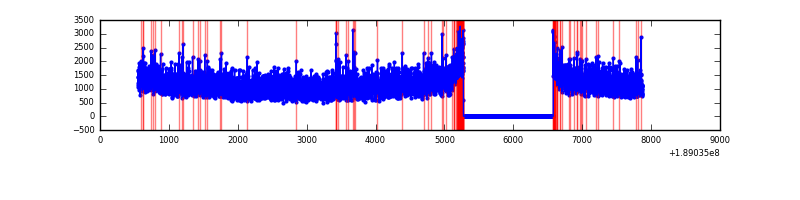 |
| D | 7323 | 6019 | 97 | 97 | 1.32% | 1.61% | 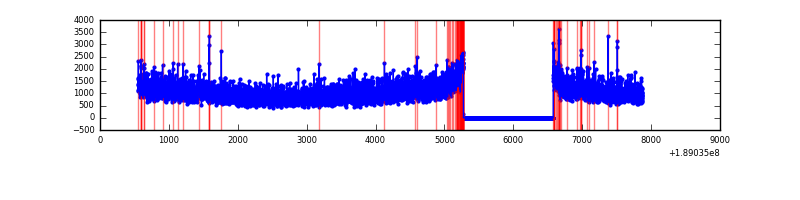 |
Top three noisy pixels from each quadrant. If the there are fewer than three noisy pixels in the level2.evt file, extra rows are filled as -1
| Pixel properties | Quadrant properties | ||||||
|---|---|---|---|---|---|---|---|
| Quadrant | DetID | PixID | Counts | Sigma | Mean | Median | Sigma |
| A | 15 | 127 | 4772763 | 12565.19 | 1592 | 1605 | 379.7 |
| A | 4 | 32 | 197253 | 515.25 | 1592 | 1605 | 379.7 |
| A | 15 | 233 | 131510 | 342.11 | 1592 | 1605 | 379.7 |
| B | 8 | 4 | 373996 | 856.93 | 1872 | 1878 | 434.2 |
| B | 12 | 52 | 128398 | 291.36 | 1872 | 1878 | 434.2 |
| B | 5 | 191 | 95901 | 216.52 | 1872 | 1878 | 434.2 |
| C | 15 | 241 | 193026 | 407.82 | 1705 | 1762 | 469.0 |
| C | 3 | 111 | 17354 | 33.25 | 1705 | 1762 | 469.0 |
| C | 8 | 208 | 13746 | 25.55 | 1705 | 1762 | 469.0 |
| D | 10 | 125 | 60045 | 116.48 | 1619 | 1673 | 501.1 |
| D | 12 | 22 | 56749 | 109.9 | 1619 | 1673 | 501.1 |
| D | 9 | 53 | 54064 | 104.55 | 1619 | 1673 | 501.1 |
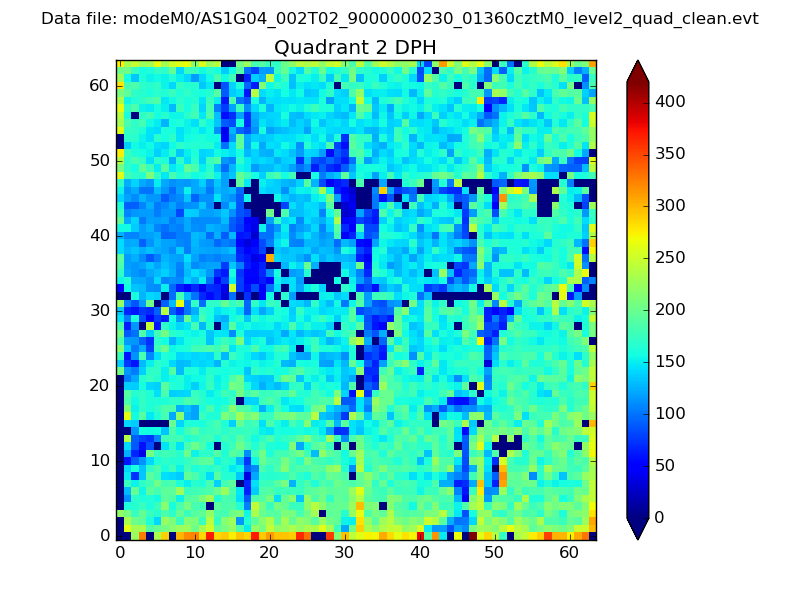
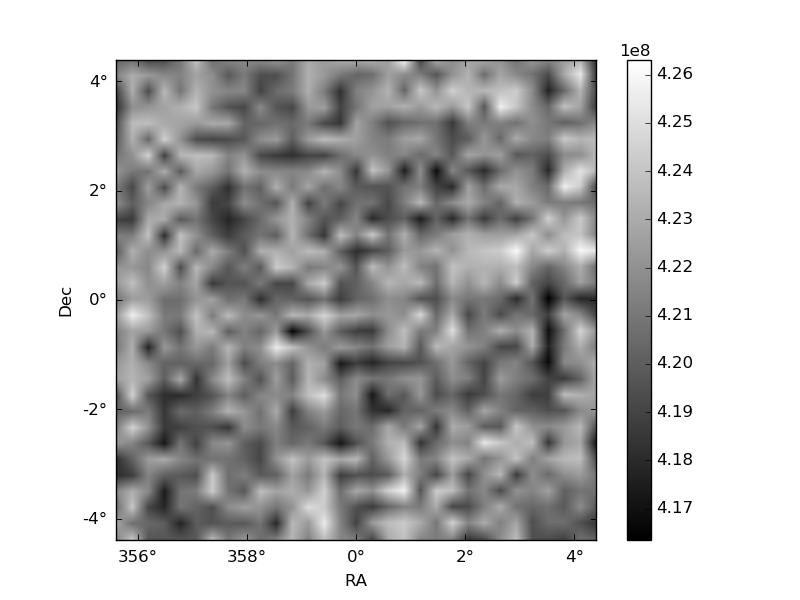
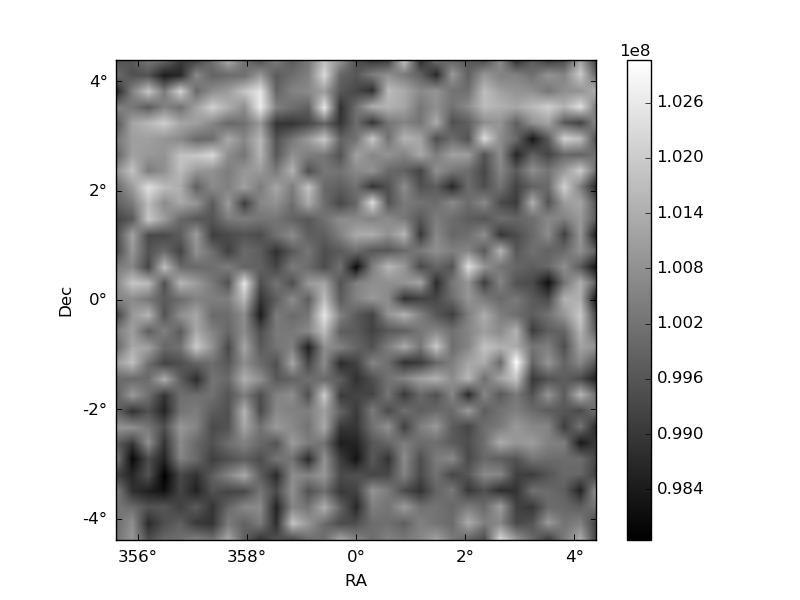
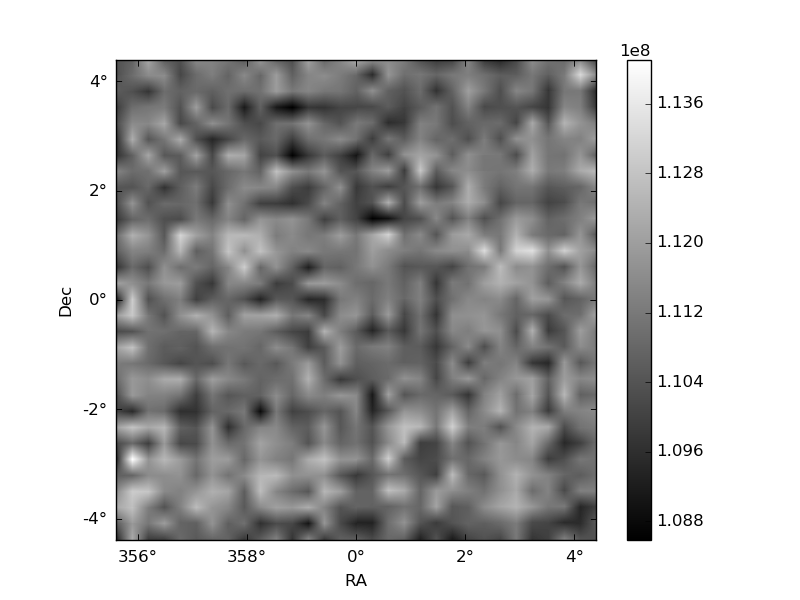
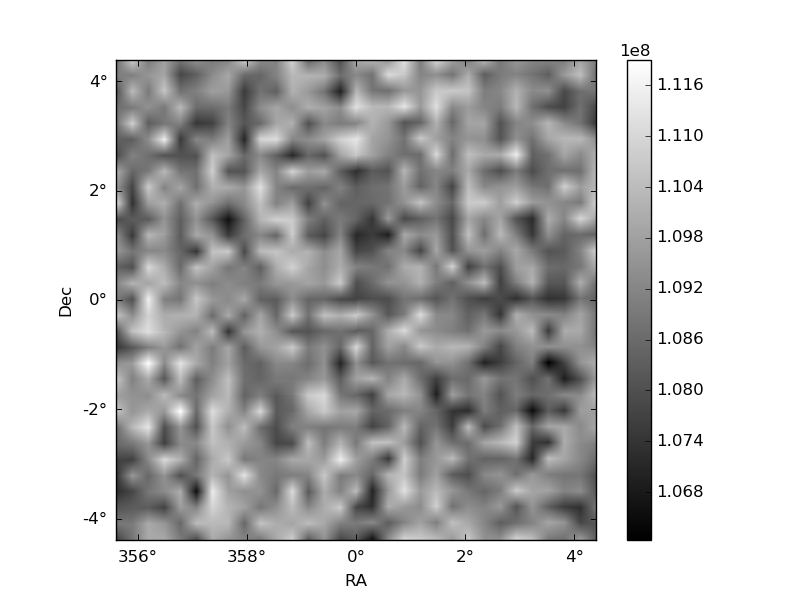
Histogram calculated using DETX and DETY for each event in the final _common_clean file
| Quadrant A | 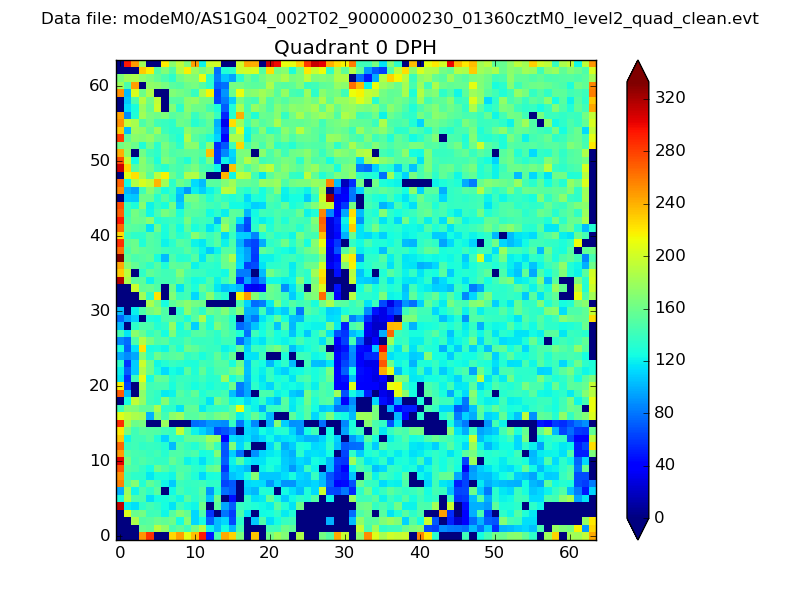 |
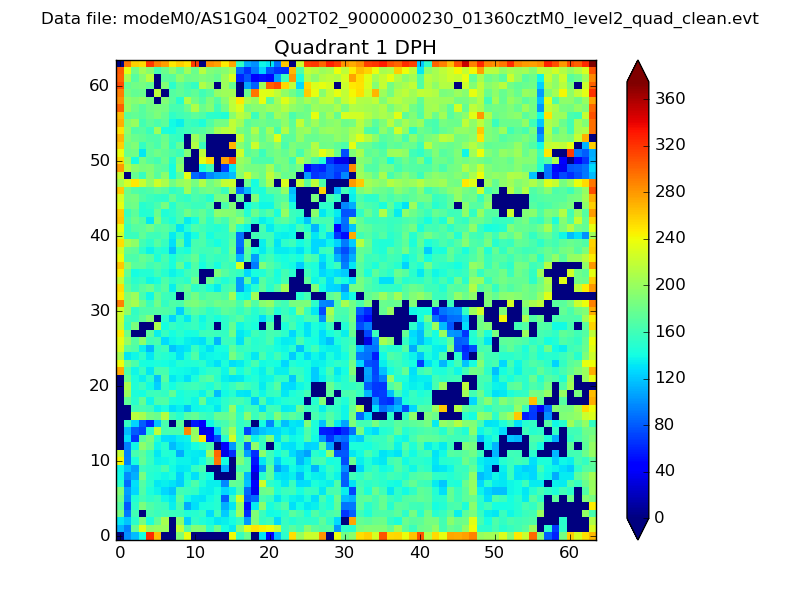 |
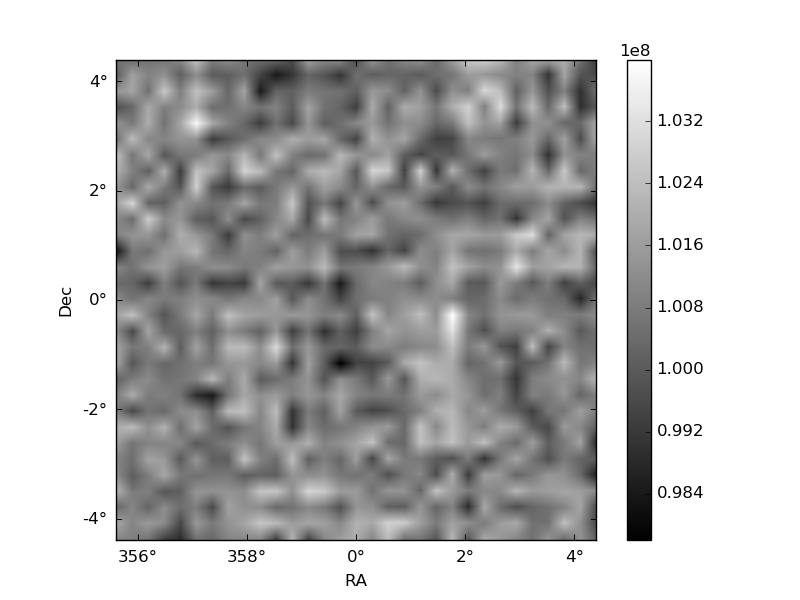
Quadrant B |
|---|---|---|---|
| Quadrant D | 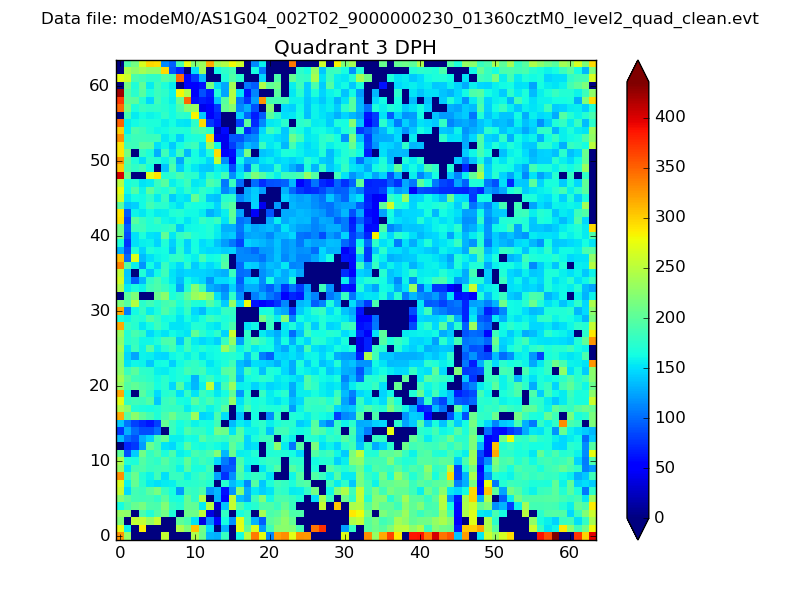 |
 |
Quadrant C |
| Plot type | Count rate plots | Images |
|---|---|---|
| Comparison with Poisson distribution Blue bars denote a histogram of data divided into 1 sec bins. Red curve is a Poisson curve with rate = median count rate of data. |
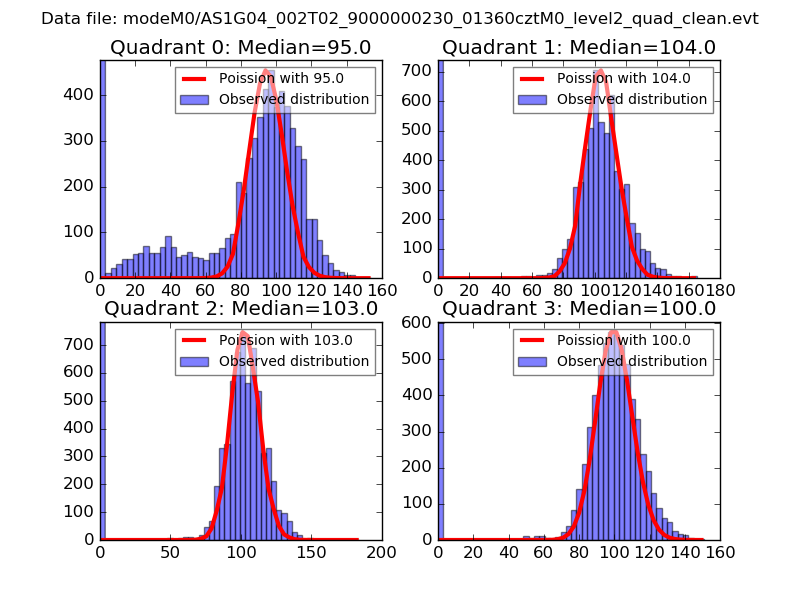 |
 |
| Quadrant-wise count rates Data is divided into 100 sec bins |
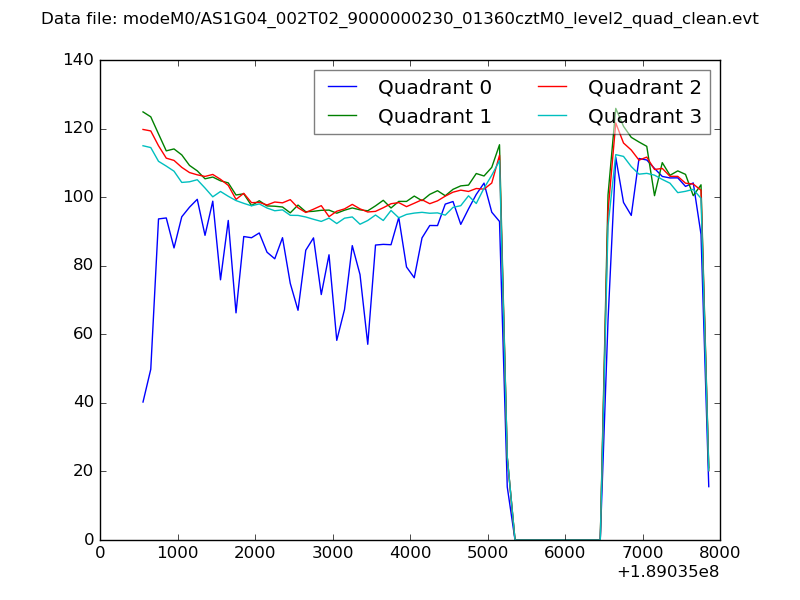 |
|
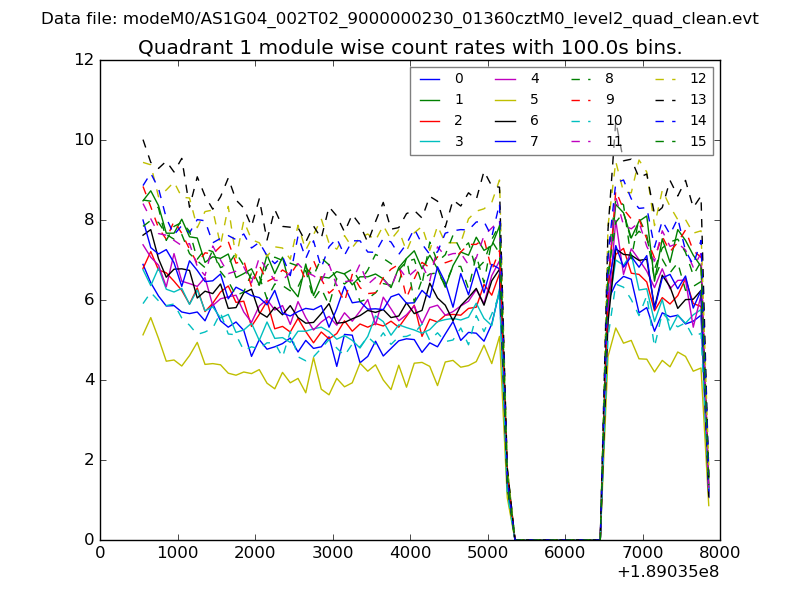
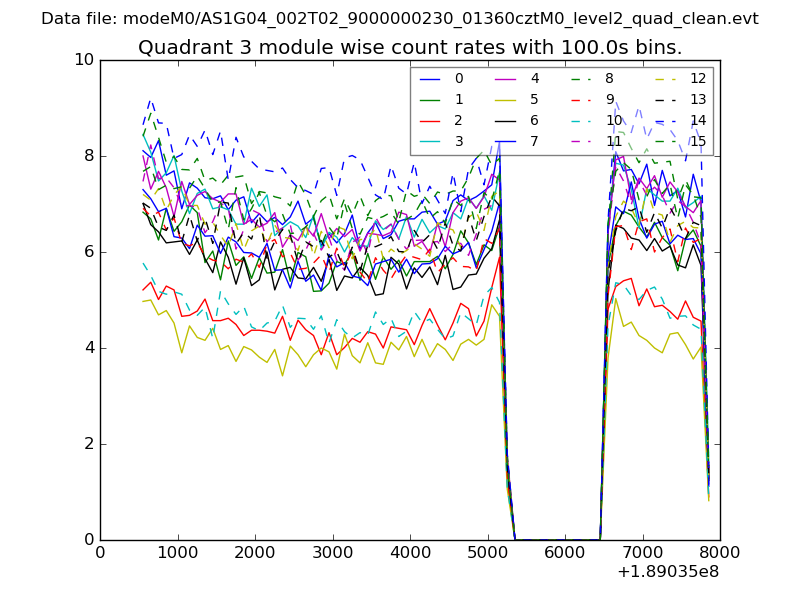
| Module-wise count rates for Quadrant A Data is divided into 100 sec bins |
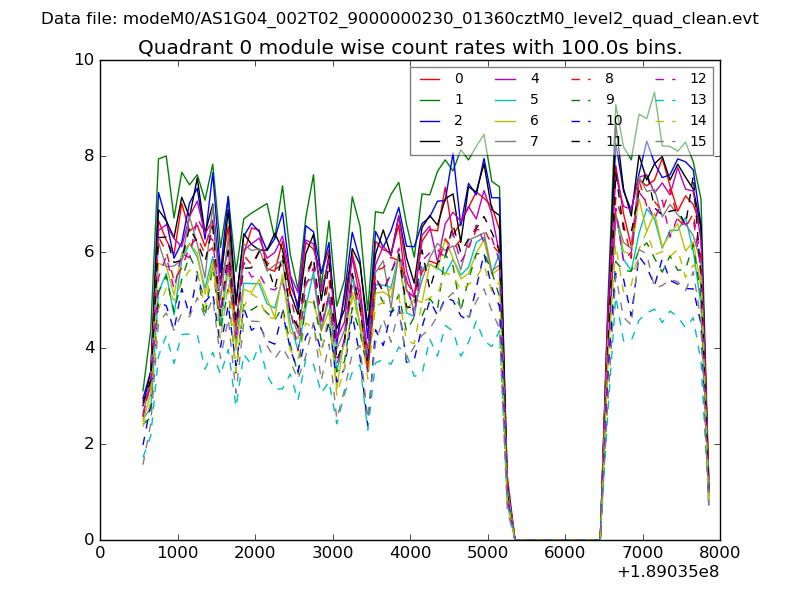 |
 |
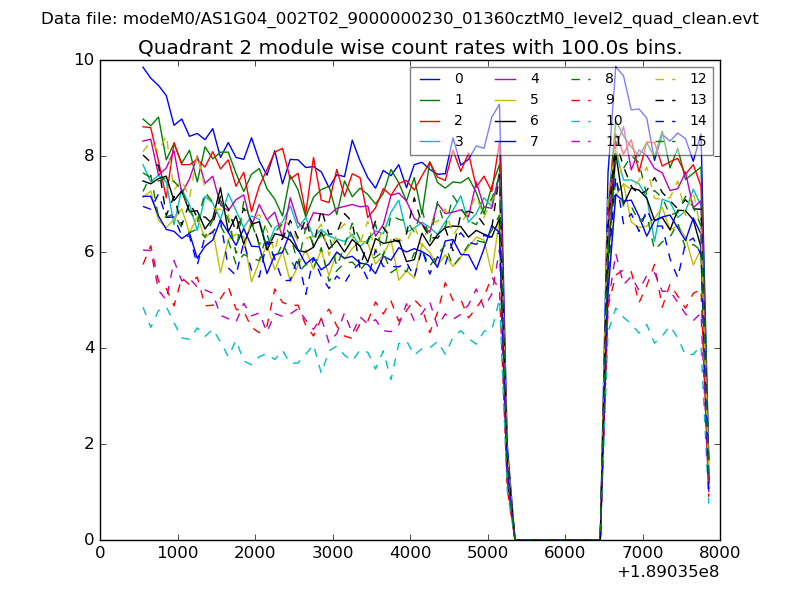
| Module-wise count rates for Quadrant B Data is divided into 100 sec bins |
 |
 |
| Module-wise count rates for Quadrant C Data is divided into 100 sec bins |
 |
 |
| Module-wise count rates for Quadrant D Data is divided into 100 sec bins |
 |
 |
| Parameter | Plot |
|---|---|
| CZT HV Monitor | 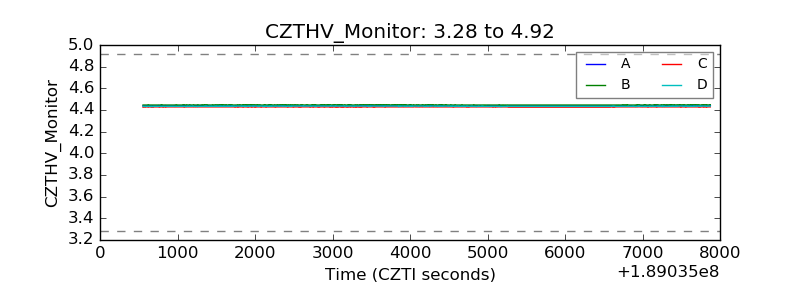 |
| D_VDD | 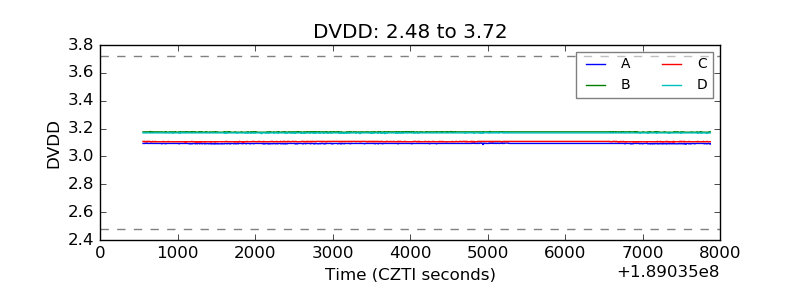 |
| Temperature 1 | 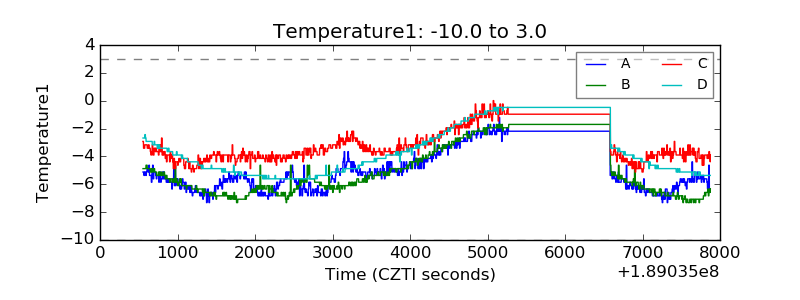 |
| Veto HV Monitor | 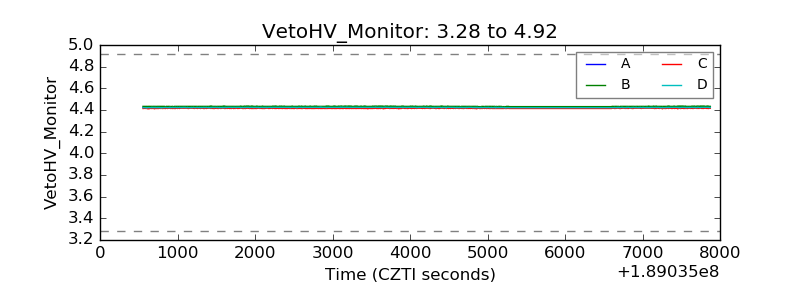 |
| Veto LLD | 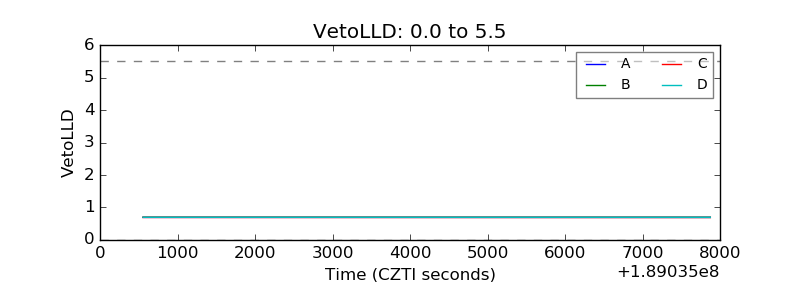 |
| Alpha Counter | 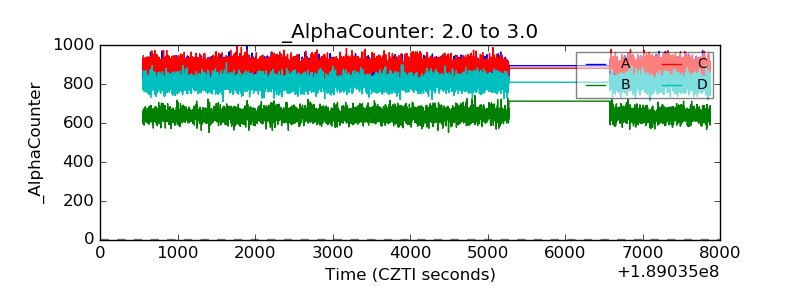 |
| _CPM_Rate | 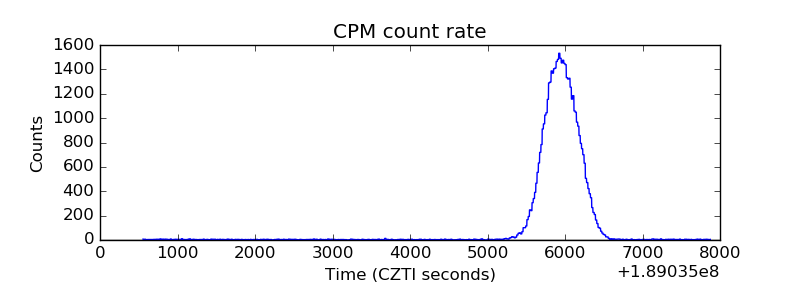 |
| CZT Counter | 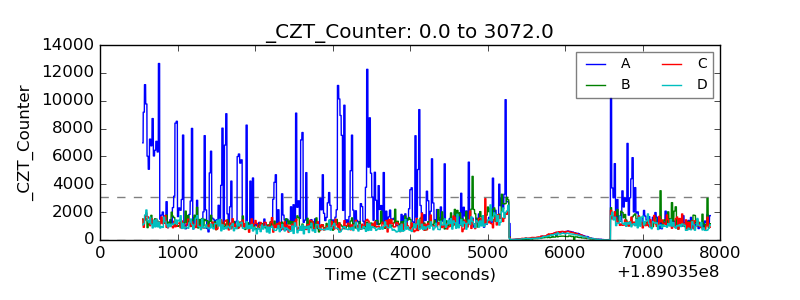 |
| +2.5 Volts monitor | 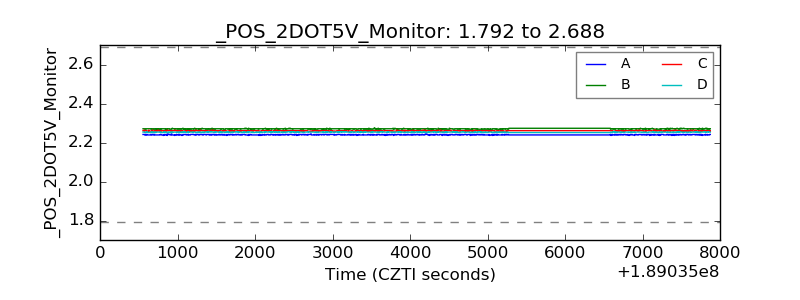 |
| +5 Volts monitor | 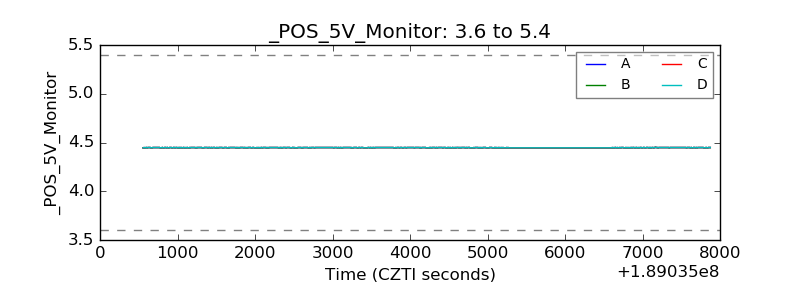 |
| _ROLL_ROT | 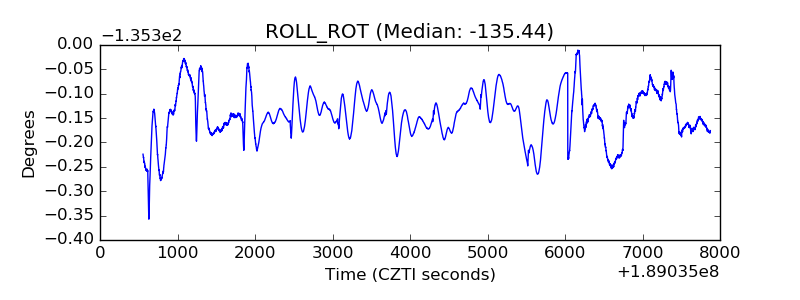 |
| _Roll_DEC | 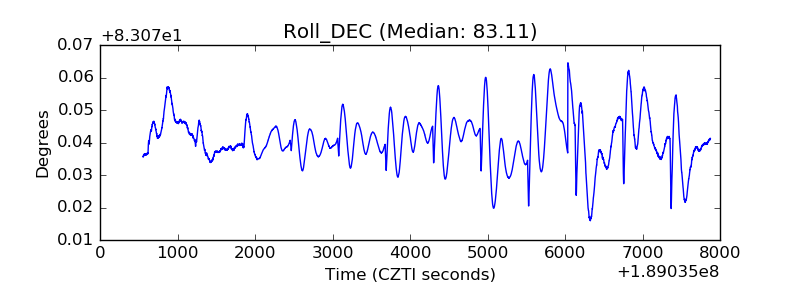 |
| _Roll_RA | 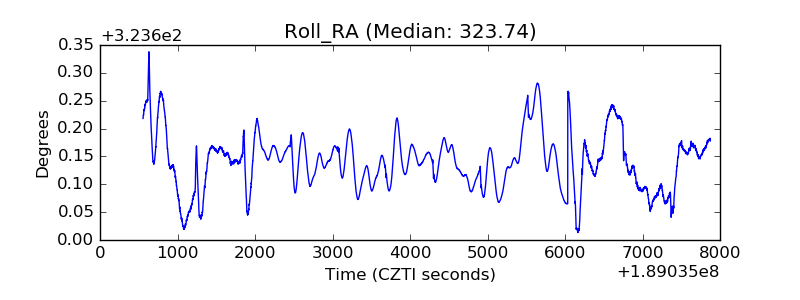 |
| Veto Counter | 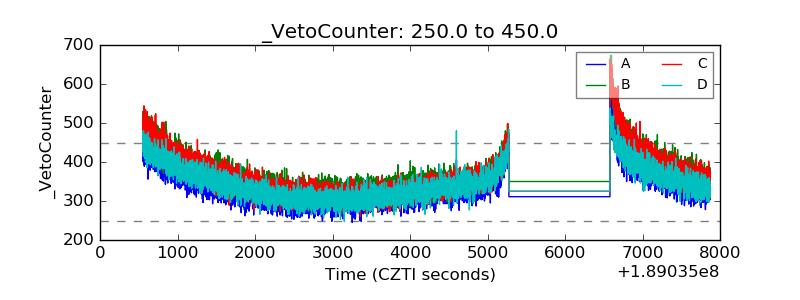 |