| Param | Original file | Final file |
|---|---|---|
| Filename | modeM0/AS1G04_014T02_9000000232_01362cztM0_level2.evt | modeM0/AS1G04_014T02_9000000232_01362cztM0_level2_quad_clean.evt |
| Size (bytes) | 247,011,840 | 24,148,800 |
| Size | 235.6 MB | 23.0 MB |
| Events in quadrant A | 1,780,021 | 154,487 |
| Events in quadrant B | 2,251,979 | 154,763 |
| Events in quadrant C | 1,788,258 | 155,032 |
| Events in quadrant D | 1,553,562 | 150,637 |
| Mode SS | |||
|---|---|---|---|
| Quadrant | BADHDUFLAG | Total packets | Discarded packets |
| A | 0 | 32 | 0 |
| B | 0 | 32 | 0 |
| C | 0 | 32 | 0 |
| D | 0 | 32 | 0 |
| Mode M0 | |||
|---|---|---|---|
| Quadrant | BADHDUFLAG | Total packets | Discarded packets |
| A | 0 | 6411 | 2 |
| B | 0 | 7807 | 1 |
| C | 0 | 6446 | 1 |
| D | 0 | 5747 | 1 |
| Mode M9 | |||
|---|---|---|---|
| Quadrant | BADHDUFLAG | Total packets | Discarded packets |
| A | 0 | 1 | 0 |
| B | 0 | 1 | 0 |
| C | 0 | 1 | 0 |
| D | 0 | 1 | 0 |
| Quadrant | Total seconds | Saturated seconds | Saturation percentage |
|---|---|---|---|
| A | 1565 | 1 | 0.063898% |
| B | 1565 | 30 | 1.916933% |
| C | 1565 | 1 | 0.063898% |
| D | 1565 | 2 | 0.127796% |
Noise dominated data is calculated using 1-second bins in cleaned event files. If a bin has >2000 counts, and if more than 50% of those come from <1% of pixels, then it is considered to be noise-dominated and hence unusable.
| Quadrant | # 1 sec bins | Bins with >0 counts | Bins with >2000 counts | High rate bins dominated by noise | Noise dominated (total time) | Noise dominated (detector-on time) | Marked lightcurve |
|---|---|---|---|---|---|---|---|
| A | 1565 | 1565 | 49 | 49 | 3.13% | 3.13% | 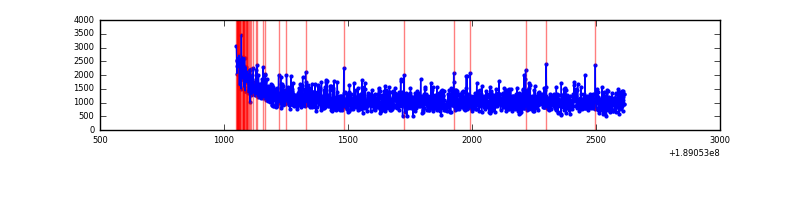 |
| B | 1565 | 1565 | 171 | 171 | 10.93% | 10.93% | 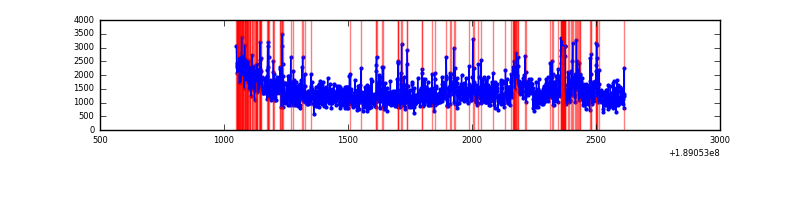 |
| C | 1565 | 1565 | 38 | 38 | 2.43% | 2.43% | 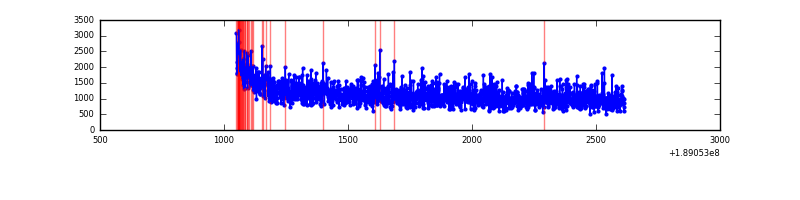 |
| D | 1565 | 1565 | 13 | 13 | 0.83% | 0.83% | 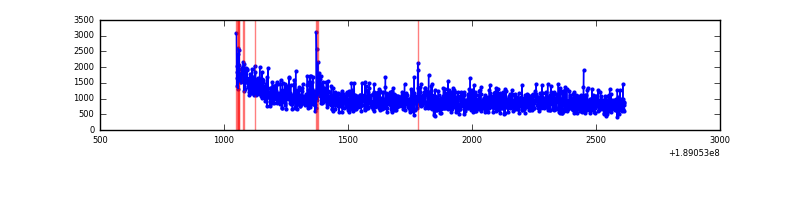 |
Top three noisy pixels from each quadrant. If the there are fewer than three noisy pixels in the level2.evt file, extra rows are filled as -1
| Pixel properties | Quadrant properties | ||||||
|---|---|---|---|---|---|---|---|
| Quadrant | DetID | PixID | Counts | Sigma | Mean | Median | Sigma |
| A | 4 | 32 | 6354 | 52.79 | 461 | 465 | 111.6 |
| A | 15 | 127 | 2715 | 20.17 | 461 | 465 | 111.6 |
| A | 13 | 235 | 2311 | 16.55 | 461 | 465 | 111.6 |
| B | 8 | 4 | 214978 | 1806.97 | 501 | 503 | 118.7 |
| B | 12 | 52 | 69776 | 583.63 | 501 | 503 | 118.7 |
| B | 4 | 222 | 29767 | 246.55 | 501 | 503 | 118.7 |
| C | 15 | 241 | 49224 | 390.67 | 441 | 456 | 124.8 |
| C | 10 | 19 | 7255 | 54.47 | 441 | 456 | 124.8 |
| C | 3 | 111 | 4000 | 28.39 | 441 | 456 | 124.8 |
| D | 12 | 22 | 13010 | 97.96 | 404 | 413 | 128.6 |
| D | 9 | 53 | 12419 | 93.36 | 404 | 413 | 128.6 |
| D | 5 | 234 | 5660 | 40.8 | 404 | 413 | 128.6 |
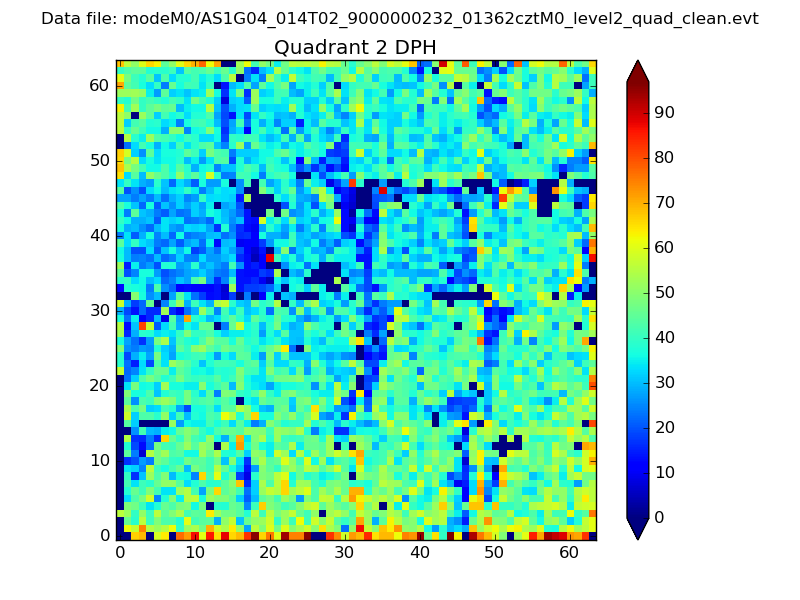
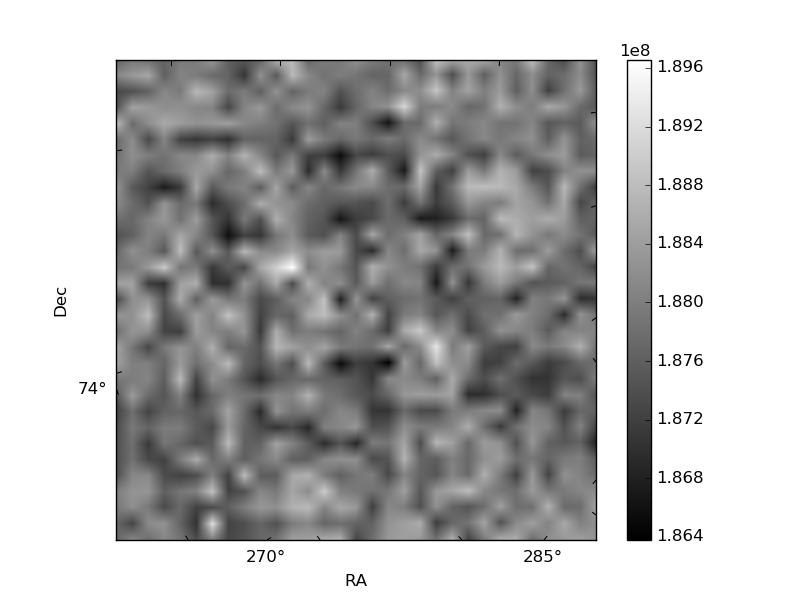
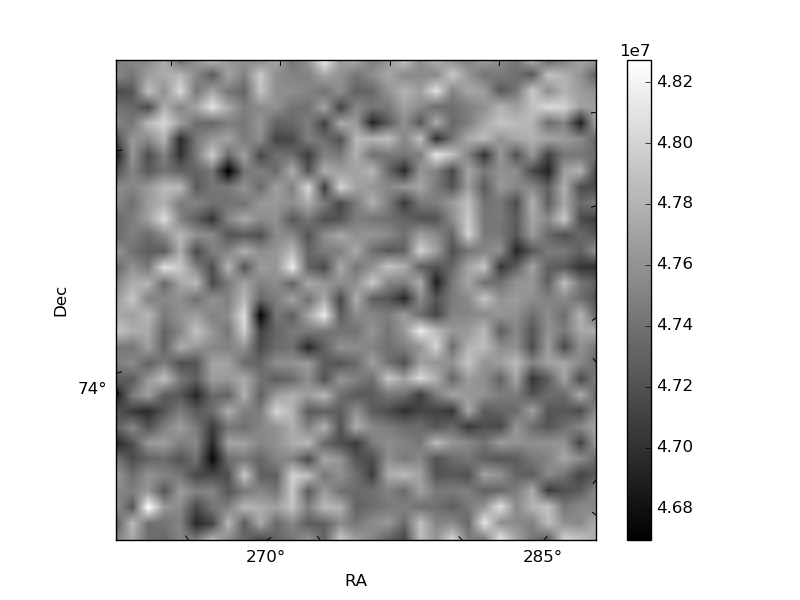
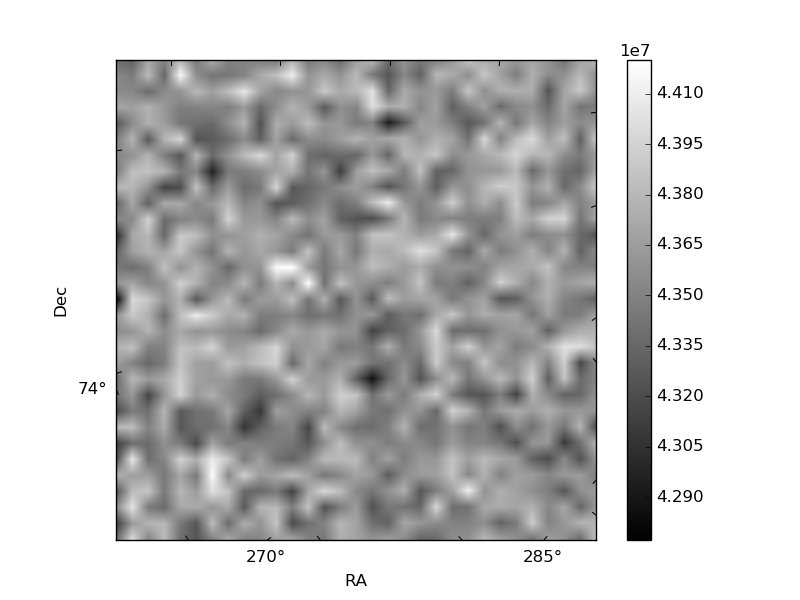
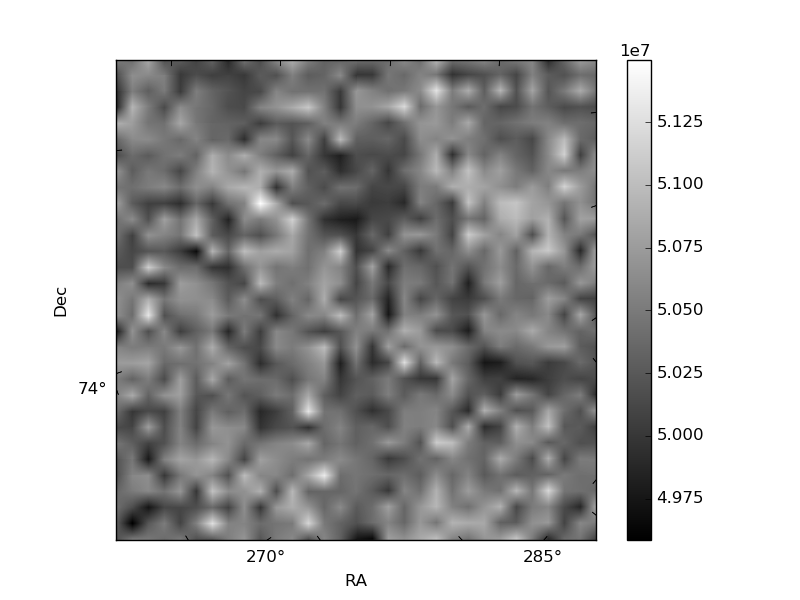
Histogram calculated using DETX and DETY for each event in the final _common_clean file
| Quadrant A | 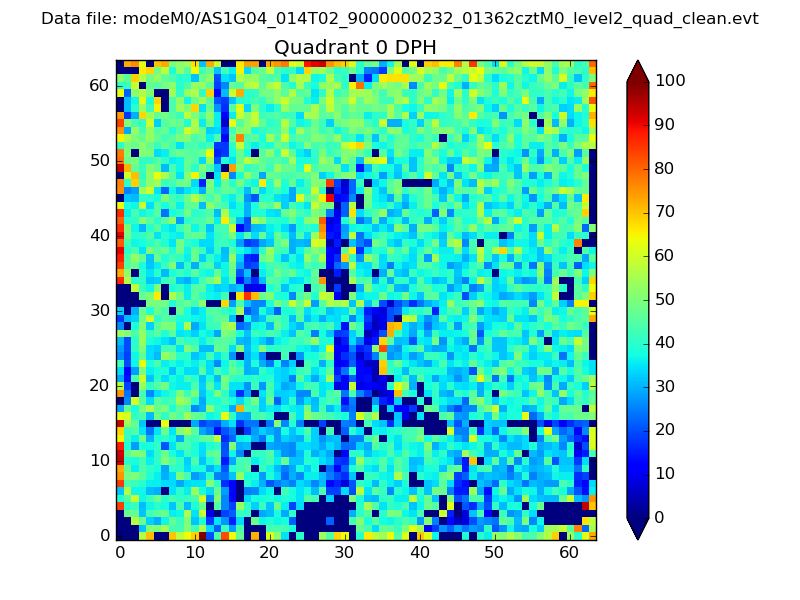 |
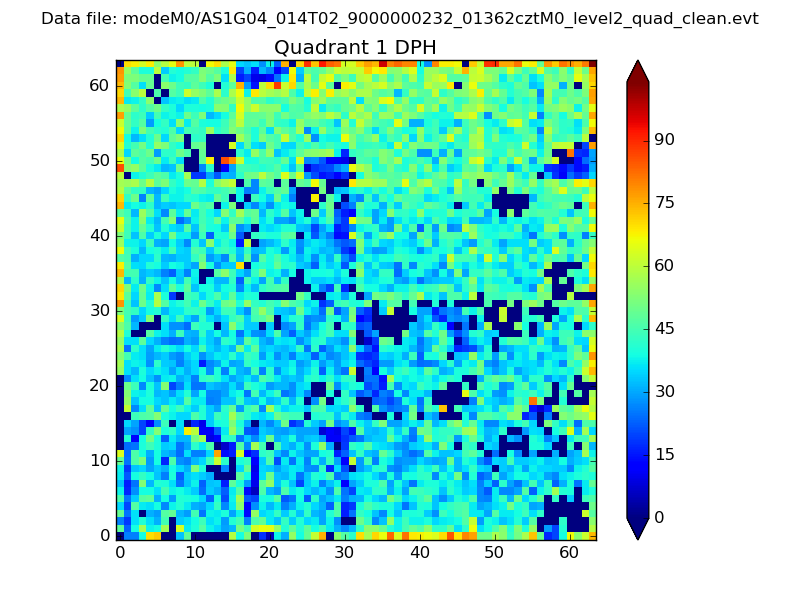 |
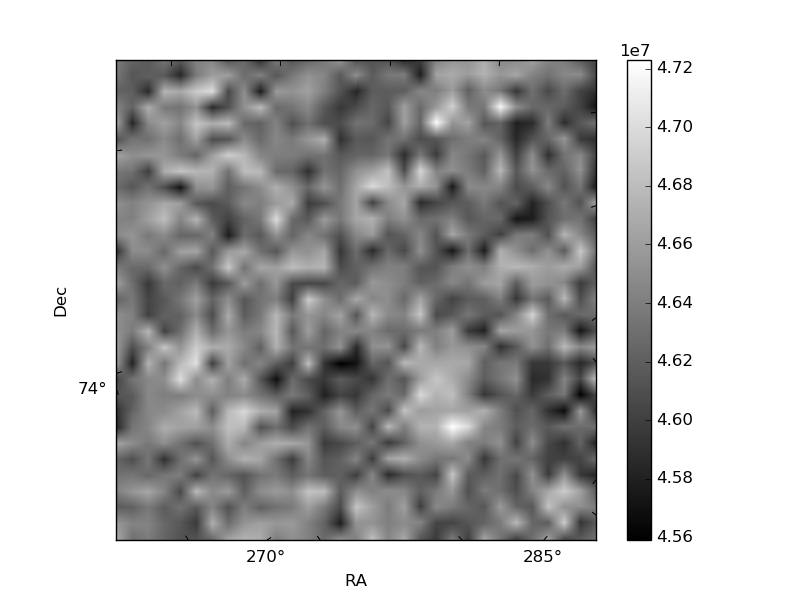
Quadrant B |
|---|---|---|---|
| Quadrant D | 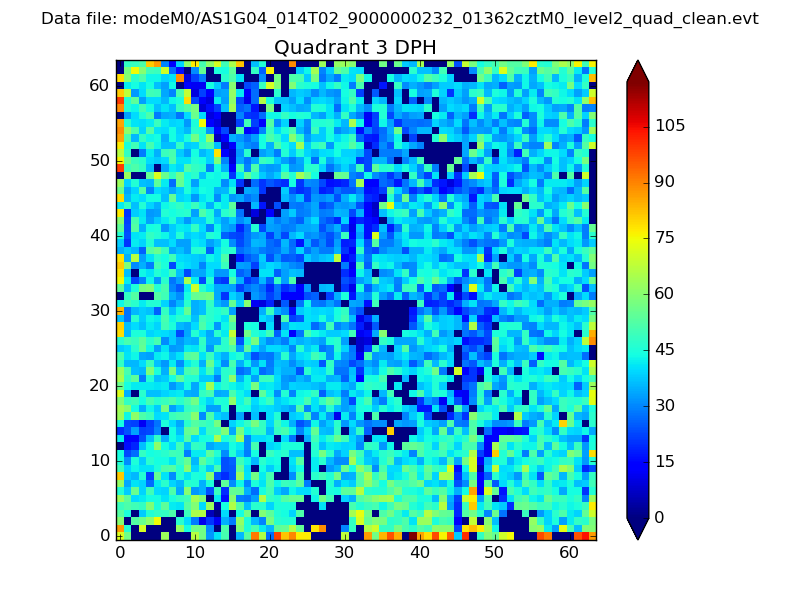 |
 |
Quadrant C |
| Plot type | Count rate plots | Images |
|---|---|---|
| Comparison with Poisson distribution Blue bars denote a histogram of data divided into 1 sec bins. Red curve is a Poisson curve with rate = median count rate of data. |
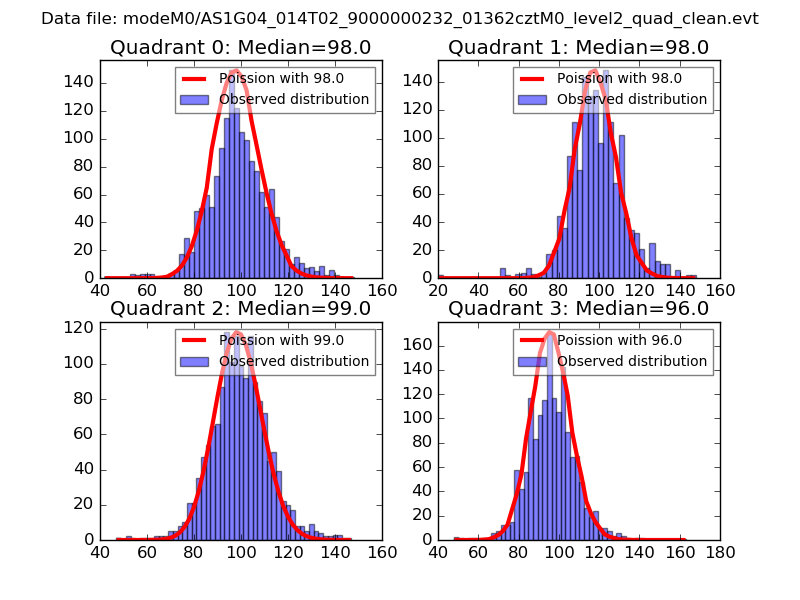 |
 |
| Quadrant-wise count rates Data is divided into 100 sec bins |
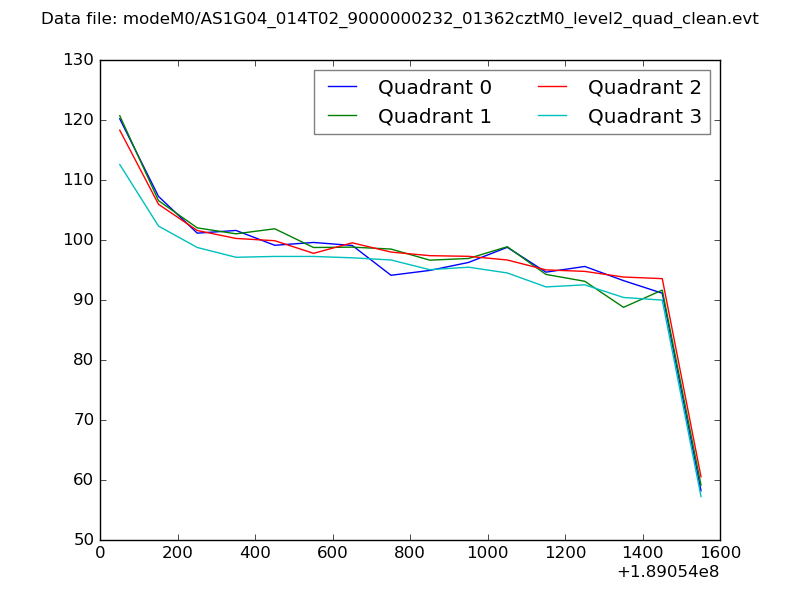 |
|
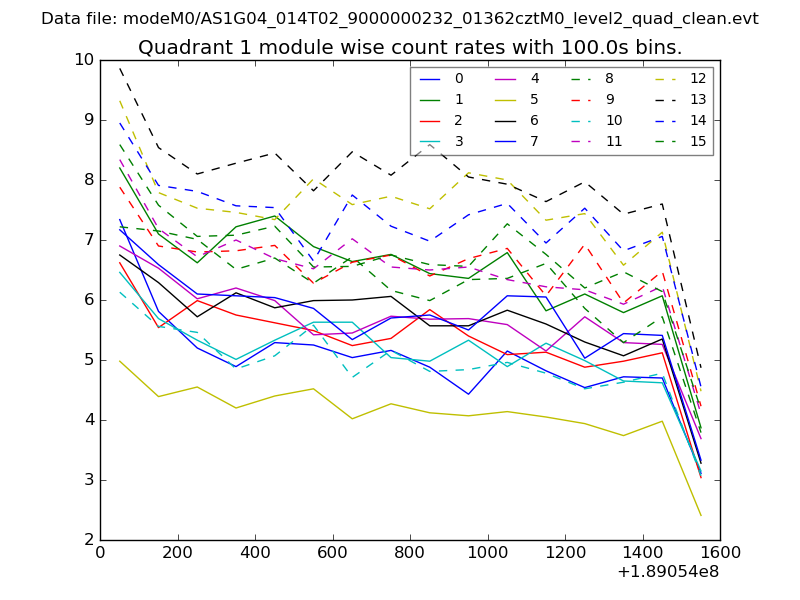
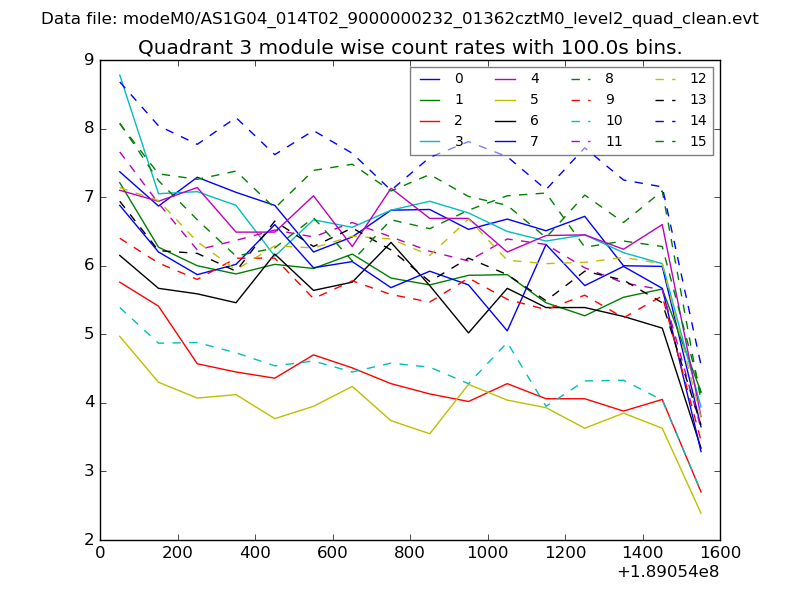
| Module-wise count rates for Quadrant A Data is divided into 100 sec bins |
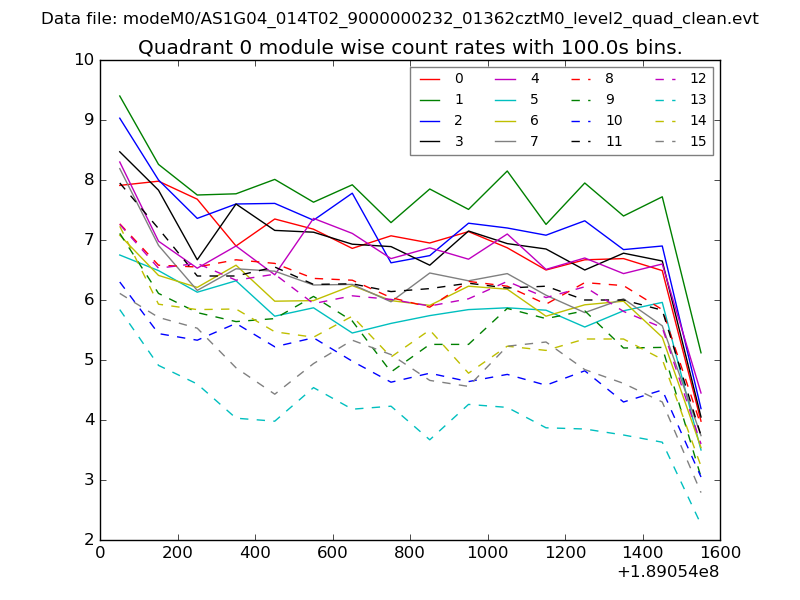 |
 |
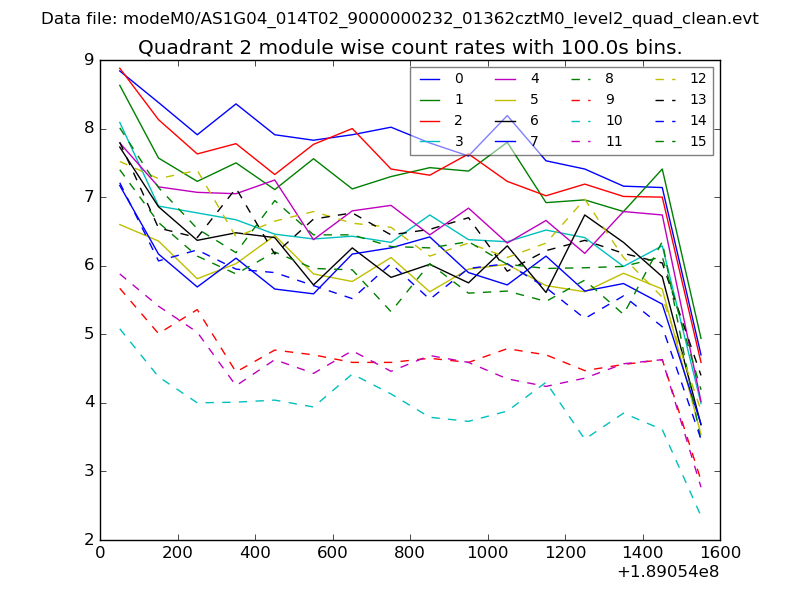
| Module-wise count rates for Quadrant B Data is divided into 100 sec bins |
 |
 |
| Module-wise count rates for Quadrant C Data is divided into 100 sec bins |
 |
 |
| Module-wise count rates for Quadrant D Data is divided into 100 sec bins |
 |
 |
| Parameter | Plot |
|---|---|
| CZT HV Monitor | 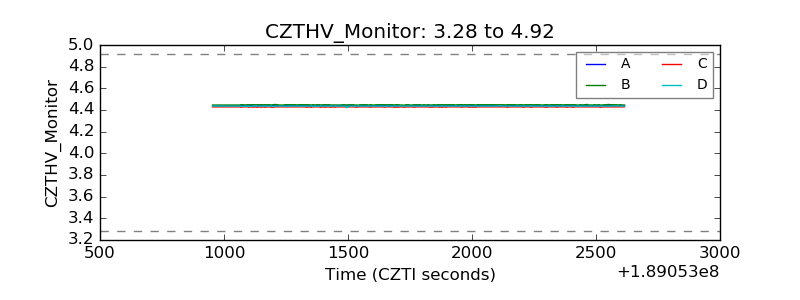 |
| D_VDD | 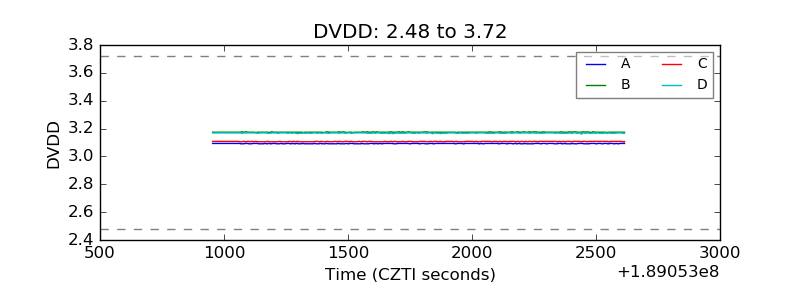 |
| Temperature 1 | 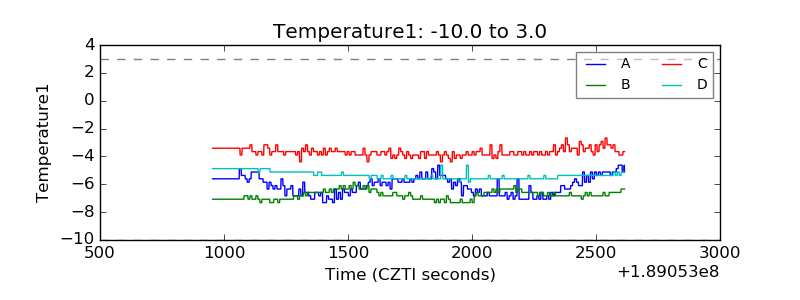 |
| Veto HV Monitor |  |
| Veto LLD | 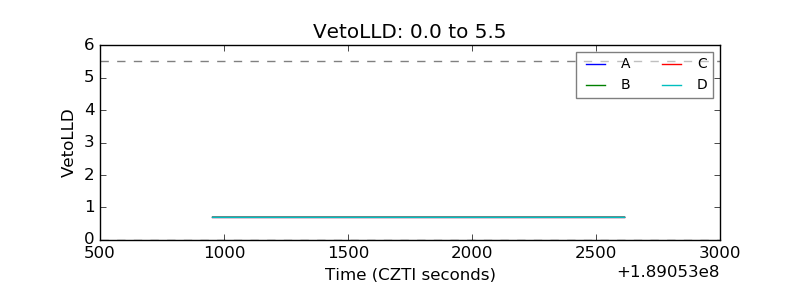 |
| Alpha Counter | 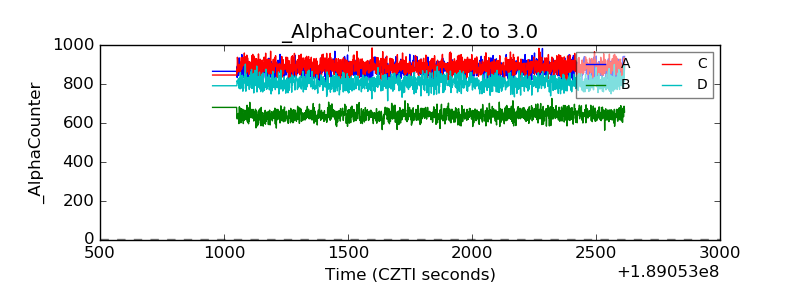 |
| _CPM_Rate | 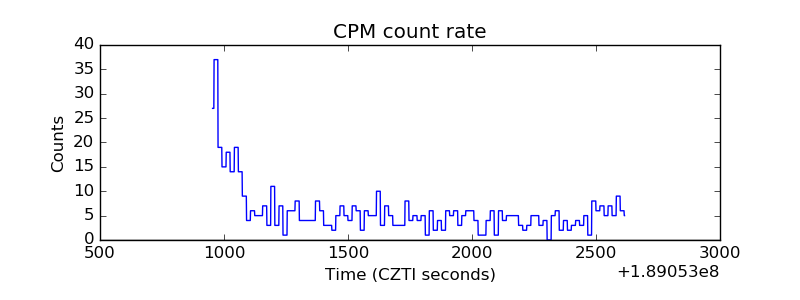 |
| CZT Counter | 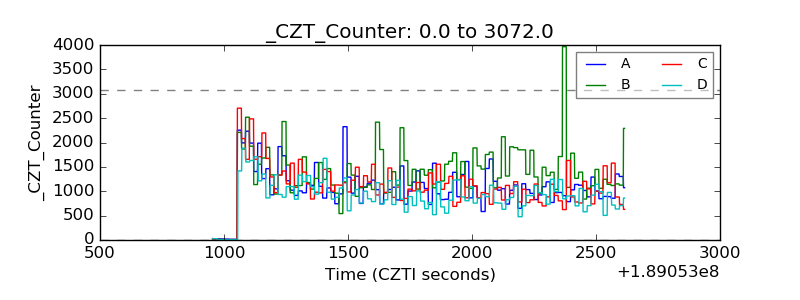 |
| +2.5 Volts monitor |  |
| +5 Volts monitor | 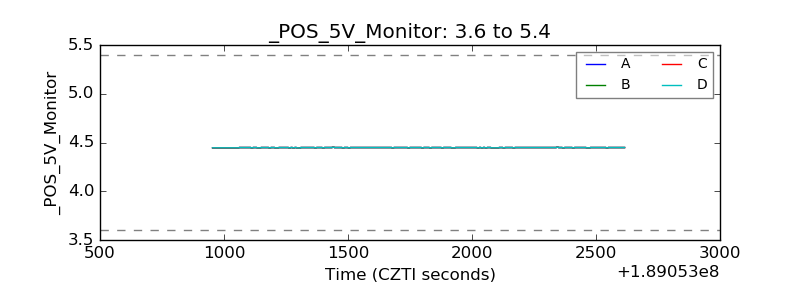 |
| _ROLL_ROT | 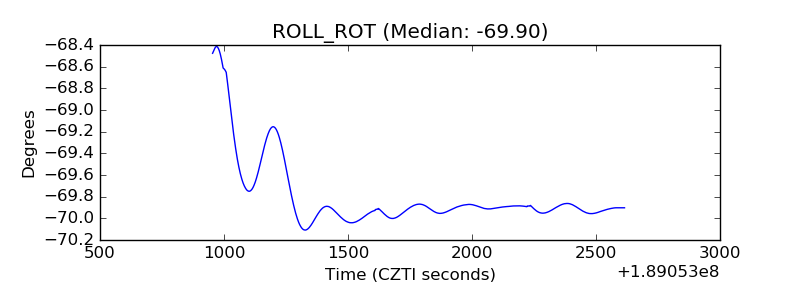 |
| _Roll_DEC | 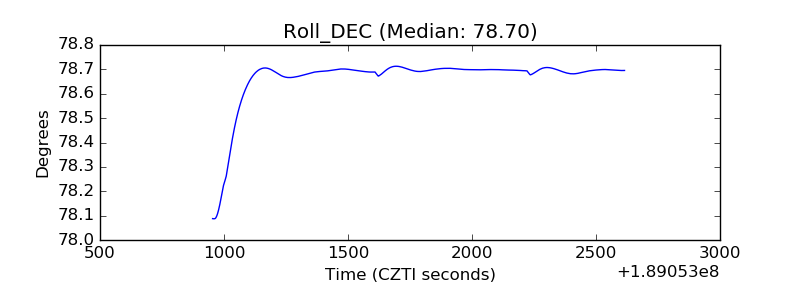 |
| _Roll_RA | 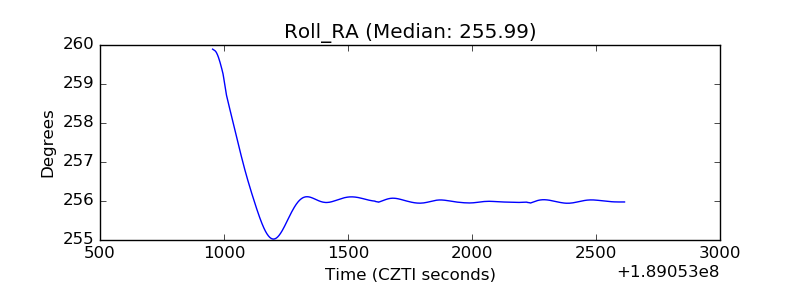 |
| Veto Counter | 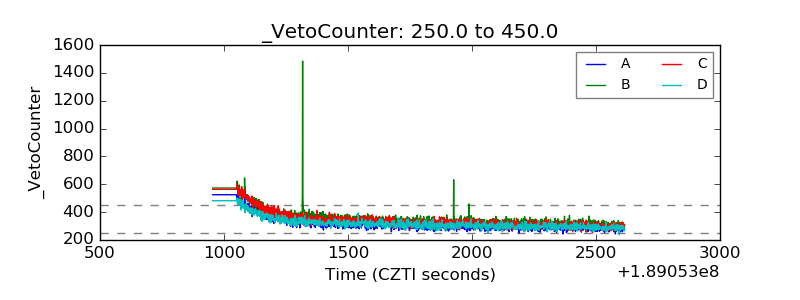 |