| Param | Original file | Final file |
|---|---|---|
| Filename | modeM0/AS1G04_014T02_9000000232_01363cztM0_level2.evt | modeM0/AS1G04_014T02_9000000232_01363cztM0_level2_quad_clean.evt |
| Size (bytes) | 1,037,119,680 | 96,920,640 |
| Size | 989.1 MB | 92.4 MB |
| Events in quadrant A | 7,838,769 | 627,323 |
| Events in quadrant B | 8,943,410 | 630,923 |
| Events in quadrant C | 7,325,814 | 619,890 |
| Events in quadrant D | 6,871,164 | 604,857 |
| Mode SS | |||
|---|---|---|---|
| Quadrant | BADHDUFLAG | Total packets | Discarded packets |
| A | 0 | 132 | 0 |
| B | 0 | 132 | 0 |
| C | 0 | 132 | 0 |
| D | 0 | 132 | 0 |
| Mode M0 | |||
|---|---|---|---|
| Quadrant | BADHDUFLAG | Total packets | Discarded packets |
| A | 0 | 27908 | 2 |
| B | 0 | 31159 | 1 |
| C | 0 | 26418 | 1 |
| D | 0 | 25099 | 1 |
| Mode M9 | |||
|---|---|---|---|
| Quadrant | BADHDUFLAG | Total packets | Discarded packets |
| A | 0 | 8 | 0 |
| B | 0 | 8 | 0 |
| C | 0 | 8 | 0 |
| D | 0 | 8 | 0 |
| Quadrant | Total seconds | Saturated seconds | Saturation percentage |
|---|---|---|---|
| A | 6482 | 20 | 0.308547% |
| B | 6482 | 101 | 1.558161% |
| C | 6482 | 3 | 0.046282% |
| D | 6482 | 39 | 0.601666% |
Noise dominated data is calculated using 1-second bins in cleaned event files. If a bin has >2000 counts, and if more than 50% of those come from <1% of pixels, then it is considered to be noise-dominated and hence unusable.
| Quadrant | # 1 sec bins | Bins with >0 counts | Bins with >2000 counts | High rate bins dominated by noise | Noise dominated (total time) | Noise dominated (detector-on time) | Marked lightcurve |
|---|---|---|---|---|---|---|---|
| A | 7232 | 6483 | 225 | 225 | 3.11% | 3.47% | 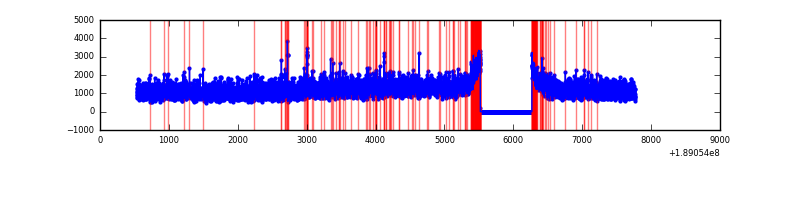 |
| B | 7232 | 6482 | 574 | 574 | 7.94% | 8.86% | 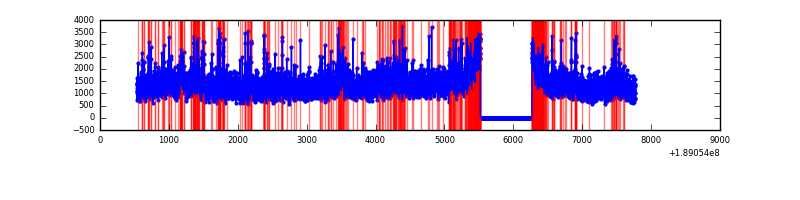 |
| C | 7232 | 6483 | 144 | 144 | 1.99% | 2.22% | 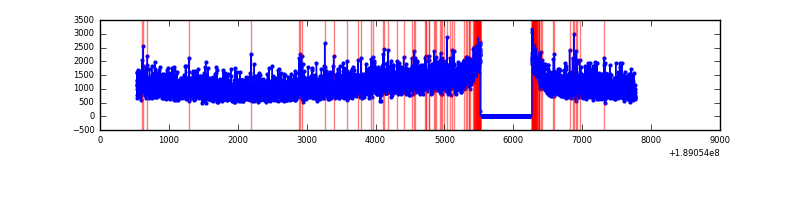 |
| D | 7232 | 6483 | 204 | 204 | 2.82% | 3.15% | 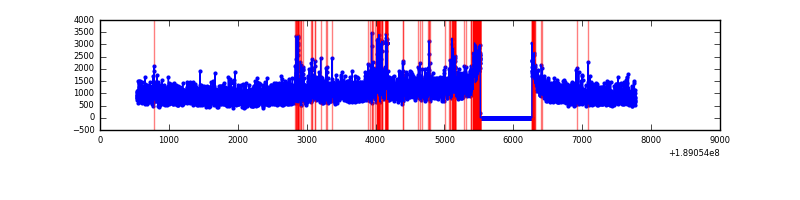 |
Top three noisy pixels from each quadrant. If the there are fewer than three noisy pixels in the level2.evt file, extra rows are filled as -1
| Pixel properties | Quadrant properties | ||||||
|---|---|---|---|---|---|---|---|
| Quadrant | DetID | PixID | Counts | Sigma | Mean | Median | Sigma |
| A | 15 | 127 | 226196 | 482.68 | 1939 | 1959 | 464.6 |
| A | 4 | 32 | 153967 | 327.2 | 1939 | 1959 | 464.6 |
| A | 15 | 233 | 10026 | 17.36 | 1939 | 1959 | 464.6 |
| B | 8 | 4 | 705835 | 1466.4 | 2031 | 2038 | 479.9 |
| B | 12 | 52 | 239740 | 495.27 | 2031 | 2038 | 479.9 |
| B | 4 | 222 | 71611 | 144.96 | 2031 | 2038 | 479.9 |
| C | 15 | 241 | 200458 | 393.41 | 1813 | 1870 | 504.8 |
| C | 3 | 111 | 19542 | 35.01 | 1813 | 1870 | 504.8 |
| C | 3 | 79 | 15794 | 27.58 | 1813 | 1870 | 504.8 |
| D | 9 | 53 | 143159 | 262.56 | 1743 | 1801 | 538.4 |
| D | 13 | 73 | 131119 | 240.2 | 1743 | 1801 | 538.4 |
| D | 5 | 82 | 40555 | 71.98 | 1743 | 1801 | 538.4 |
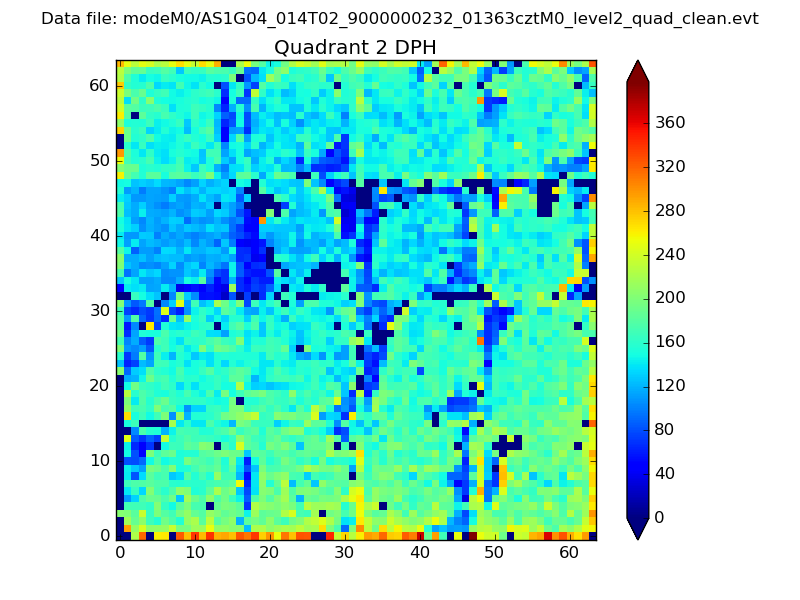
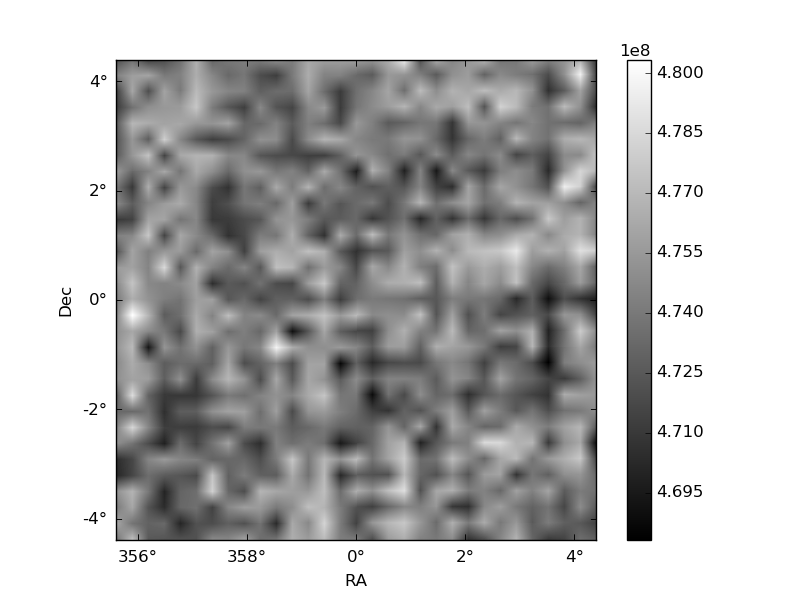
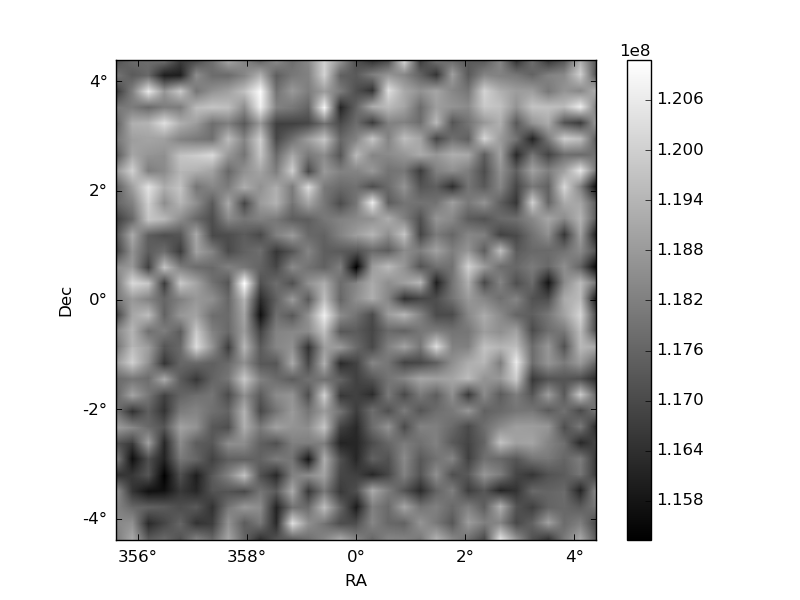
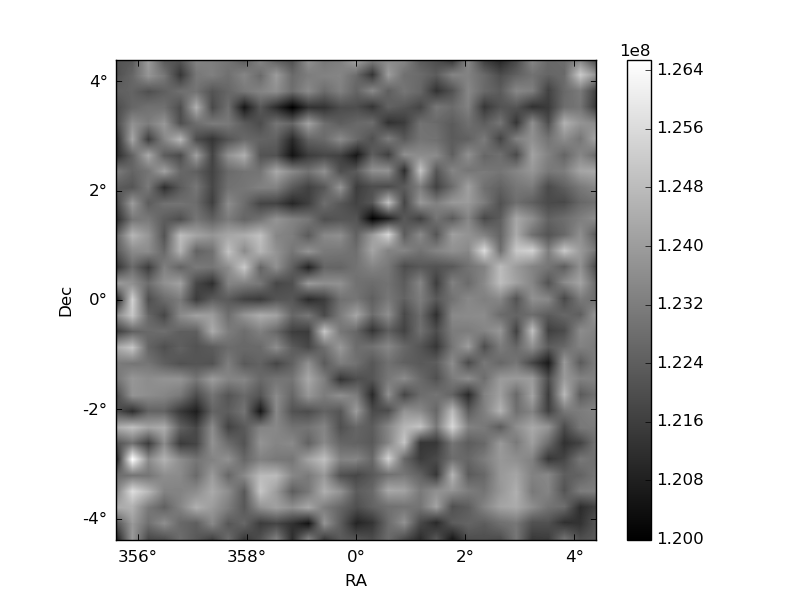
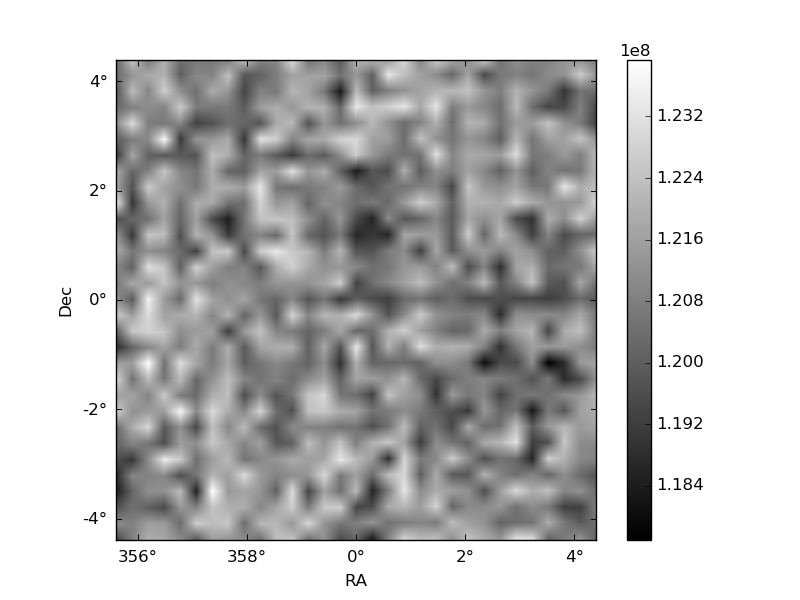
Histogram calculated using DETX and DETY for each event in the final _common_clean file
| Quadrant A | 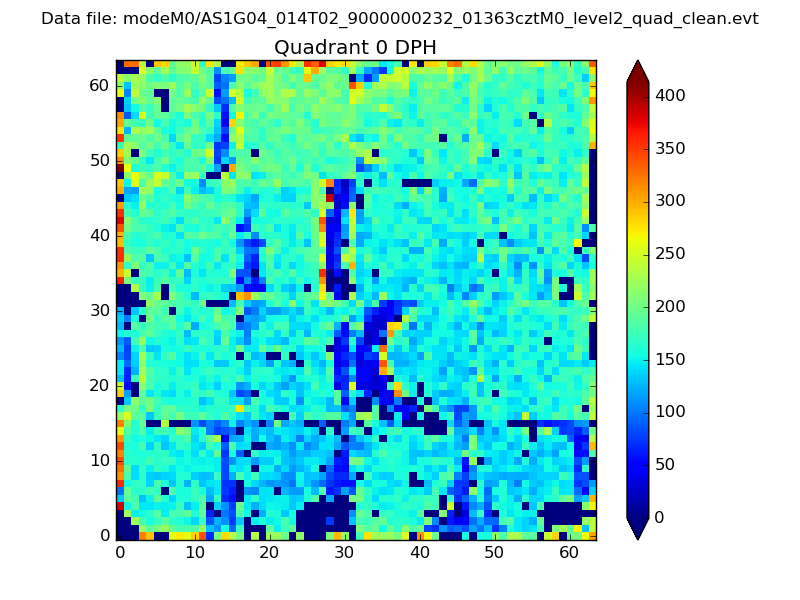 |
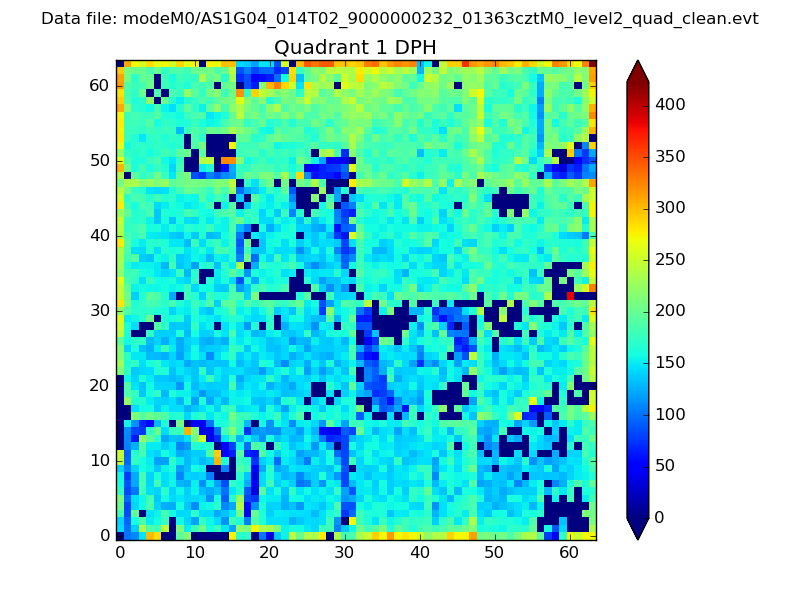 |
Quadrant B |
|---|---|---|---|
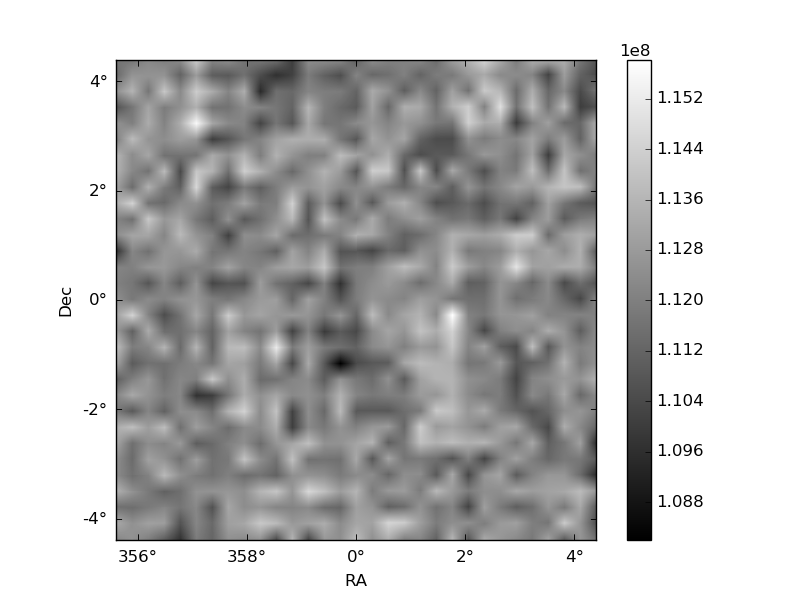
| Quadrant D | 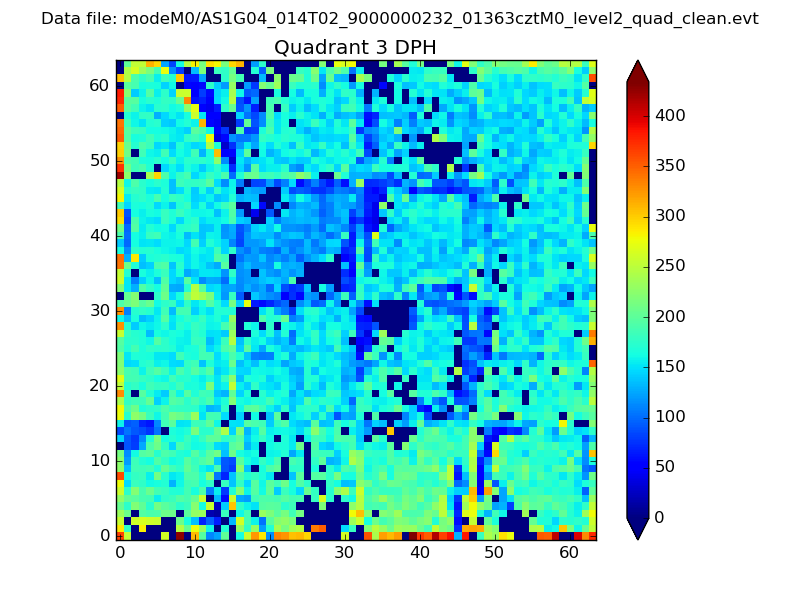 |
 |
Quadrant C |
| Plot type | Count rate plots | Images |
|---|---|---|
| Comparison with Poisson distribution Blue bars denote a histogram of data divided into 1 sec bins. Red curve is a Poisson curve with rate = median count rate of data. |
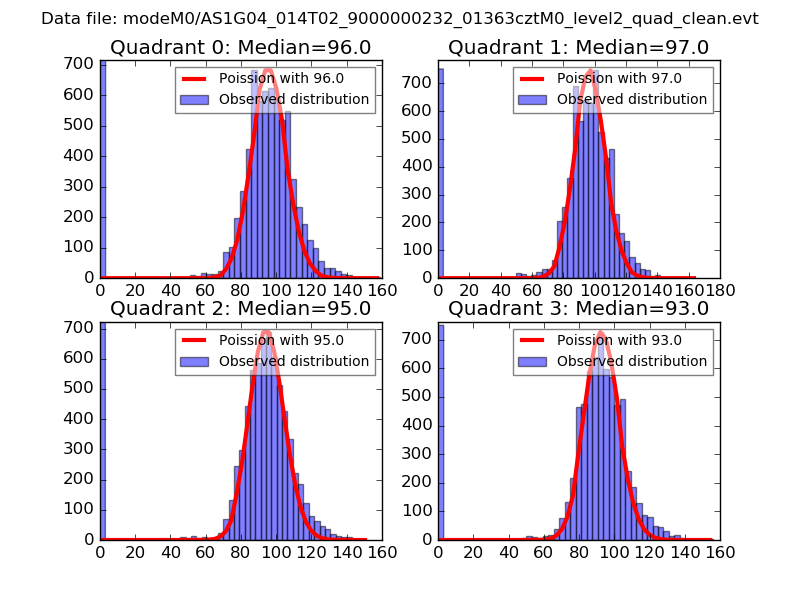 |
 |
| Quadrant-wise count rates Data is divided into 100 sec bins |
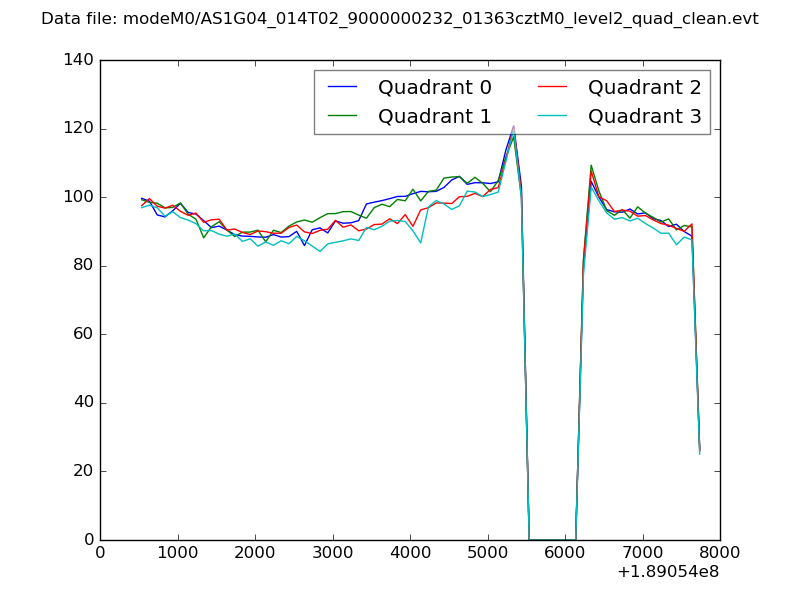 |
|
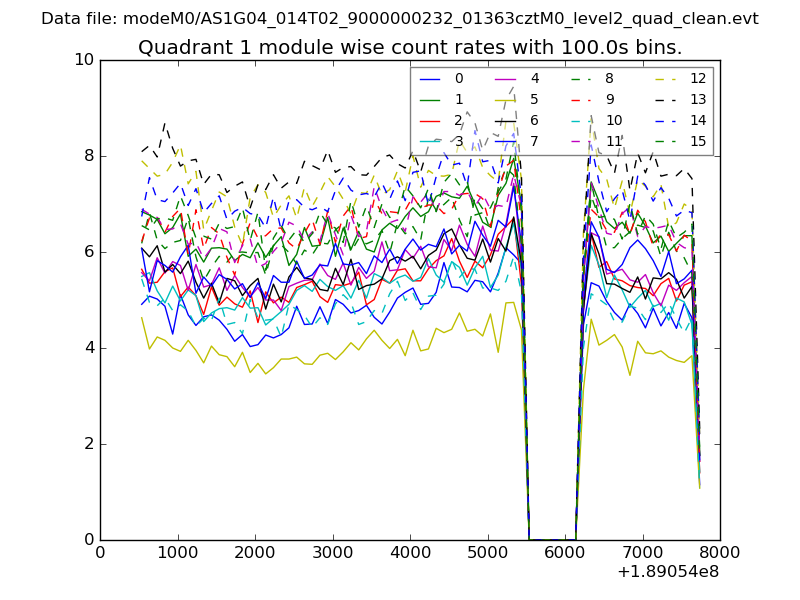
| Module-wise count rates for Quadrant A Data is divided into 100 sec bins |
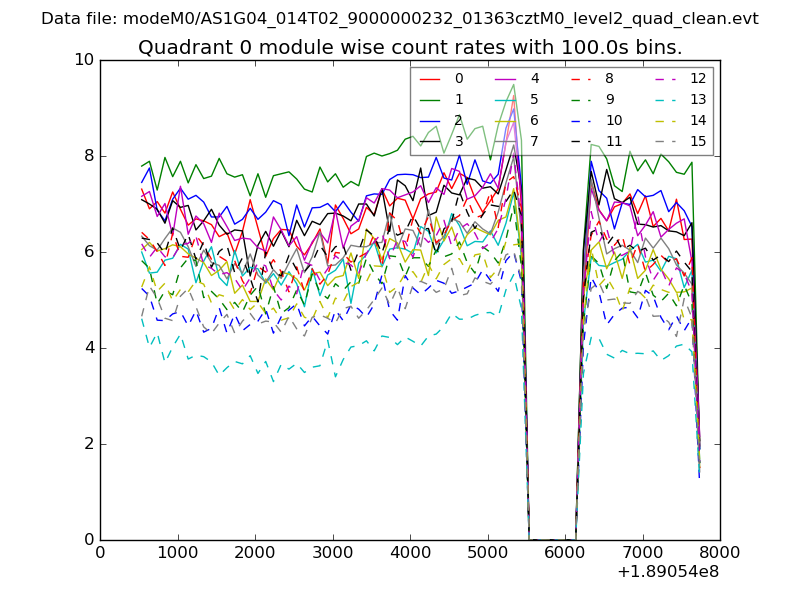 |
 |
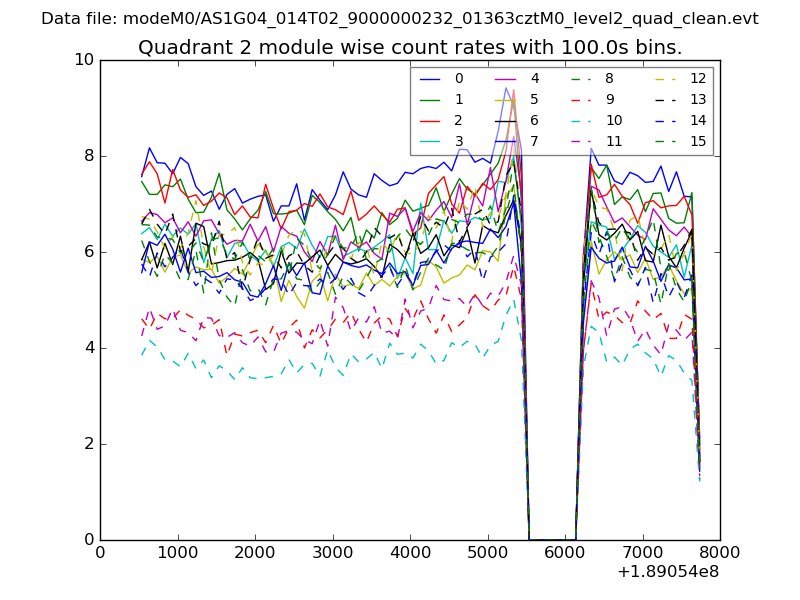
| Module-wise count rates for Quadrant B Data is divided into 100 sec bins |
 |
 |
| Module-wise count rates for Quadrant C Data is divided into 100 sec bins |
 |
 |
| Module-wise count rates for Quadrant D Data is divided into 100 sec bins |
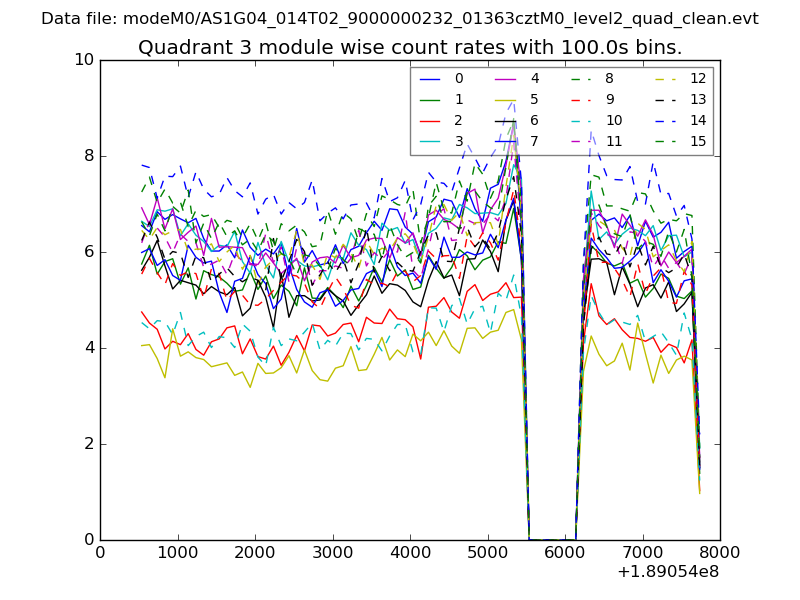 |
 |
| Parameter | Plot |
|---|---|
| CZT HV Monitor | 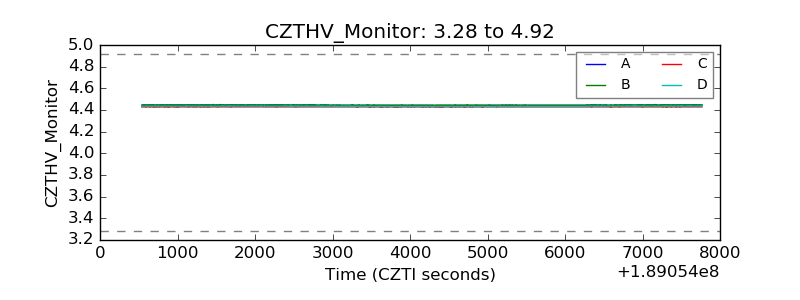 |
| D_VDD | 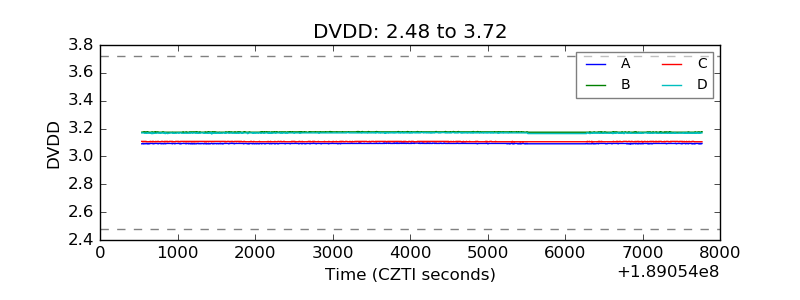 |
| Temperature 1 | 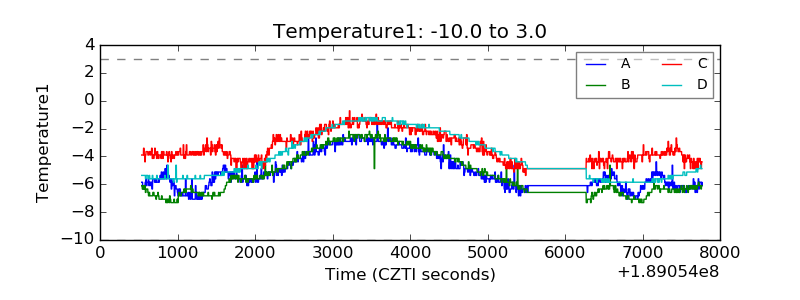 |
| Veto HV Monitor | 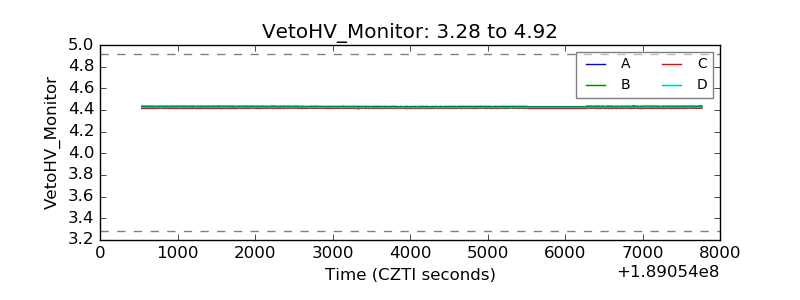 |
| Veto LLD | 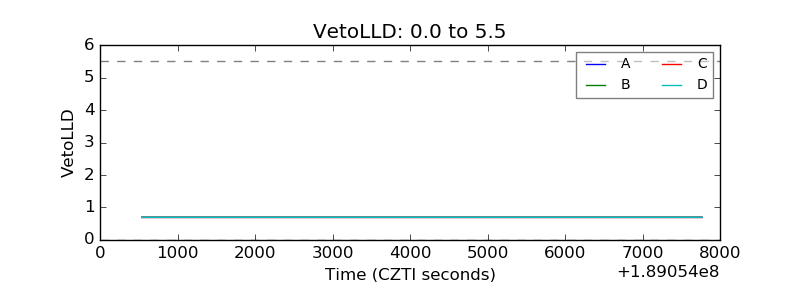 |
| Alpha Counter | 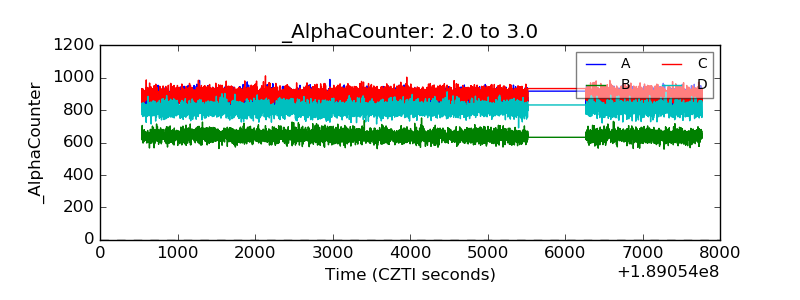 |
| _CPM_Rate | 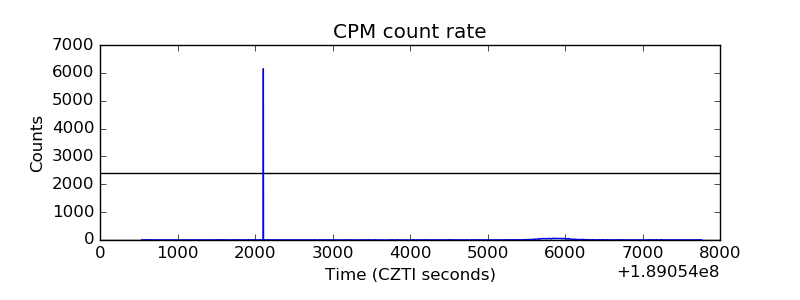 |
| CZT Counter | 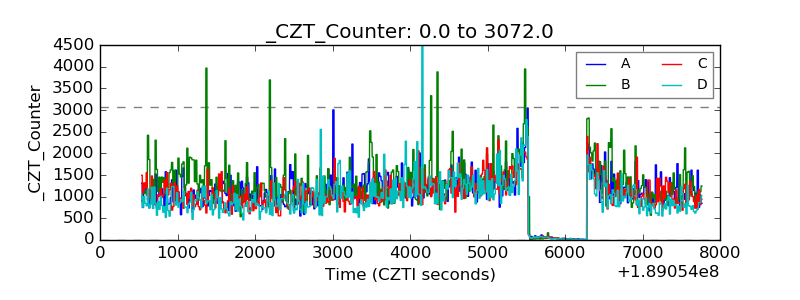 |
| +2.5 Volts monitor | 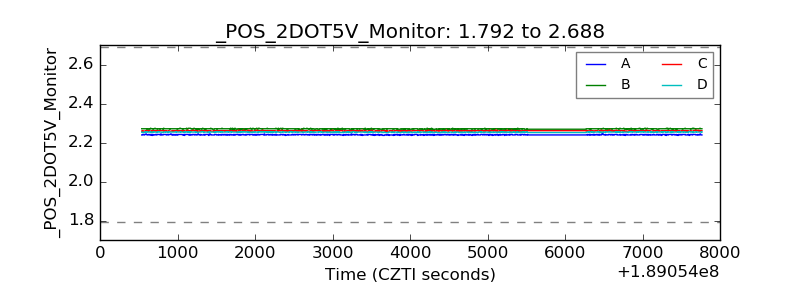 |
| +5 Volts monitor | 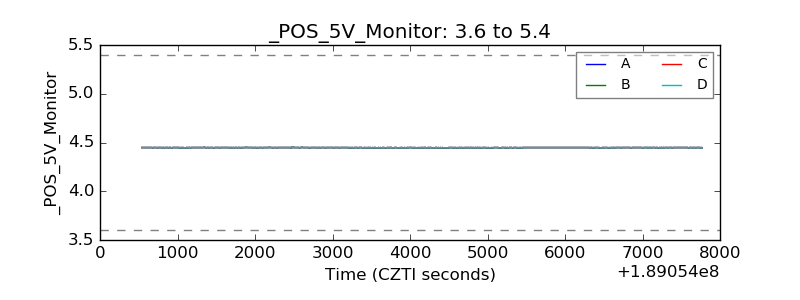 |
| _ROLL_ROT | 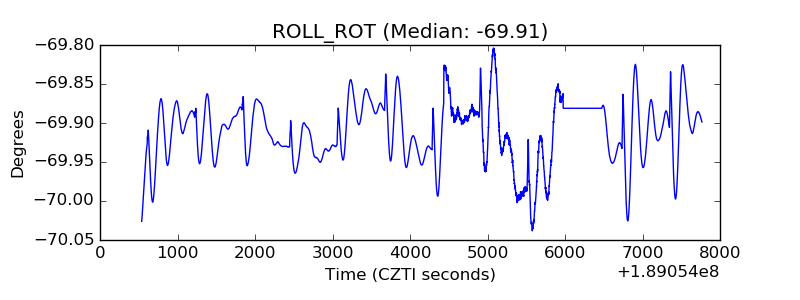 |
| _Roll_DEC | 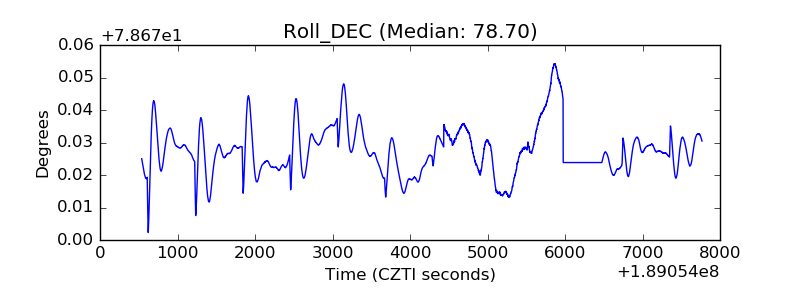 |
| _Roll_RA | 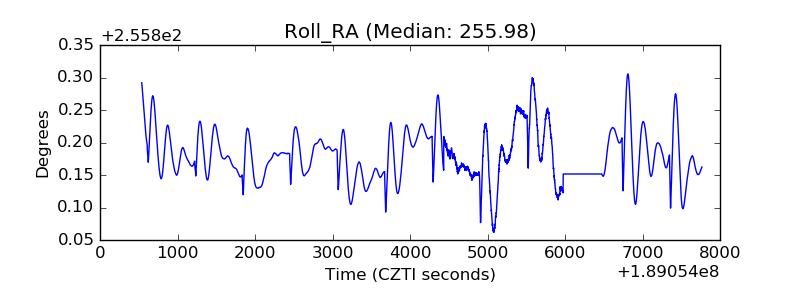 |
| Veto Counter | 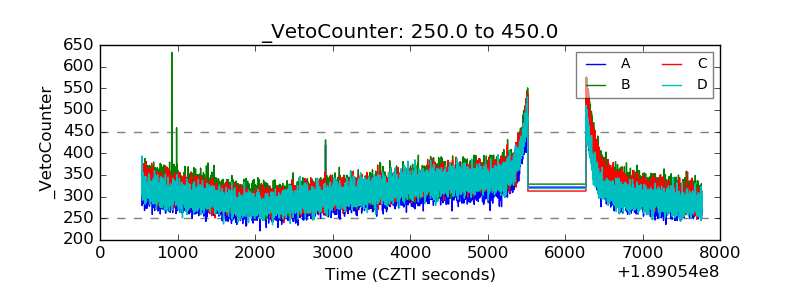 |