| Param | Original file | Final file |
|---|---|---|
| Filename | modeM0/AS1G04_014T02_9000000232_01364cztM0_level2.evt | modeM0/AS1G04_014T02_9000000232_01364cztM0_level2_quad_clean.evt |
| Size (bytes) | 1,270,543,680 | 111,876,480 |
| Size | 1.2 GB | 106.7 MB |
| Events in quadrant A | 10,315,086 | 713,808 |
| Events in quadrant B | 10,177,060 | 735,989 |
| Events in quadrant C | 9,039,563 | 715,404 |
| Events in quadrant D | 8,451,831 | 701,888 |
| Mode SS | |||
|---|---|---|---|
| Quadrant | BADHDUFLAG | Total packets | Discarded packets |
| A | 0 | 150 | 0 |
| B | 0 | 150 | 0 |
| C | 0 | 150 | 0 |
| D | 0 | 150 | 0 |
| Mode M0 | |||
|---|---|---|---|
| Quadrant | BADHDUFLAG | Total packets | Discarded packets |
| A | 0 | 36015 | 3 |
| B | 0 | 35582 | 2 |
| C | 0 | 32123 | 2 |
| D | 0 | 30495 | 2 |
| Mode M9 | |||
|---|---|---|---|
| Quadrant | BADHDUFLAG | Total packets | Discarded packets |
| A | 0 | 1 | 0 |
| B | 0 | 1 | 0 |
| C | 0 | 1 | 0 |
| D | 0 | 1 | 0 |
| Quadrant | Total seconds | Saturated seconds | Saturation percentage |
|---|---|---|---|
| A | 7492 | 400 | 5.339028% |
| B | 7492 | 162 | 2.162306% |
| C | 7492 | 35 | 0.467165% |
| D | 7492 | 75 | 1.001068% |
Noise dominated data is calculated using 1-second bins in cleaned event files. If a bin has >2000 counts, and if more than 50% of those come from <1% of pixels, then it is considered to be noise-dominated and hence unusable.
| Quadrant | # 1 sec bins | Bins with >0 counts | Bins with >2000 counts | High rate bins dominated by noise | Noise dominated (total time) | Noise dominated (detector-on time) | Marked lightcurve |
|---|---|---|---|---|---|---|---|
| A | 7552 | 7493 | 848 | 848 | 11.23% | 11.32% | 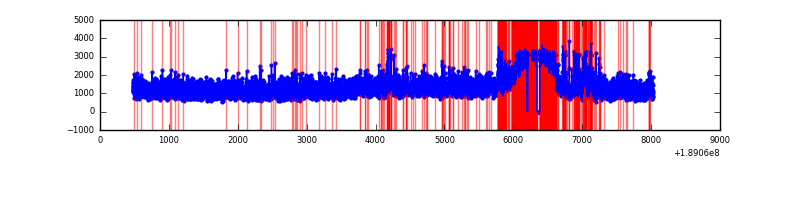 |
| B | 7552 | 7493 | 696 | 696 | 9.22% | 9.29% | 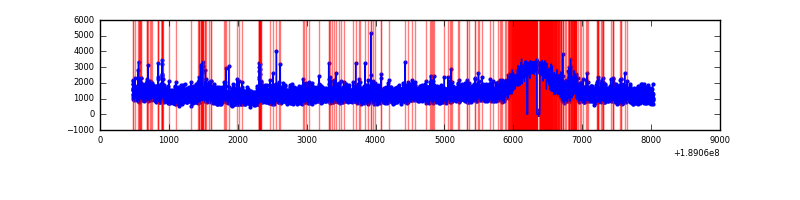 |
| C | 7552 | 7494 | 445 | 445 | 5.89% | 5.94% | 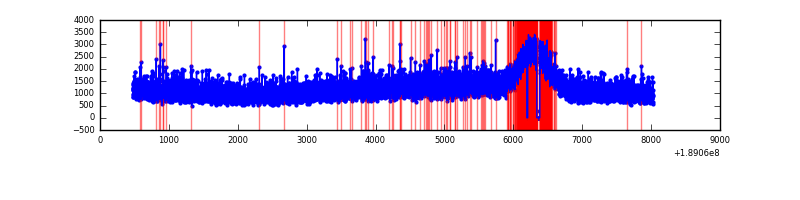 |
| D | 7552 | 7494 | 447 | 447 | 5.92% | 5.96% | 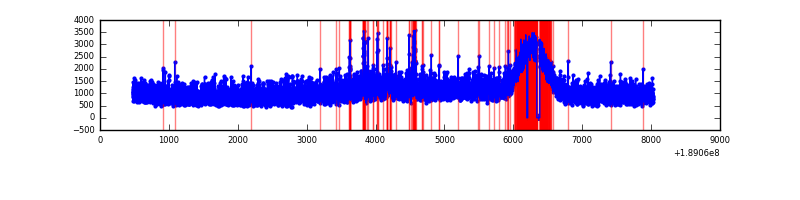 |
Top three noisy pixels from each quadrant. If the there are fewer than three noisy pixels in the level2.evt file, extra rows are filled as -1
| Pixel properties | Quadrant properties | ||||||
|---|---|---|---|---|---|---|---|
| Quadrant | DetID | PixID | Counts | Sigma | Mean | Median | Sigma |
| A | 4 | 32 | 430723 | 741.2 | 2382 | 2402 | 577.9 |
| A | 15 | 127 | 421324 | 724.93 | 2382 | 2402 | 577.9 |
| A | 15 | 233 | 201621 | 344.74 | 2382 | 2402 | 577.9 |
| B | 8 | 4 | 317117 | 528.77 | 2502 | 2518 | 595.0 |
| B | 12 | 52 | 106392 | 174.59 | 2502 | 2518 | 595.0 |
| B | 6 | 53 | 52865 | 84.62 | 2502 | 2518 | 595.0 |
| C | 15 | 241 | 239279 | 377.55 | 2241 | 2316 | 627.6 |
| C | 3 | 111 | 25377 | 36.74 | 2241 | 2316 | 627.6 |
| C | 3 | 79 | 21335 | 30.3 | 2241 | 2316 | 627.6 |
| D | 9 | 53 | 190534 | 276.63 | 2176 | 2255 | 680.6 |
| D | 10 | 125 | 77460 | 110.5 | 2176 | 2255 | 680.6 |
| D | 13 | 73 | 26737 | 35.97 | 2176 | 2255 | 680.6 |
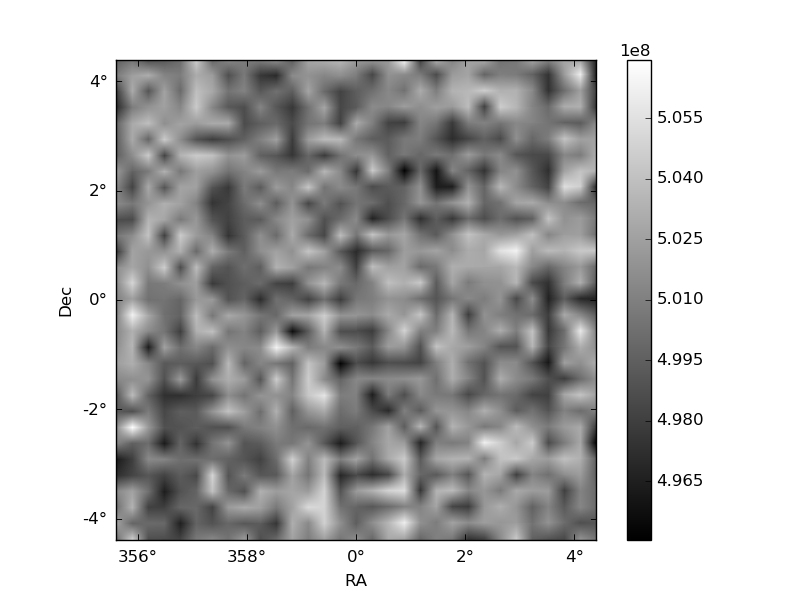
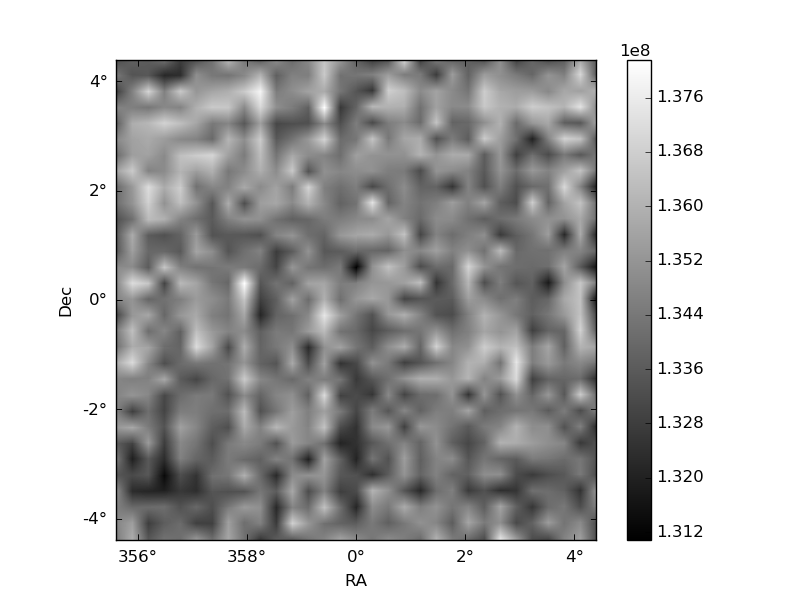
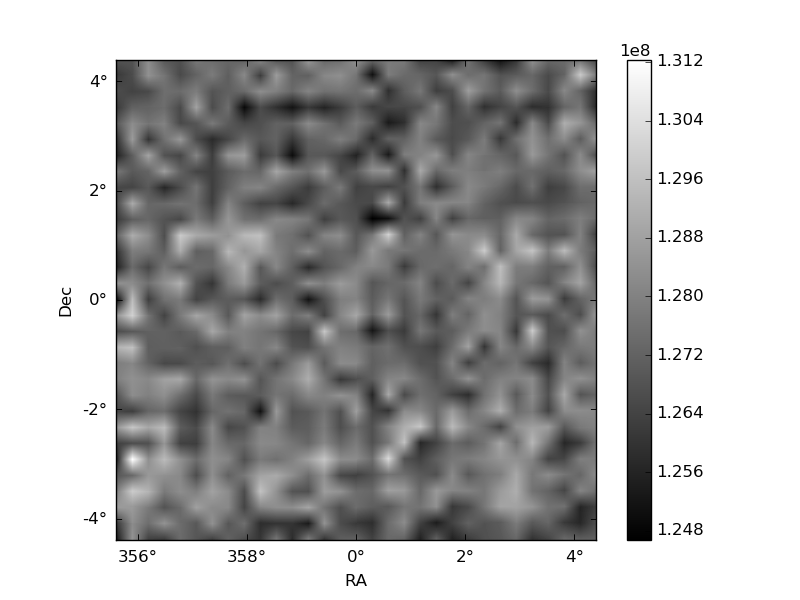
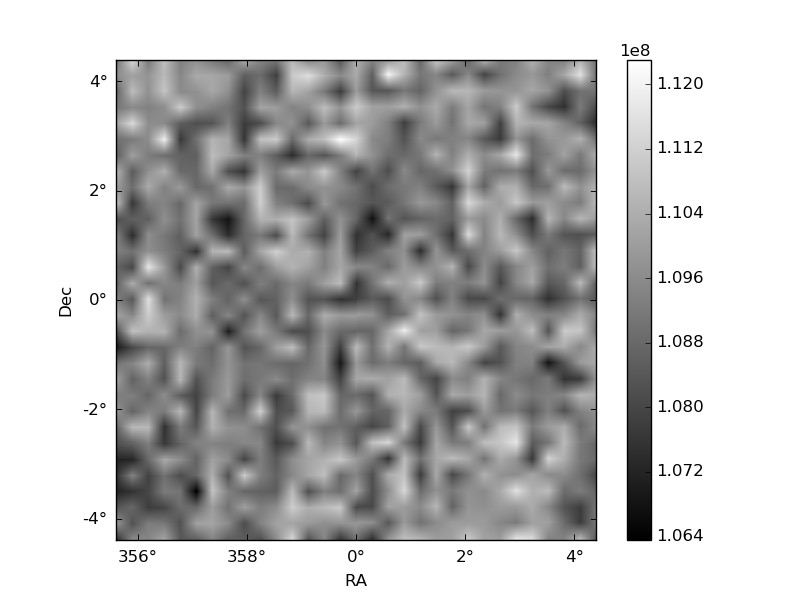
Histogram calculated using DETX and DETY for each event in the final _common_clean file
| Quadrant A | 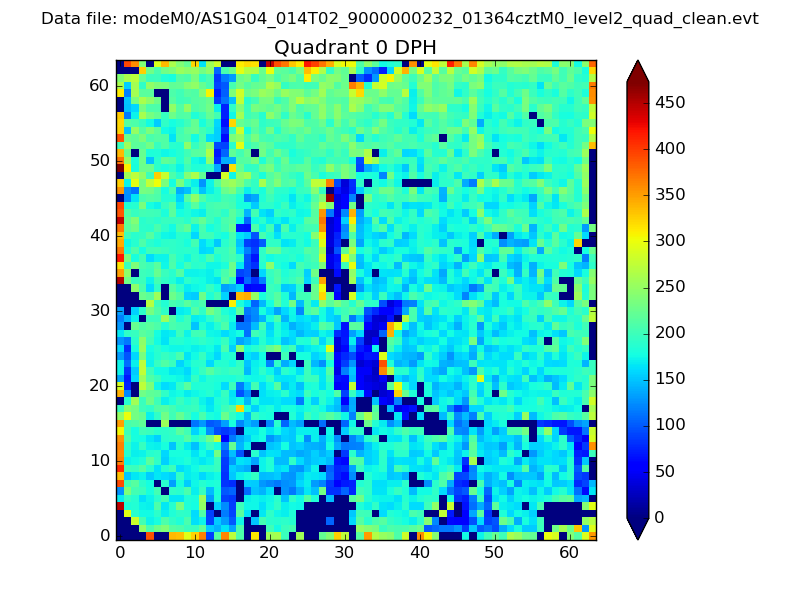 |
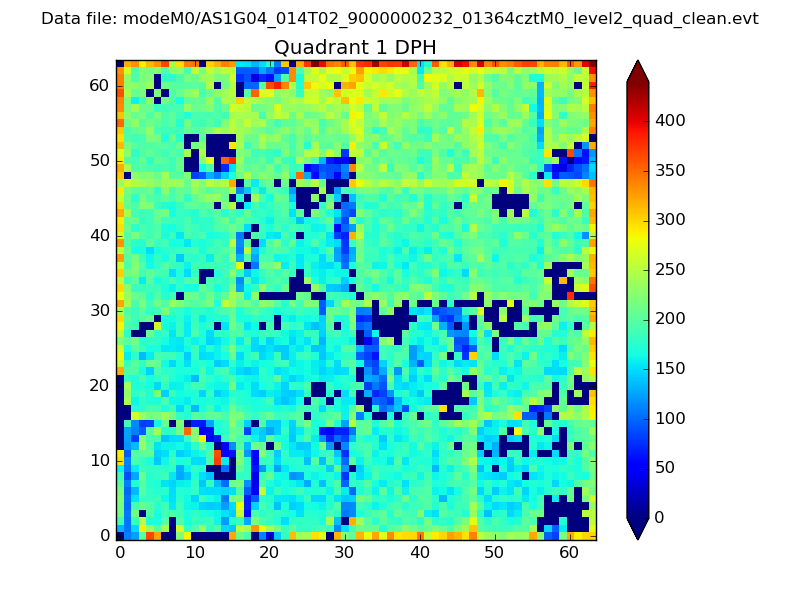 |
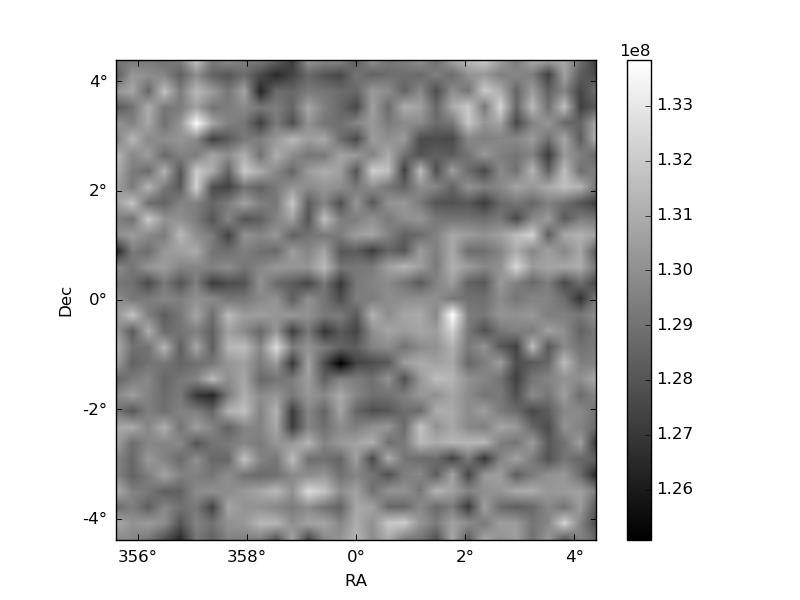
Quadrant B |
|---|---|---|---|
| Quadrant D | 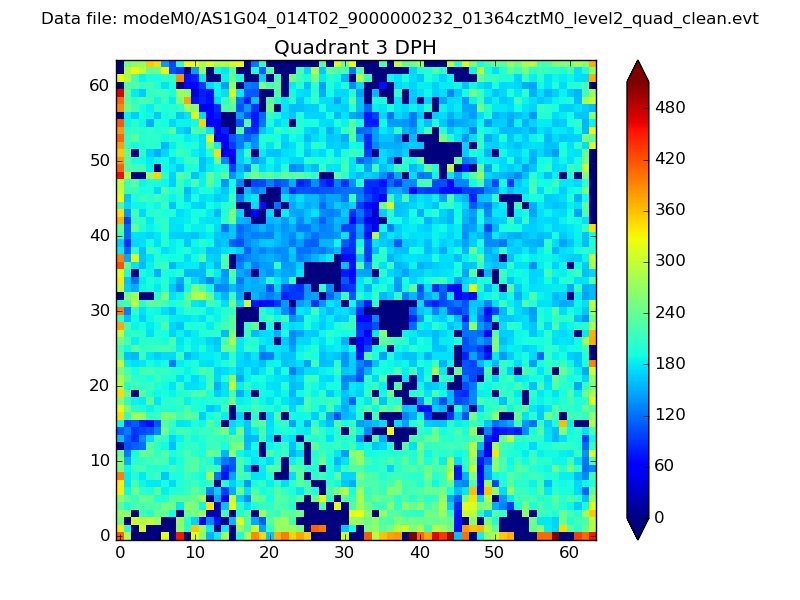 |
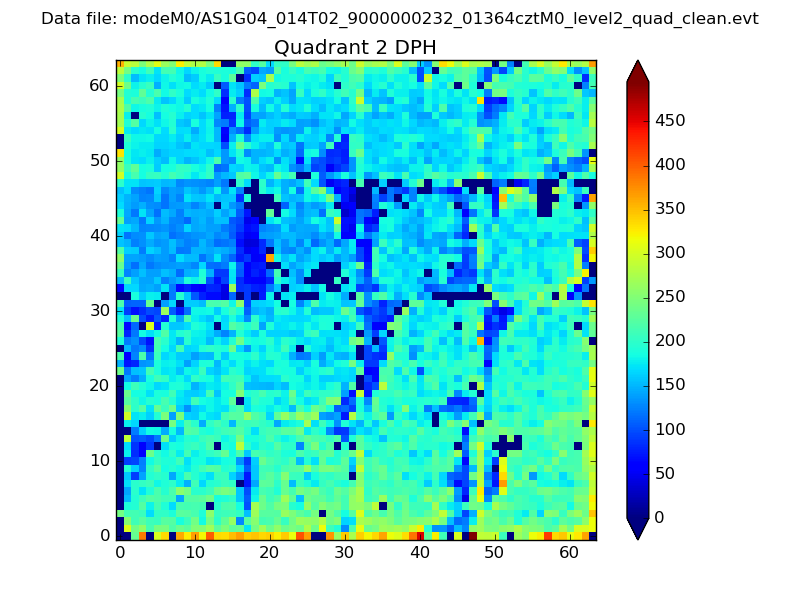 |
Quadrant C |
| Plot type | Count rate plots | Images |
|---|---|---|
| Comparison with Poisson distribution Blue bars denote a histogram of data divided into 1 sec bins. Red curve is a Poisson curve with rate = median count rate of data. |
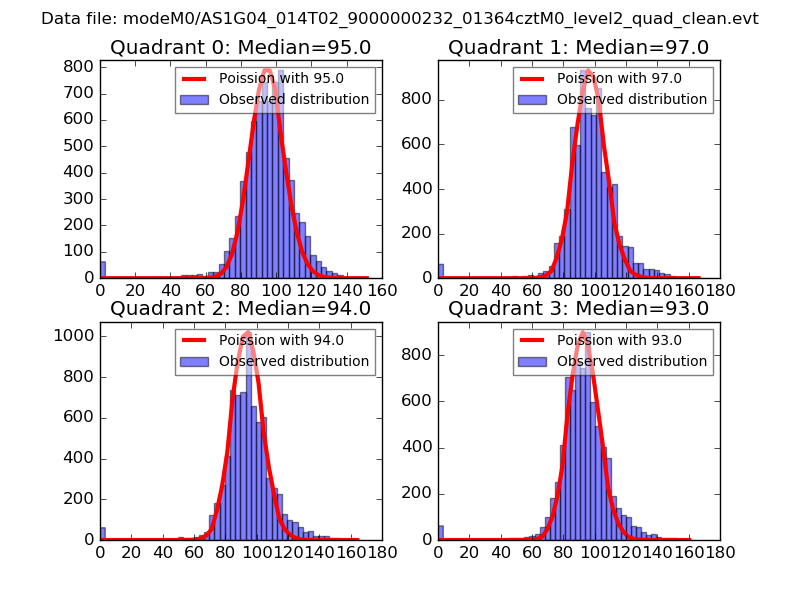 |
 |
| Quadrant-wise count rates Data is divided into 100 sec bins |
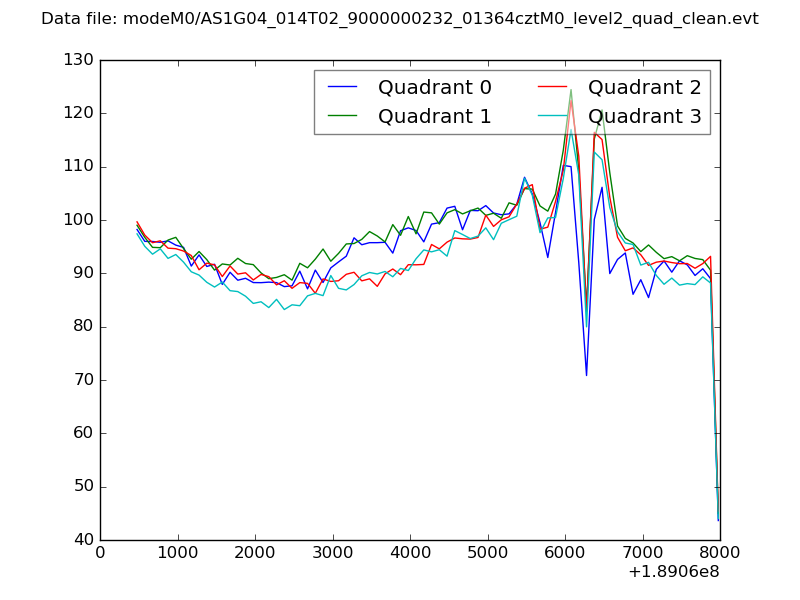 |
|
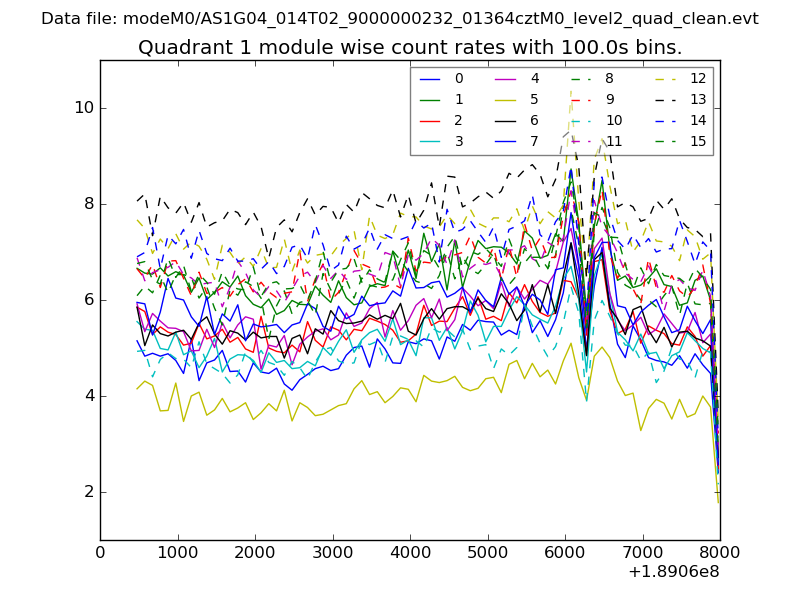
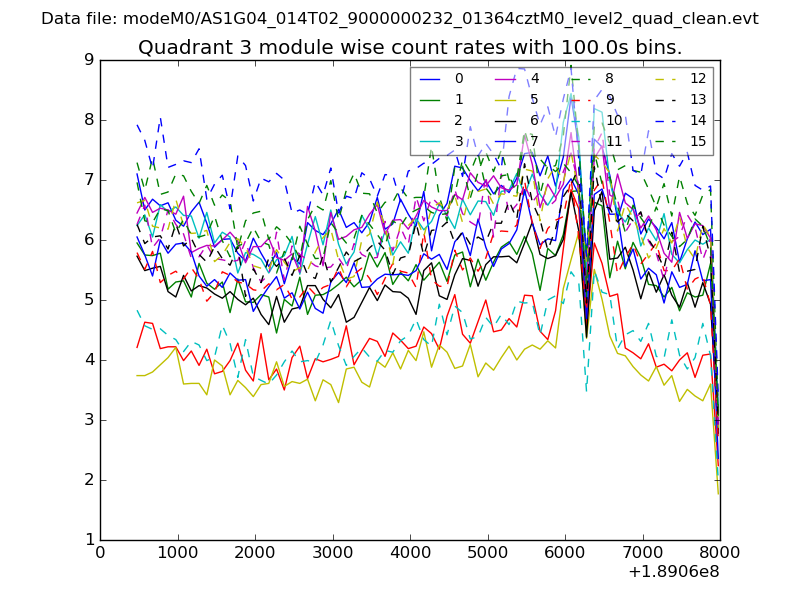
| Module-wise count rates for Quadrant A Data is divided into 100 sec bins |
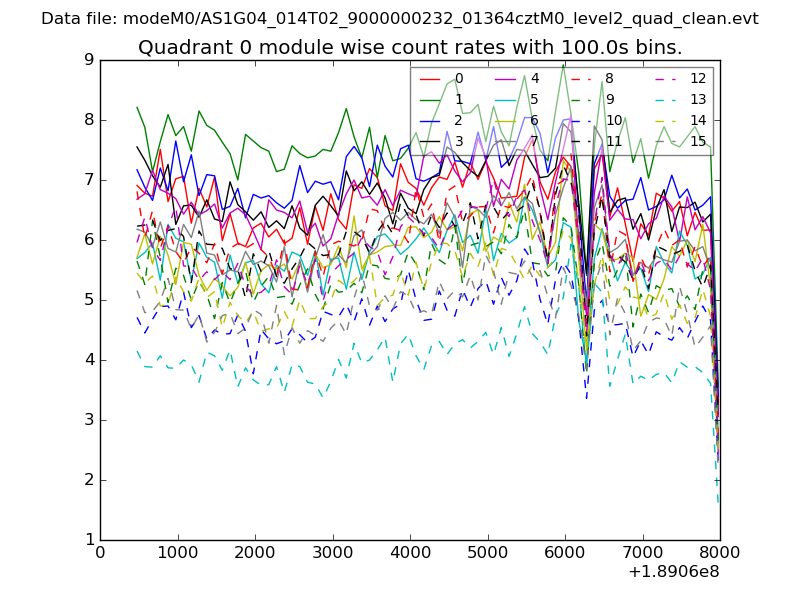 |
 |
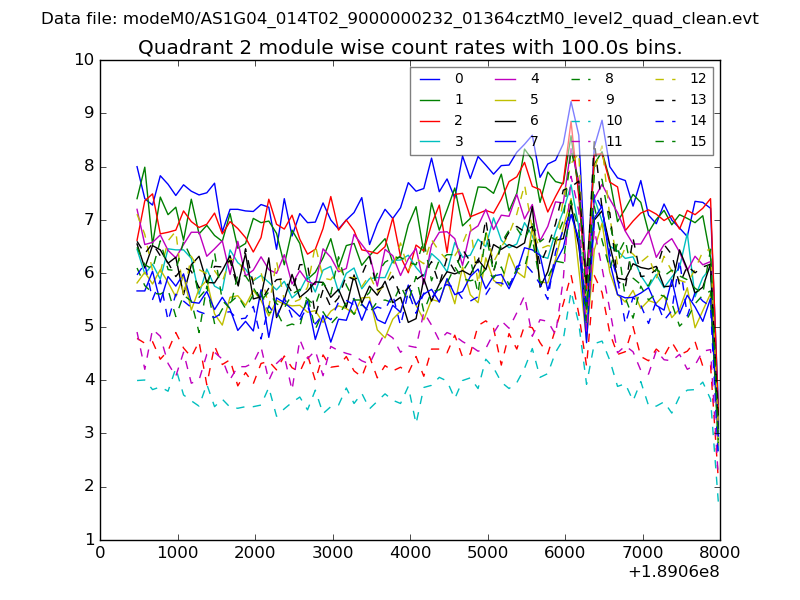
| Module-wise count rates for Quadrant B Data is divided into 100 sec bins |
 |
 |
| Module-wise count rates for Quadrant C Data is divided into 100 sec bins |
 |
 |
| Module-wise count rates for Quadrant D Data is divided into 100 sec bins |
 |
 |
| Parameter | Plot |
|---|---|
| CZT HV Monitor | 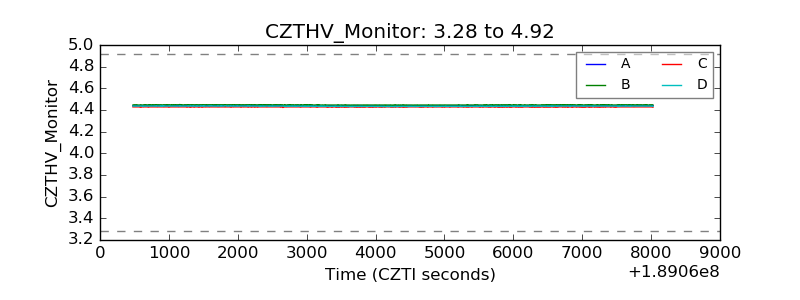 |
| D_VDD | 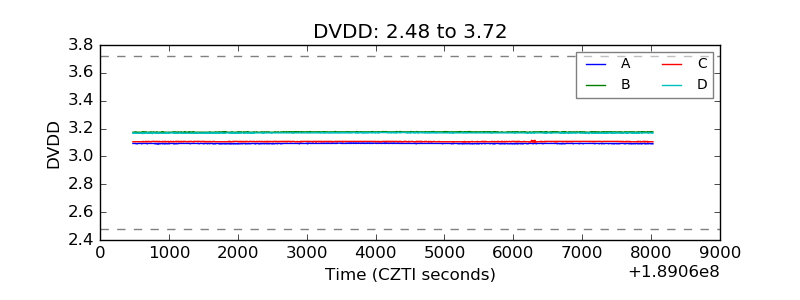 |
| Temperature 1 | 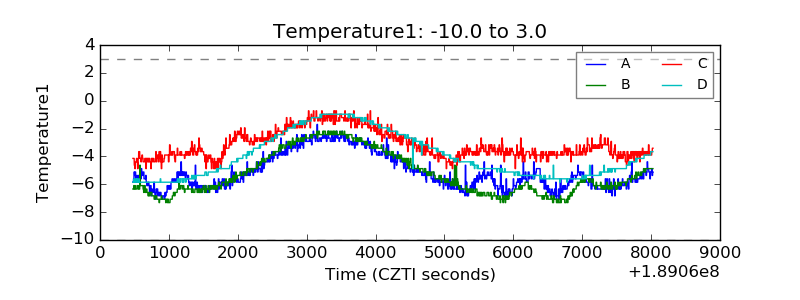 |
| Veto HV Monitor | 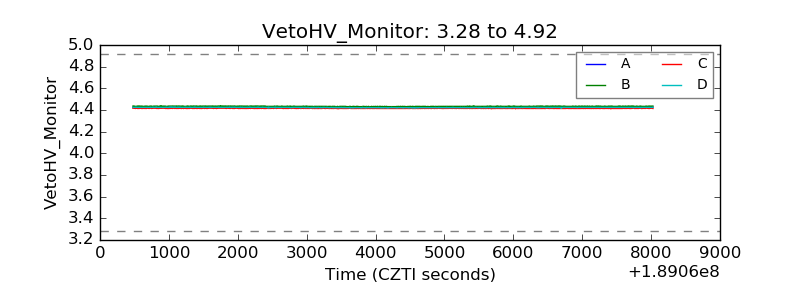 |
| Veto LLD | 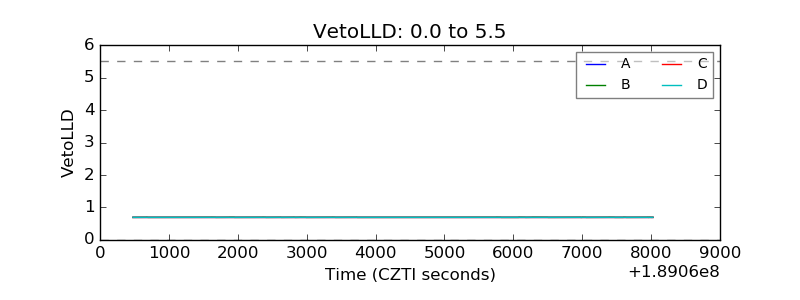 |
| Alpha Counter | 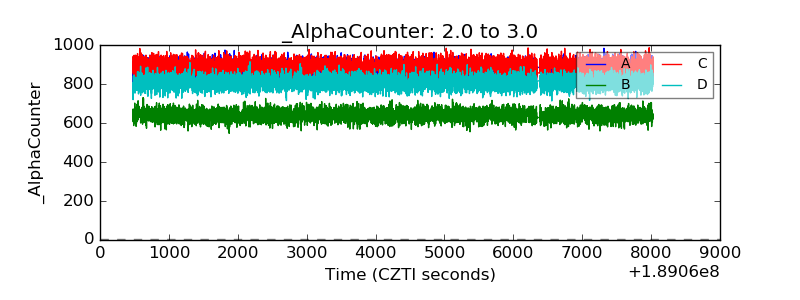 |
| _CPM_Rate | 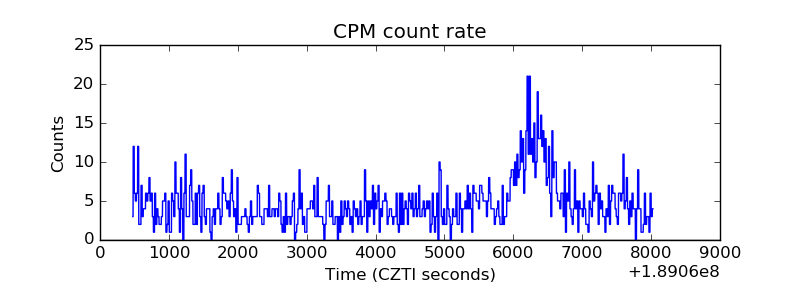 |
| CZT Counter | 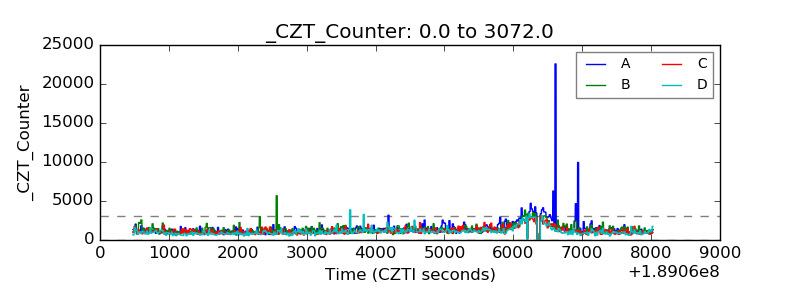 |
| +2.5 Volts monitor |  |
| +5 Volts monitor | 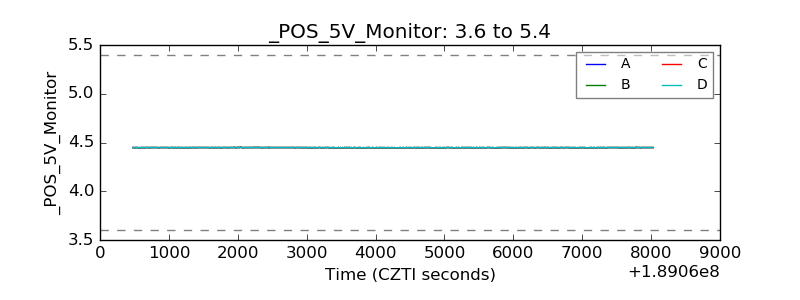 |
| _ROLL_ROT | 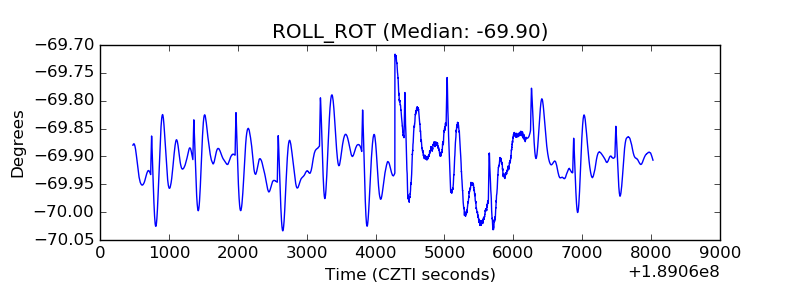 |
| _Roll_DEC | 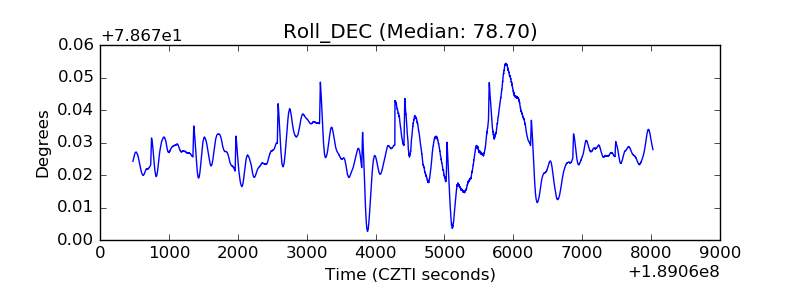 |
| _Roll_RA | 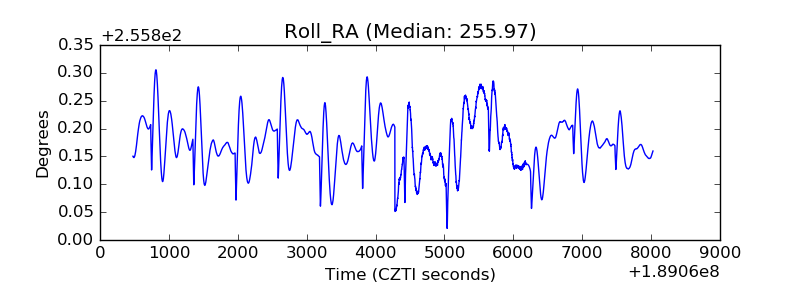 |
| Veto Counter | 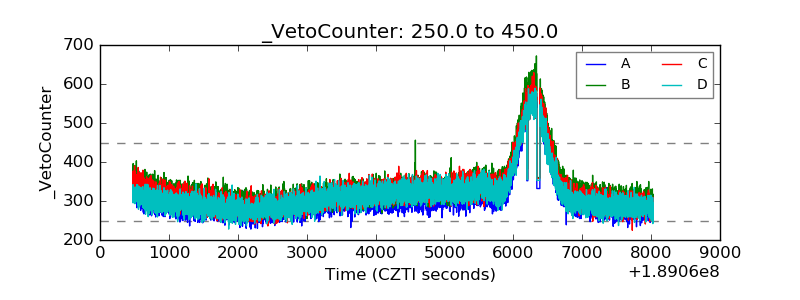 |