| Param | Original file | Final file |
|---|---|---|
| Filename | modeM0/AS1G04_014T02_9000000232_01365cztM0_level2.evt | modeM0/AS1G04_014T02_9000000232_01365cztM0_level2_quad_clean.evt |
| Size (bytes) | 1,271,145,600 | 111,833,280 |
| Size | 1.2 GB | 106.7 MB |
| Events in quadrant A | 10,528,070 | 710,673 |
| Events in quadrant B | 10,370,027 | 732,738 |
| Events in quadrant C | 8,888,828 | 716,337 |
| Events in quadrant D | 8,209,656 | 700,905 |
| Mode SS | |||
|---|---|---|---|
| Quadrant | BADHDUFLAG | Total packets | Discarded packets |
| A | 0 | 152 | 0 |
| B | 0 | 152 | 0 |
| C | 0 | 152 | 0 |
| D | 0 | 152 | 0 |
| Mode M0 | |||
|---|---|---|---|
| Quadrant | BADHDUFLAG | Total packets | Discarded packets |
| A | 0 | 36715 | 1 |
| B | 0 | 36153 | 0 |
| C | 0 | 31762 | 0 |
| D | 0 | 29738 | 0 |
| Quadrant | Total seconds | Saturated seconds | Saturation percentage |
|---|---|---|---|
| A | 7561 | 252 | 3.332892% |
| B | 7561 | 86 | 1.137416% |
| C | 7561 | 2 | 0.026452% |
| D | 7561 | 4 | 0.052903% |
Noise dominated data is calculated using 1-second bins in cleaned event files. If a bin has >2000 counts, and if more than 50% of those come from <1% of pixels, then it is considered to be noise-dominated and hence unusable.
| Quadrant | # 1 sec bins | Bins with >0 counts | Bins with >2000 counts | High rate bins dominated by noise | Noise dominated (total time) | Noise dominated (detector-on time) | Marked lightcurve |
|---|---|---|---|---|---|---|---|
| A | 7561 | 7561 | 846 | 846 | 11.19% | 11.19% | 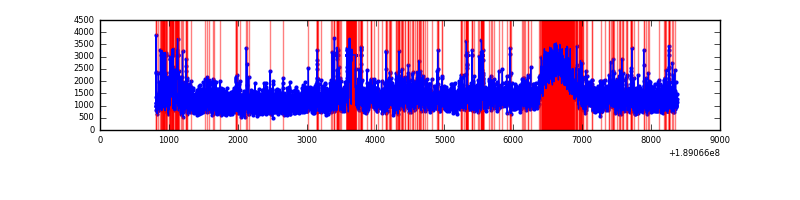 |
| B | 7561 | 7561 | 686 | 686 | 9.07% | 9.07% | 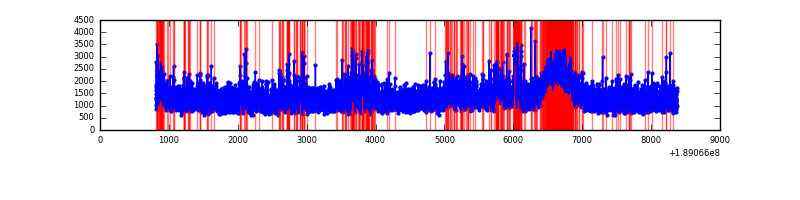 |
| C | 7561 | 7561 | 274 | 274 | 3.62% | 3.62% | 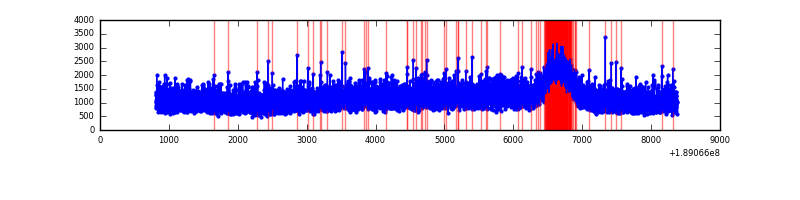 |
| D | 7561 | 7561 | 257 | 257 | 3.40% | 3.40% | 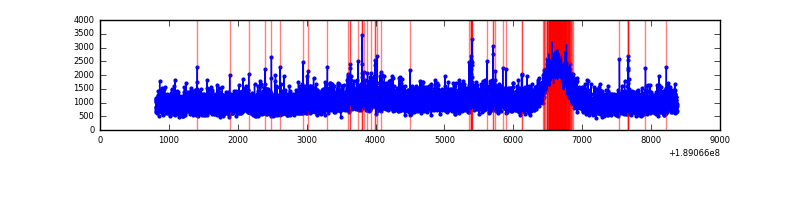 |
Top three noisy pixels from each quadrant. If the there are fewer than three noisy pixels in the level2.evt file, extra rows are filled as -1
| Pixel properties | Quadrant properties | ||||||
|---|---|---|---|---|---|---|---|
| Quadrant | DetID | PixID | Counts | Sigma | Mean | Median | Sigma |
| A | 4 | 32 | 565808 | 984.69 | 2358 | 2380 | 572.2 |
| A | 15 | 127 | 502923 | 874.79 | 2358 | 2380 | 572.2 |
| A | 15 | 233 | 133435 | 229.04 | 2358 | 2380 | 572.2 |
| B | 8 | 4 | 516947 | 881.03 | 2460 | 2474 | 583.9 |
| B | 5 | 249 | 176608 | 298.2 | 2460 | 2474 | 583.9 |
| B | 12 | 52 | 172080 | 290.45 | 2460 | 2474 | 583.9 |
| C | 15 | 241 | 239782 | 387.51 | 2192 | 2260 | 612.9 |
| C | 5 | 234 | 34048 | 51.86 | 2192 | 2260 | 612.9 |
| C | 3 | 111 | 26021 | 38.77 | 2192 | 2260 | 612.9 |
| D | 9 | 53 | 103595 | 151.72 | 2141 | 2220 | 668.2 |
| D | 10 | 125 | 51066 | 73.1 | 2141 | 2220 | 668.2 |
| D | 5 | 82 | 23851 | 32.37 | 2141 | 2220 | 668.2 |
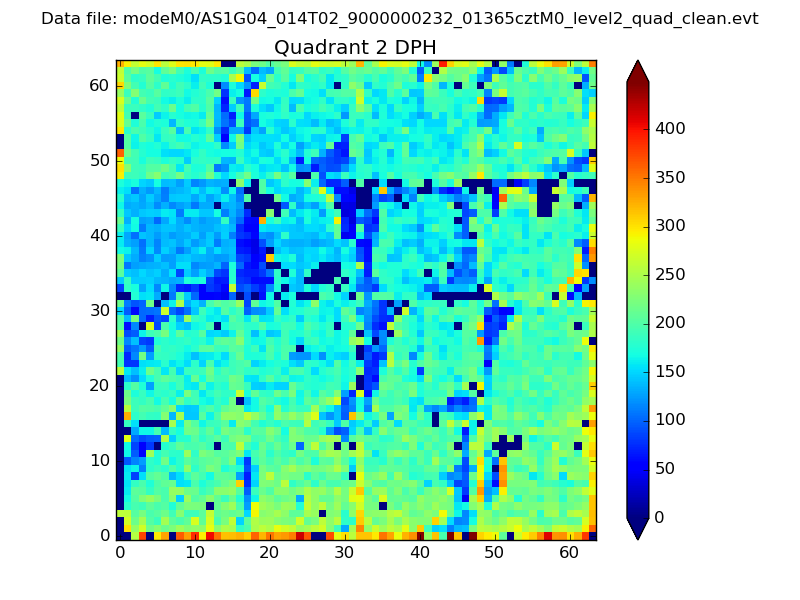
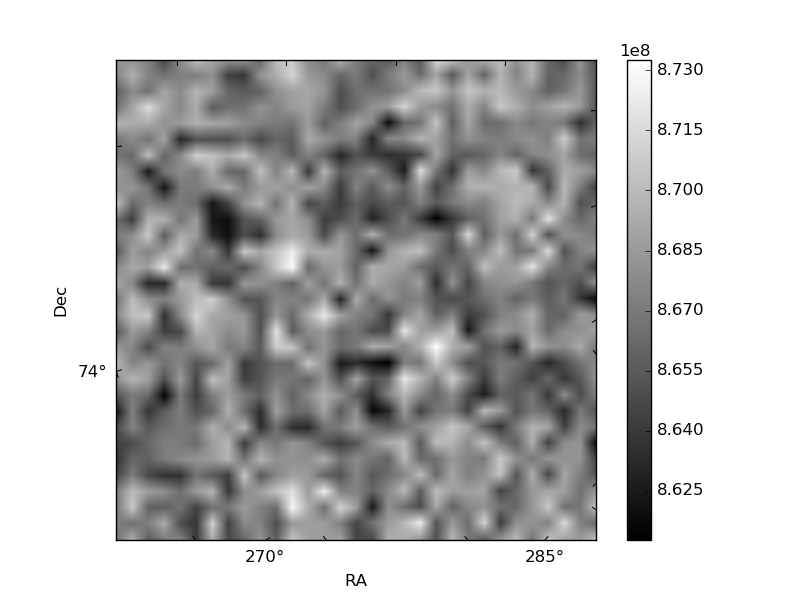
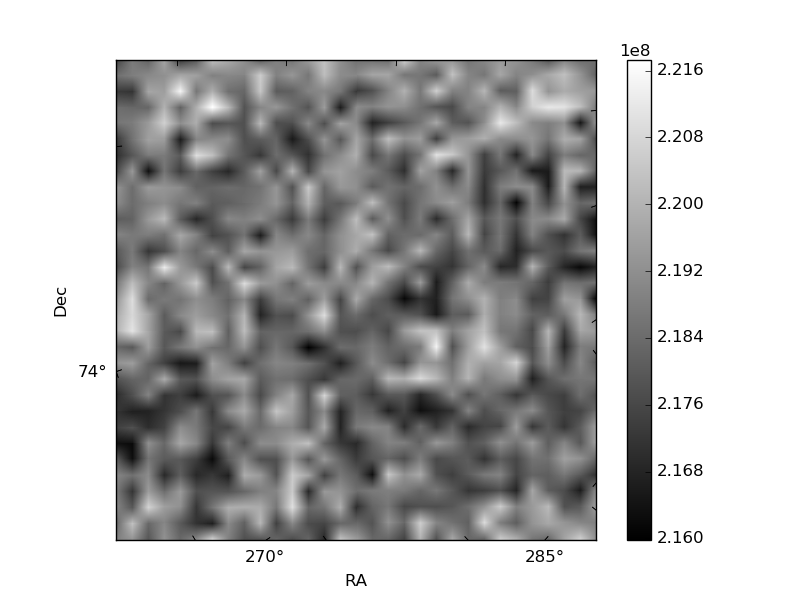
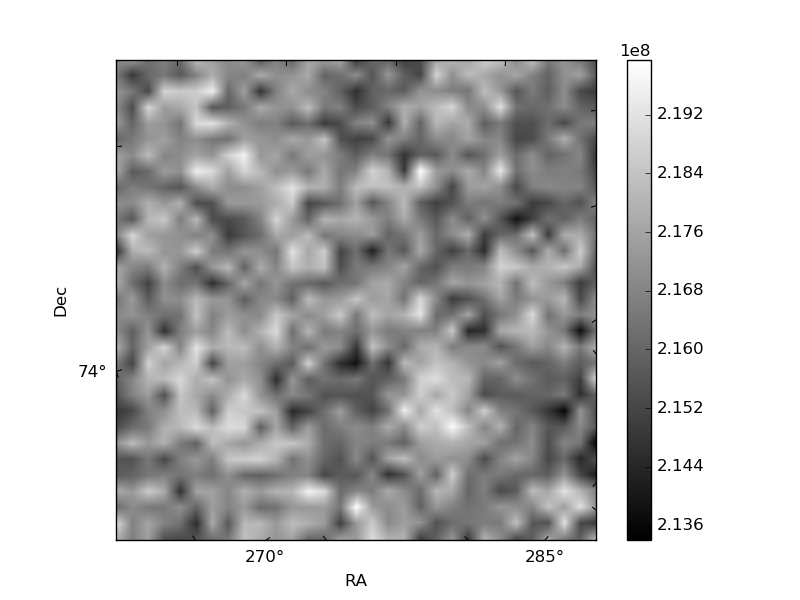
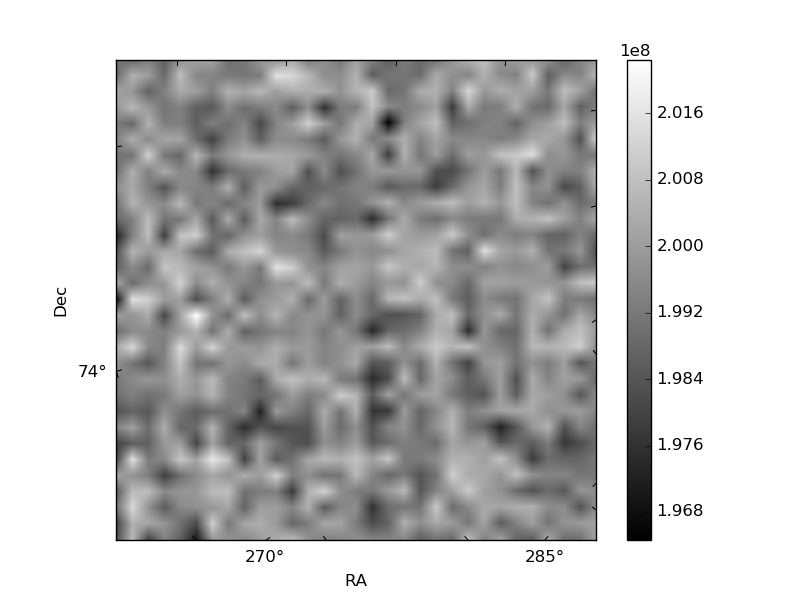
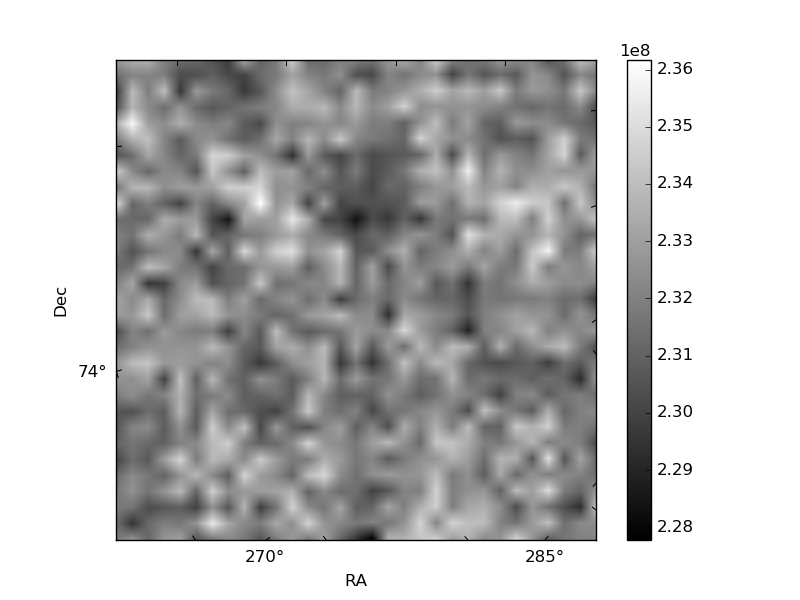
Histogram calculated using DETX and DETY for each event in the final _common_clean file
| Quadrant A | 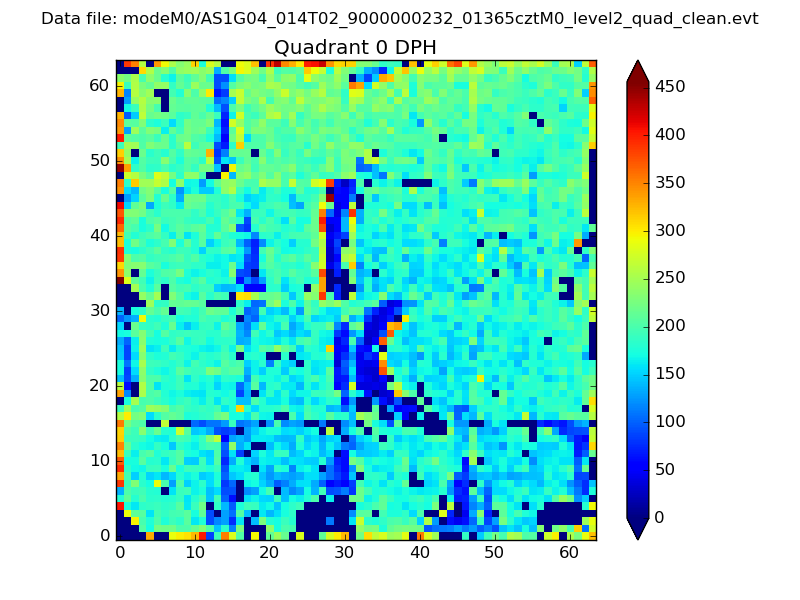 |
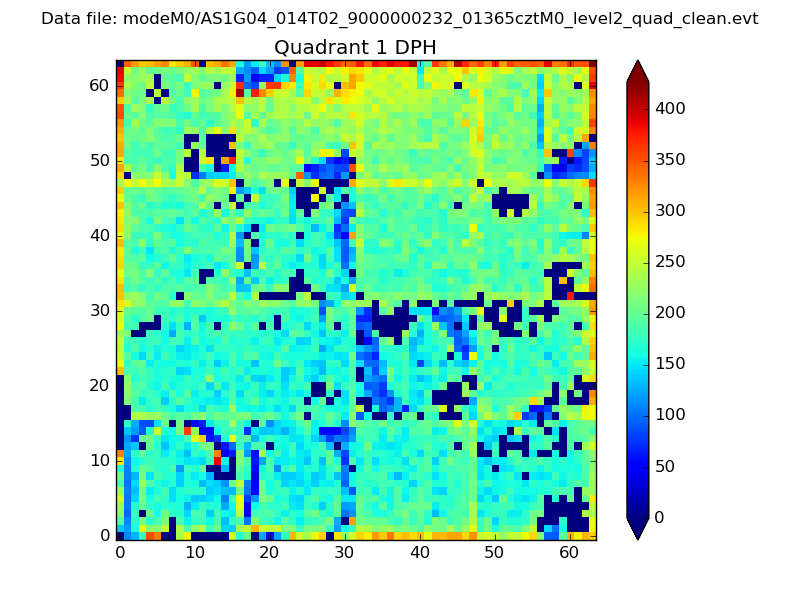 |
Quadrant B |
|---|---|---|---|
| Quadrant D | 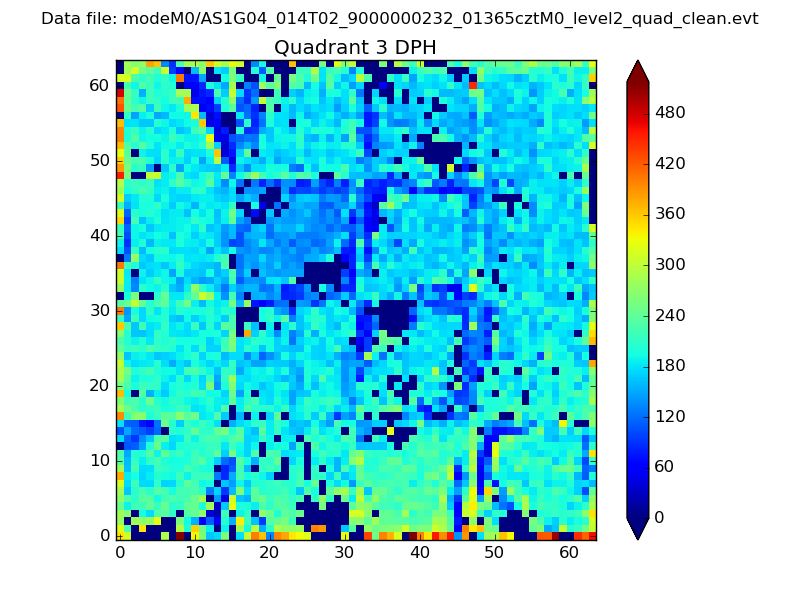 |
 |
Quadrant C |
| Plot type | Count rate plots | Images |
|---|---|---|
| Comparison with Poisson distribution Blue bars denote a histogram of data divided into 1 sec bins. Red curve is a Poisson curve with rate = median count rate of data. |
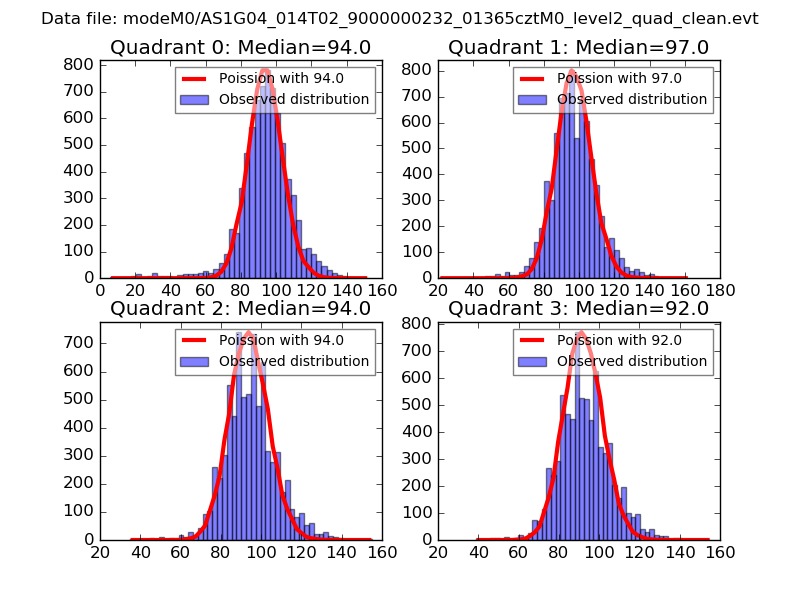 |
 |
| Quadrant-wise count rates Data is divided into 100 sec bins |
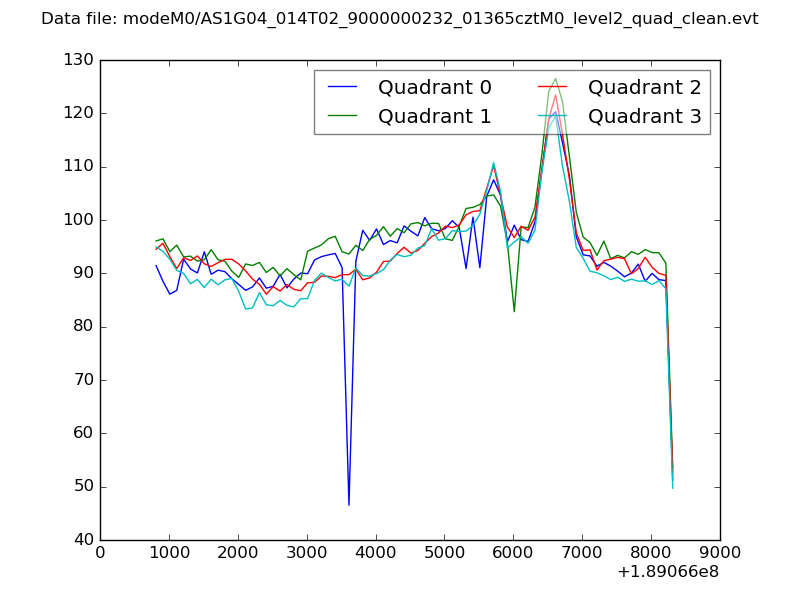 |
|
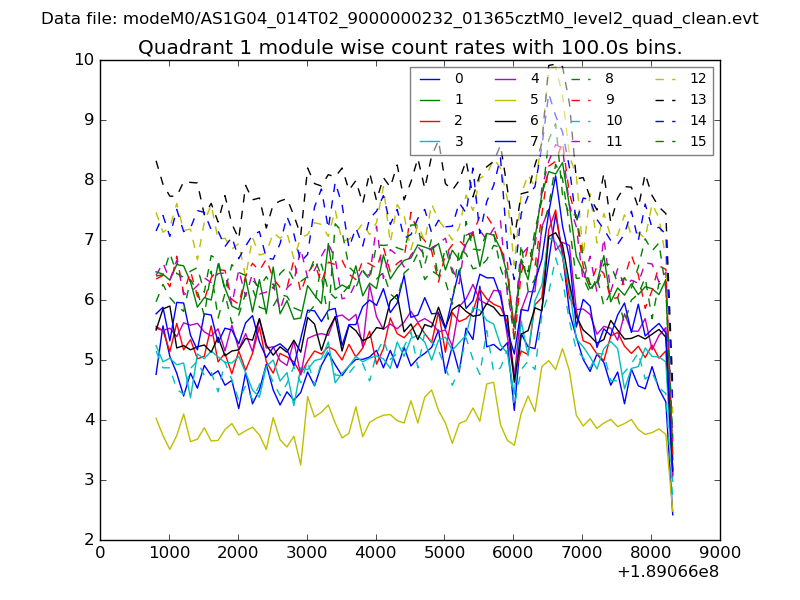
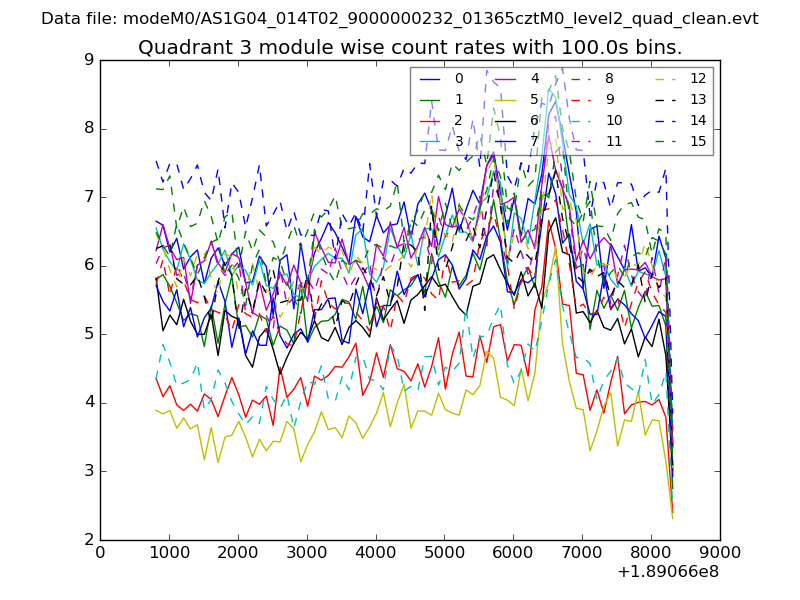
| Module-wise count rates for Quadrant A Data is divided into 100 sec bins |
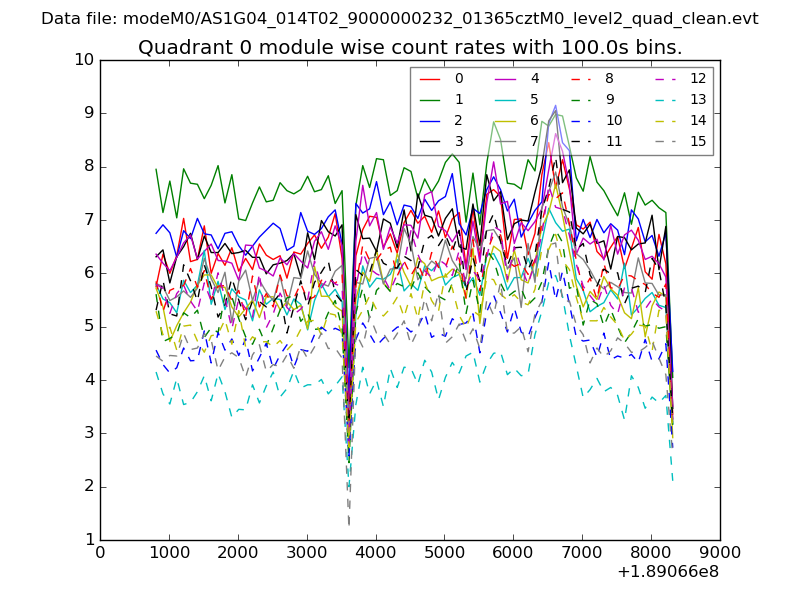 |
 |
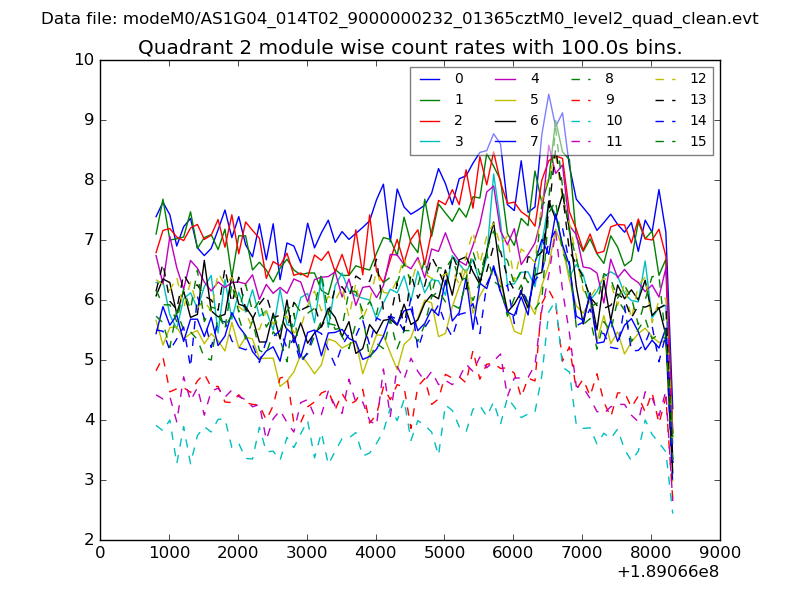
| Module-wise count rates for Quadrant B Data is divided into 100 sec bins |
 |
 |
| Module-wise count rates for Quadrant C Data is divided into 100 sec bins |
 |
 |
| Module-wise count rates for Quadrant D Data is divided into 100 sec bins |
 |
 |
| Parameter | Plot |
|---|---|
| CZT HV Monitor | 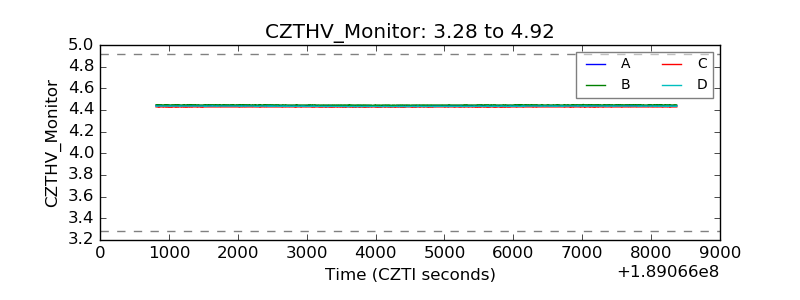 |
| D_VDD | 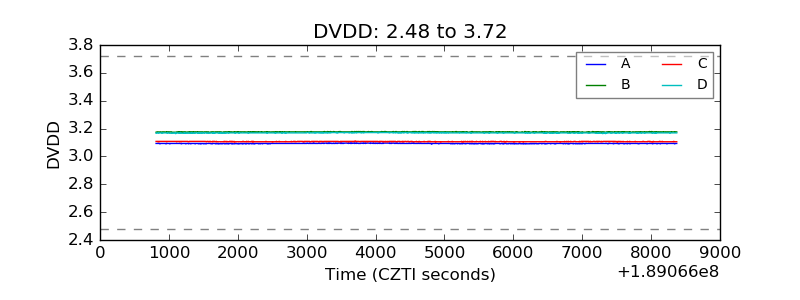 |
| Temperature 1 | 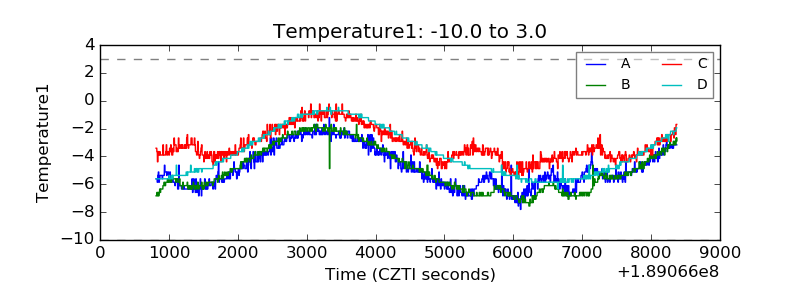 |
| Veto HV Monitor | 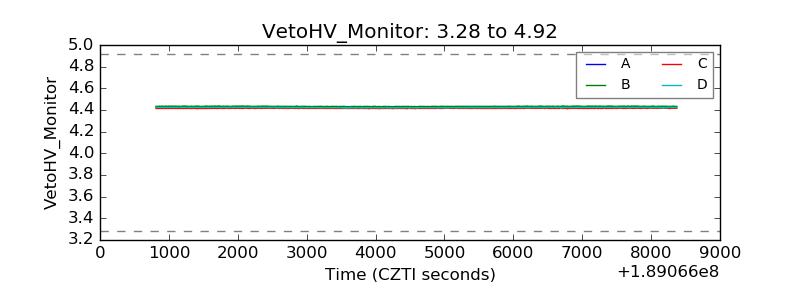 |
| Veto LLD | 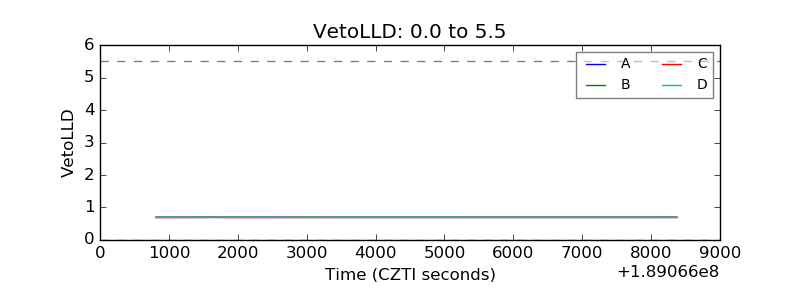 |
| Alpha Counter | 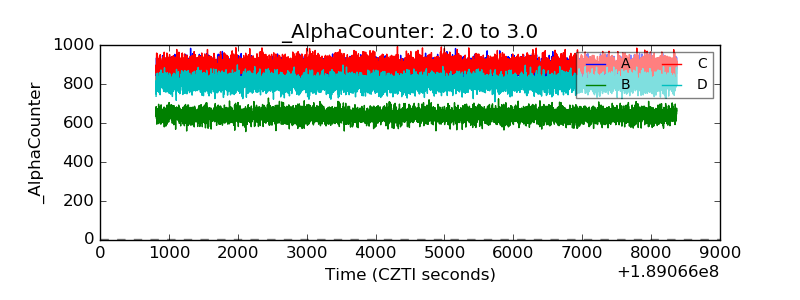 |
| _CPM_Rate | 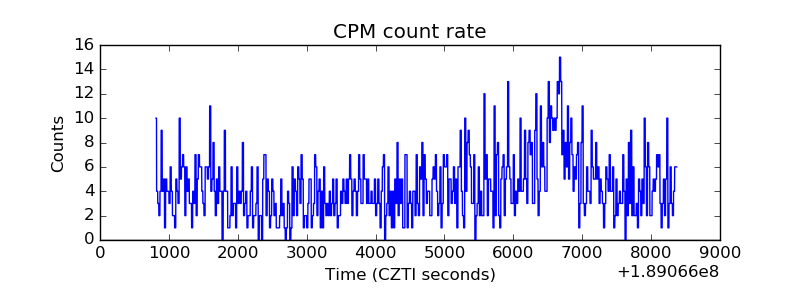 |
| CZT Counter | 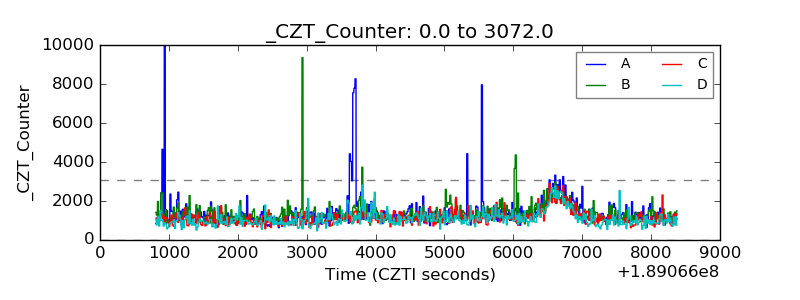 |
| +2.5 Volts monitor | 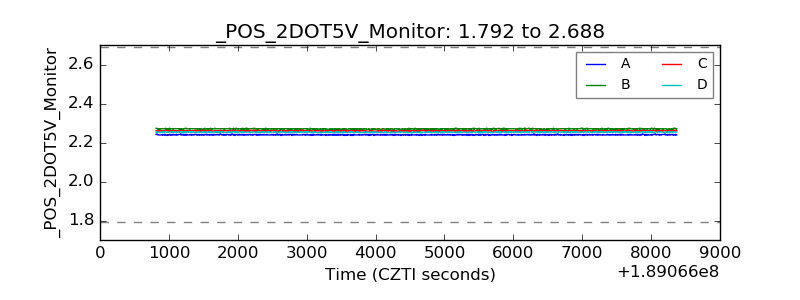 |
| +5 Volts monitor | 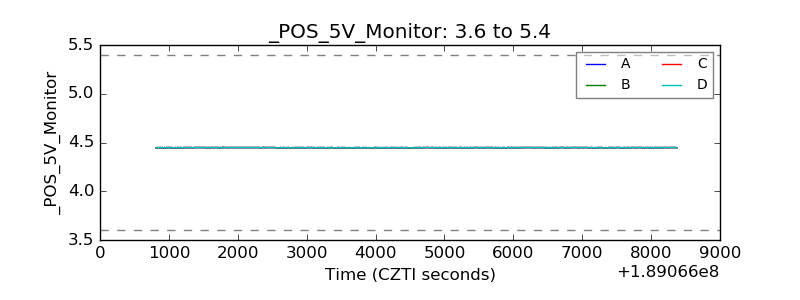 |
| _ROLL_ROT | 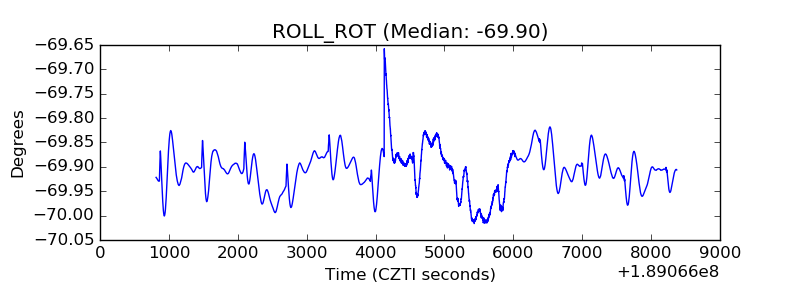 |
| _Roll_DEC | 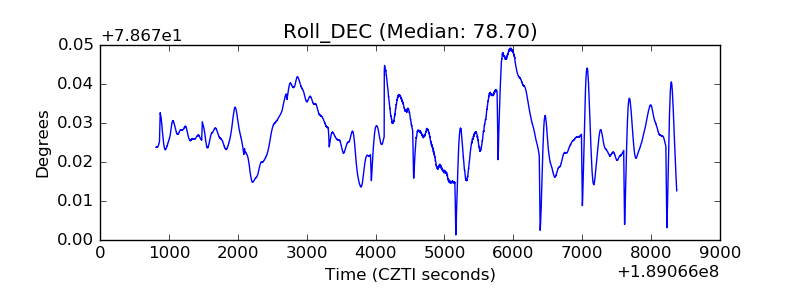 |
| _Roll_RA | 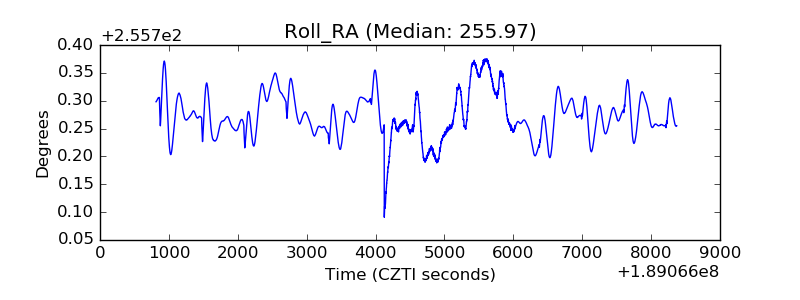 |
| Veto Counter | 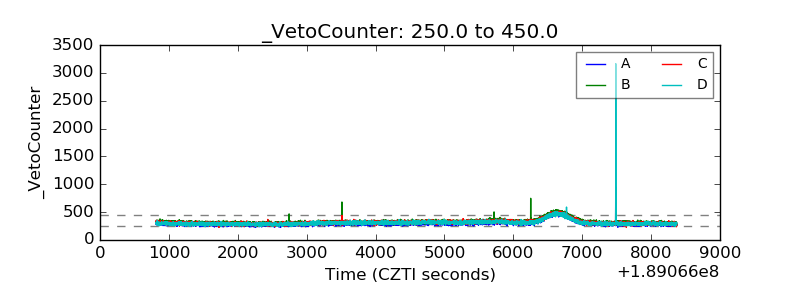 |