| Param | Original file | Final file |
|---|---|---|
| Filename | modeM0/AS1G04_014T02_9000000232_01367cztM0_level2.evt | modeM0/AS1G04_014T02_9000000232_01367cztM0_level2_quad_clean.evt |
| Size (bytes) | 1,133,968,320 | 102,533,760 |
| Size | 1.1 GB | 97.8 MB |
| Events in quadrant A | 8,551,036 | 667,295 |
| Events in quadrant B | 9,442,214 | 665,916 |
| Events in quadrant C | 8,241,030 | 648,577 |
| Events in quadrant D | 7,648,653 | 640,225 |
| Mode SS | |||
|---|---|---|---|
| Quadrant | BADHDUFLAG | Total packets | Discarded packets |
| A | 0 | 140 | 0 |
| B | 0 | 140 | 0 |
| C | 0 | 140 | 0 |
| D | 0 | 140 | 0 |
| Mode M0 | |||
|---|---|---|---|
| Quadrant | BADHDUFLAG | Total packets | Discarded packets |
| A | 0 | 30297 | 2 |
| B | 0 | 33001 | 1 |
| C | 0 | 29415 | 1 |
| D | 0 | 27668 | 1 |
| Mode M9 | |||
|---|---|---|---|
| Quadrant | BADHDUFLAG | Total packets | Discarded packets |
| A | 0 | 4 | 0 |
| B | 0 | 4 | 0 |
| C | 0 | 4 | 0 |
| D | 0 | 4 | 0 |
| Quadrant | Total seconds | Saturated seconds | Saturation percentage |
|---|---|---|---|
| A | 6940 | 53 | 0.763689% |
| B | 6940 | 113 | 1.628242% |
| C | 6940 | 48 | 0.691643% |
| D | 6940 | 60 | 0.864553% |
Noise dominated data is calculated using 1-second bins in cleaned event files. If a bin has >2000 counts, and if more than 50% of those come from <1% of pixels, then it is considered to be noise-dominated and hence unusable.
| Quadrant | # 1 sec bins | Bins with >0 counts | Bins with >2000 counts | High rate bins dominated by noise | Noise dominated (total time) | Noise dominated (detector-on time) | Marked lightcurve |
|---|---|---|---|---|---|---|---|
| A | 7315 | 6940 | 265 | 265 | 3.62% | 3.82% | 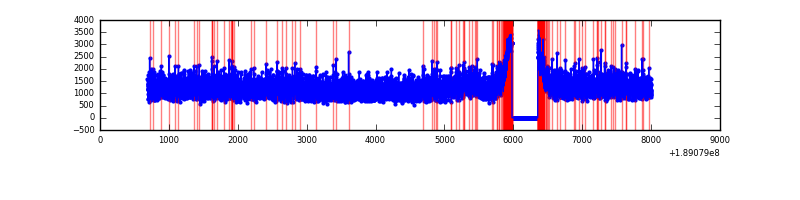 |
| B | 7315 | 6940 | 534 | 534 | 7.30% | 7.69% | 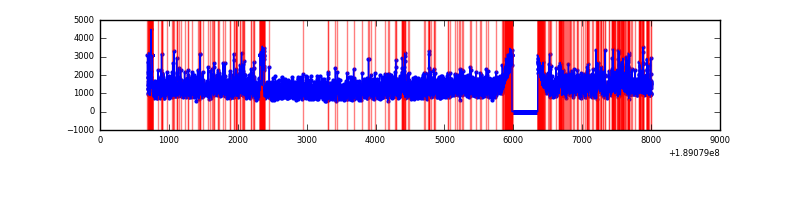 |
| C | 7315 | 6940 | 223 | 223 | 3.05% | 3.21% | 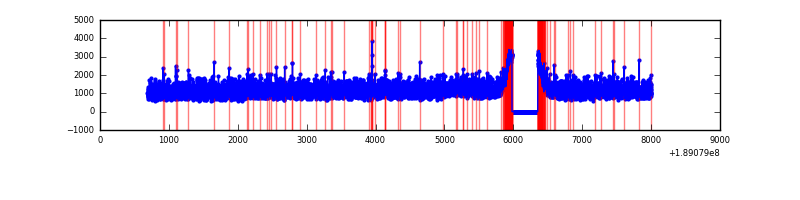 |
| D | 7315 | 6940 | 192 | 192 | 2.62% | 2.77% | 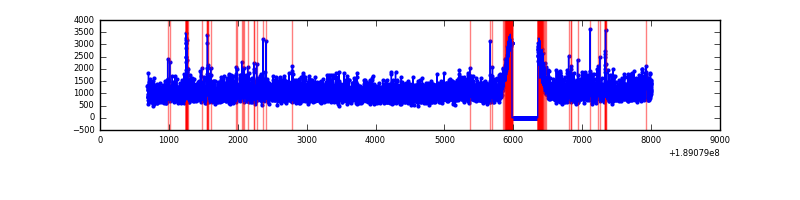 |
Top three noisy pixels from each quadrant. If the there are fewer than three noisy pixels in the level2.evt file, extra rows are filled as -1
| Pixel properties | Quadrant properties | ||||||
|---|---|---|---|---|---|---|---|
| Quadrant | DetID | PixID | Counts | Sigma | Mean | Median | Sigma |
| A | 15 | 127 | 176565 | 333.11 | 2164 | 2177 | 523.5 |
| A | 12 | 243 | 49638 | 90.66 | 2164 | 2177 | 523.5 |
| A | 4 | 32 | 20458 | 34.92 | 2164 | 2177 | 523.5 |
| B | 8 | 4 | 365649 | 695.16 | 2209 | 2222 | 522.8 |
| B | 12 | 52 | 237176 | 449.42 | 2209 | 2222 | 522.8 |
| B | 5 | 191 | 235260 | 445.75 | 2209 | 2222 | 522.8 |
| C | 15 | 241 | 233064 | 406.73 | 2027 | 2101 | 567.9 |
| C | 3 | 79 | 34841 | 57.66 | 2027 | 2101 | 567.9 |
| C | 3 | 111 | 30869 | 50.66 | 2027 | 2101 | 567.9 |
| D | 13 | 73 | 69686 | 108.43 | 1992 | 2065 | 623.6 |
| D | 10 | 125 | 54574 | 84.2 | 1992 | 2065 | 623.6 |
| D | 1 | 83 | 41938 | 63.94 | 1992 | 2065 | 623.6 |
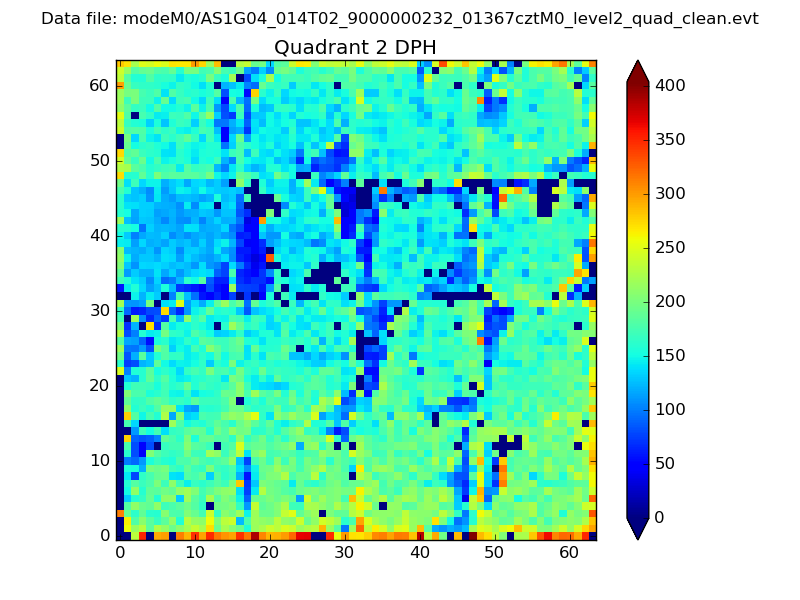
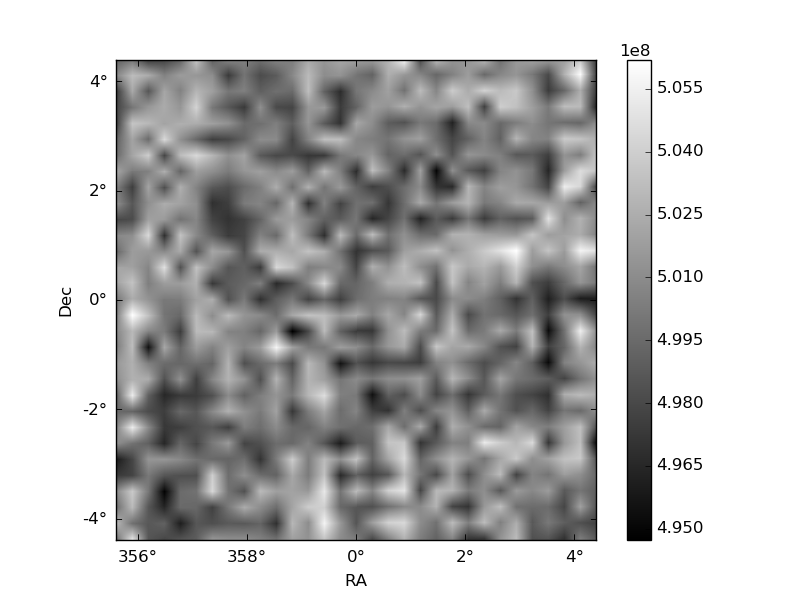
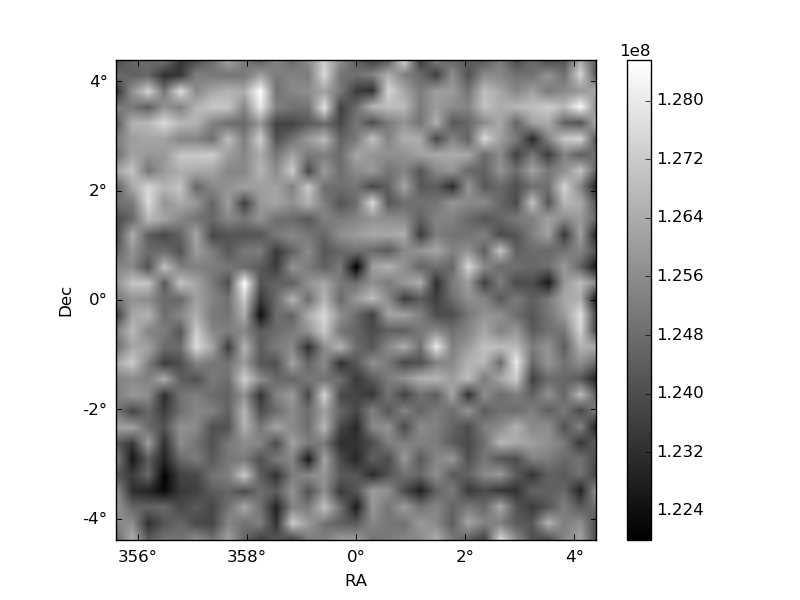
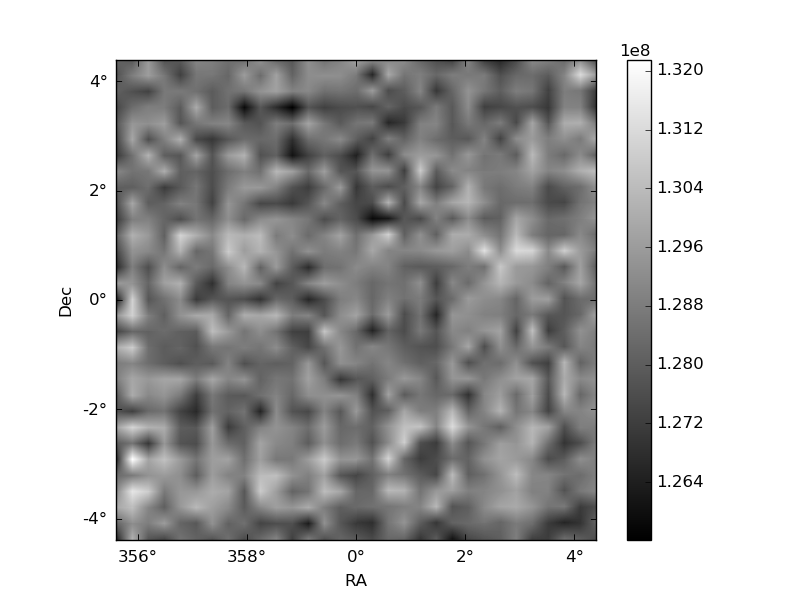
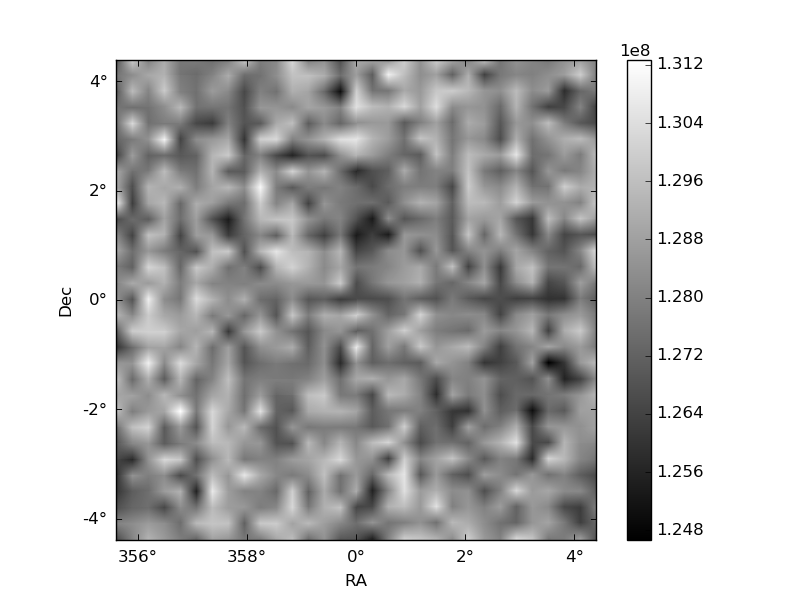
Histogram calculated using DETX and DETY for each event in the final _common_clean file
| Quadrant A | 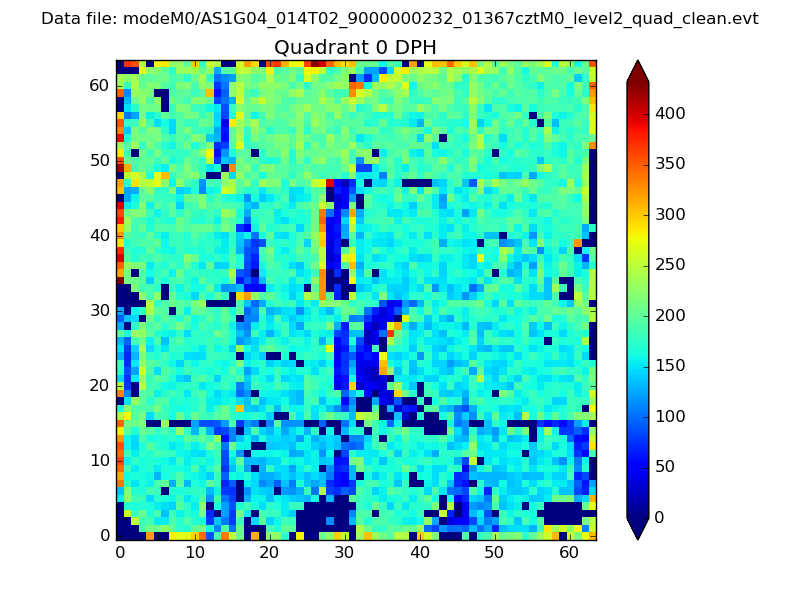 |
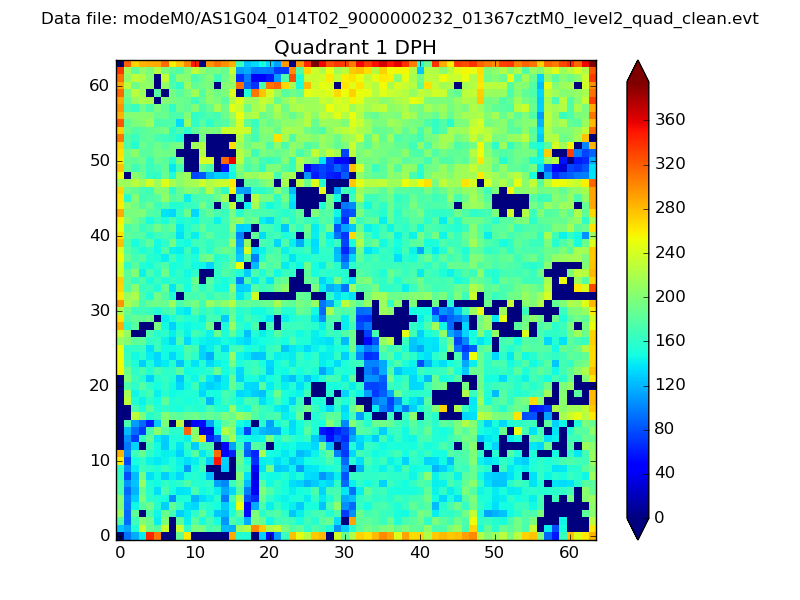 |
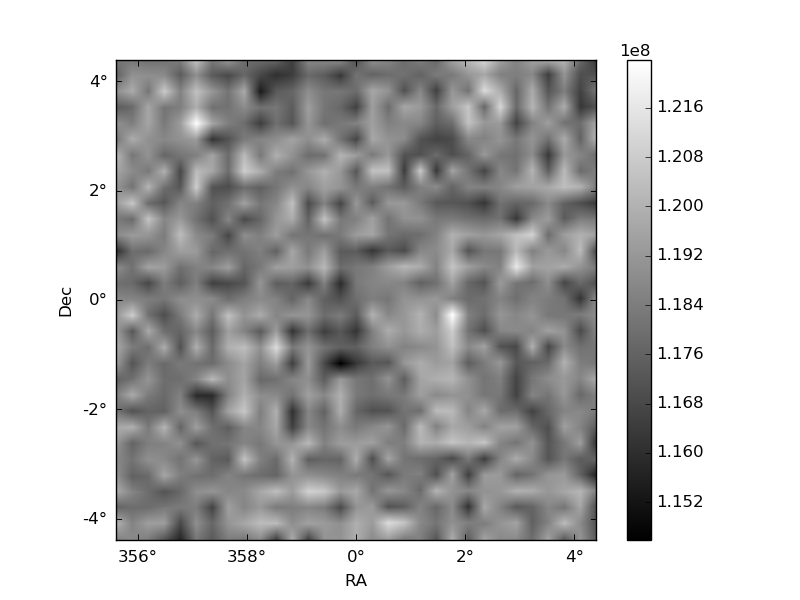
Quadrant B |
|---|---|---|---|
| Quadrant D | 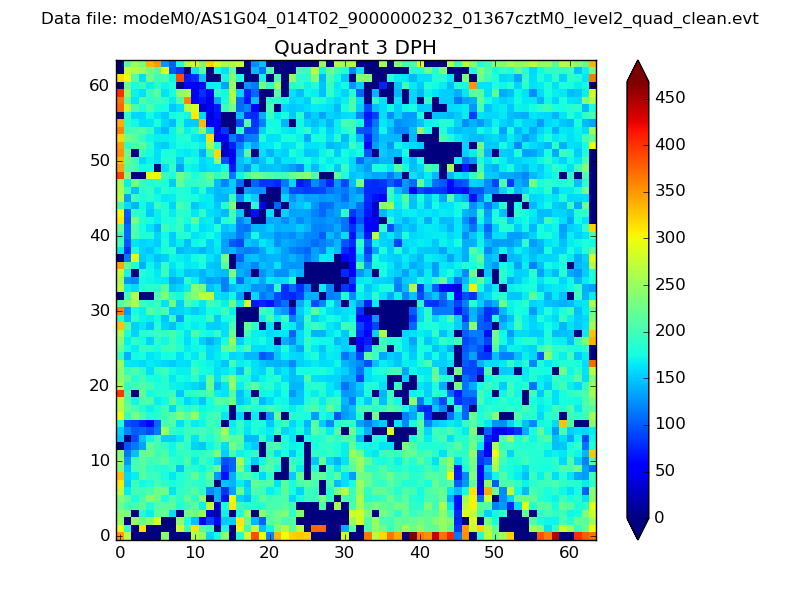 |
 |
Quadrant C |
| Plot type | Count rate plots | Images |
|---|---|---|
| Comparison with Poisson distribution Blue bars denote a histogram of data divided into 1 sec bins. Red curve is a Poisson curve with rate = median count rate of data. |
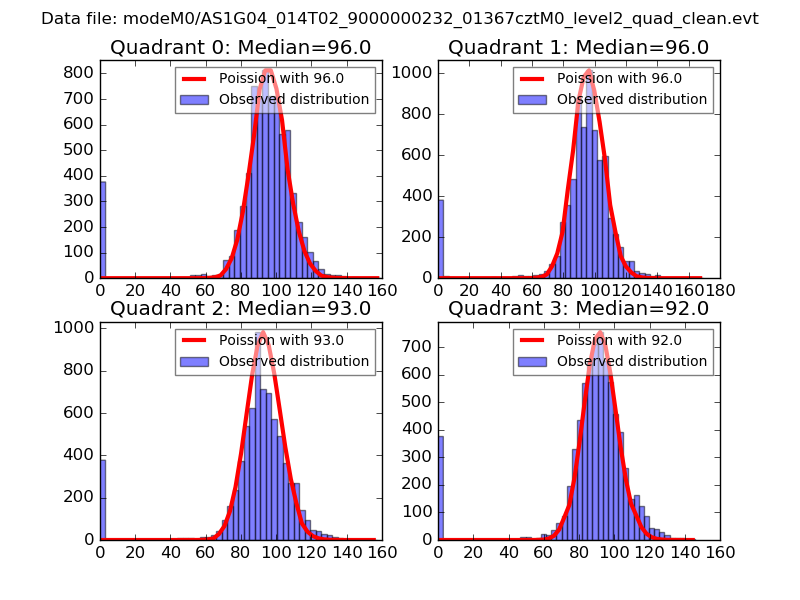 |
 |
| Quadrant-wise count rates Data is divided into 100 sec bins |
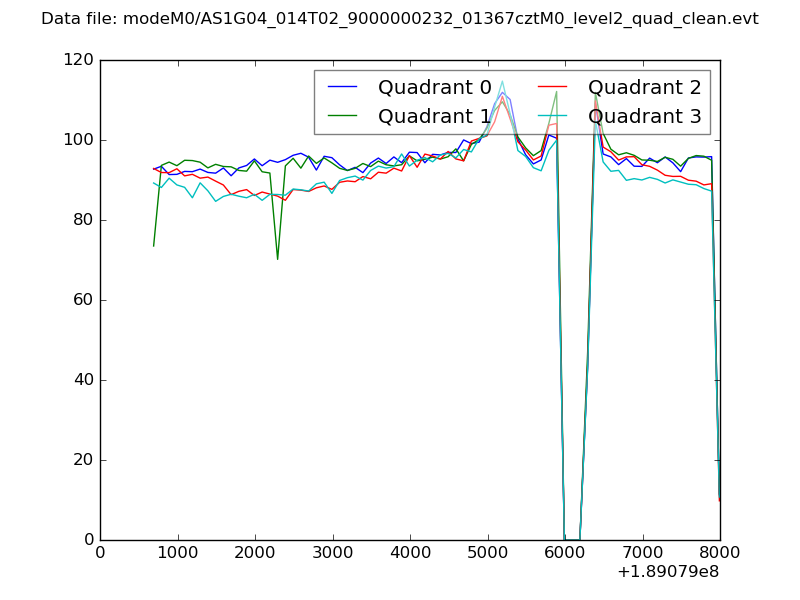 |
|
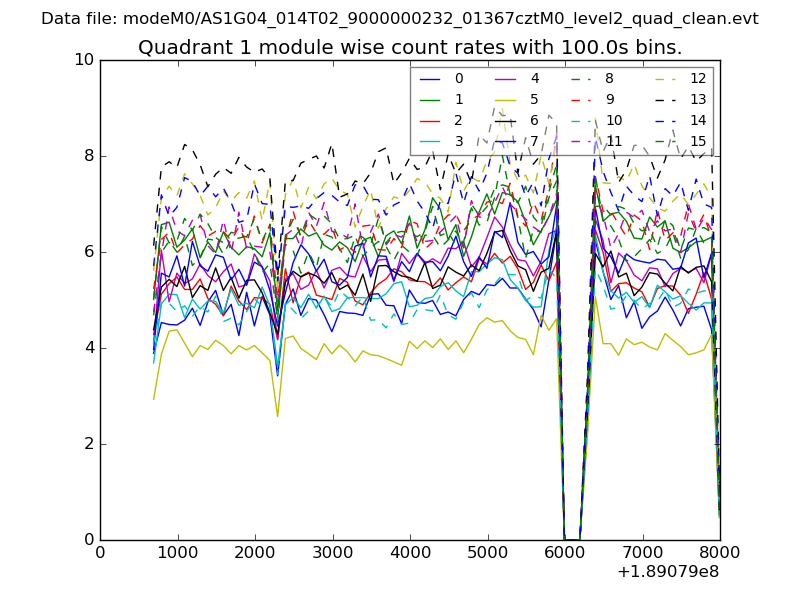
| Module-wise count rates for Quadrant A Data is divided into 100 sec bins |
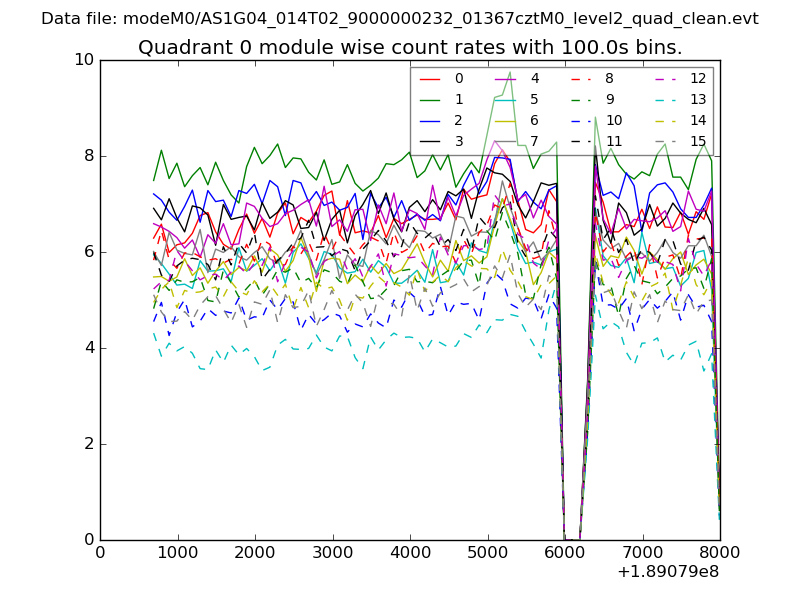 |
 |
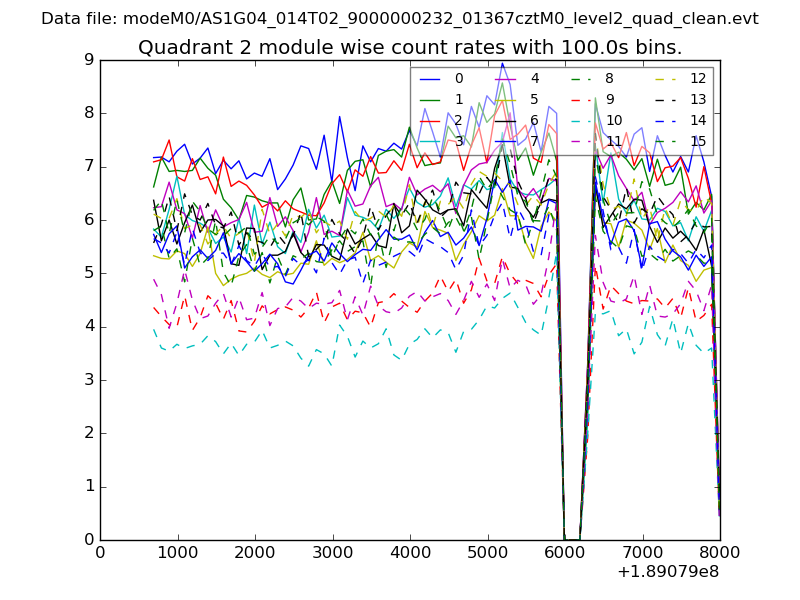
| Module-wise count rates for Quadrant B Data is divided into 100 sec bins |
 |
 |
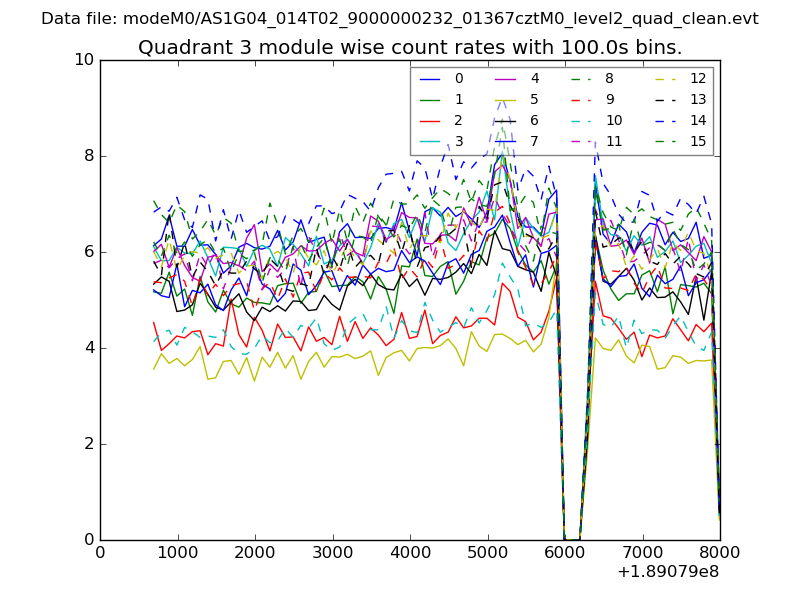
| Module-wise count rates for Quadrant C Data is divided into 100 sec bins |
 |
 |
| Module-wise count rates for Quadrant D Data is divided into 100 sec bins |
 |
 |
| Parameter | Plot |
|---|---|
| CZT HV Monitor | 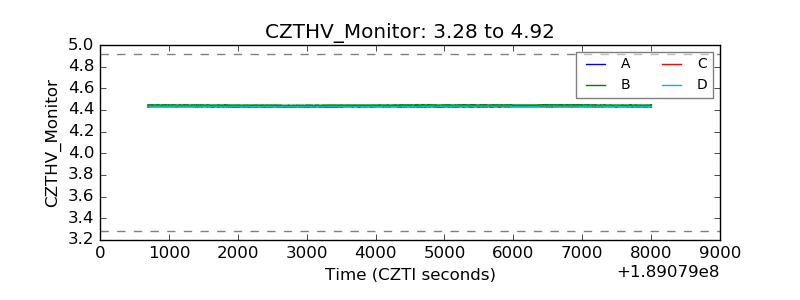 |
| D_VDD | 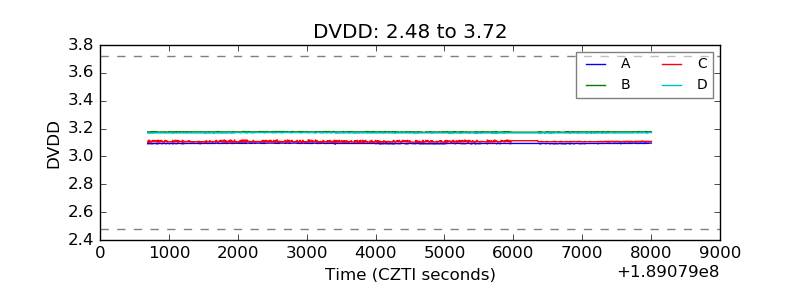 |
| Temperature 1 | 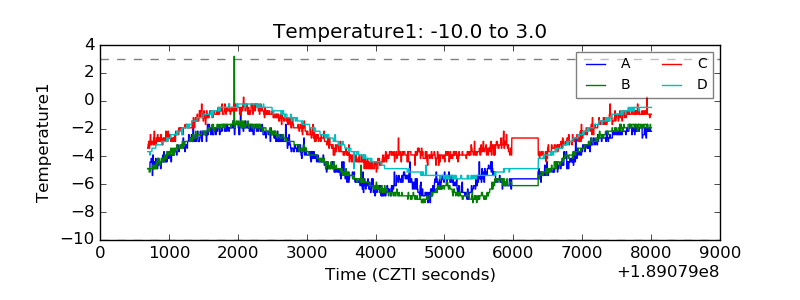 |
| Veto HV Monitor | 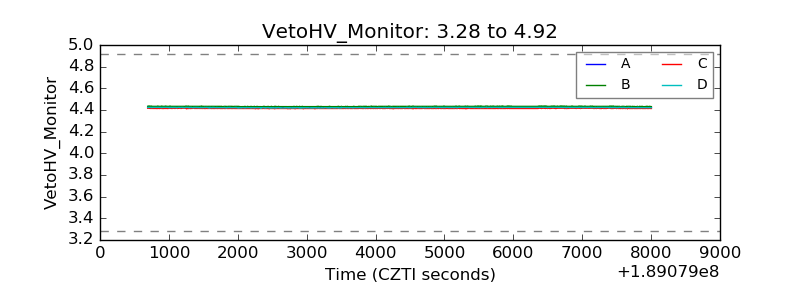 |
| Veto LLD | 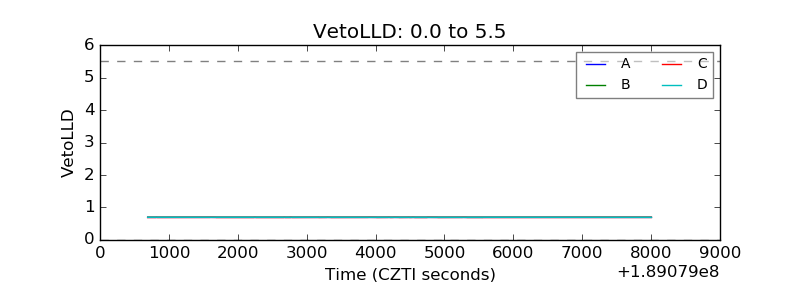 |
| Alpha Counter | 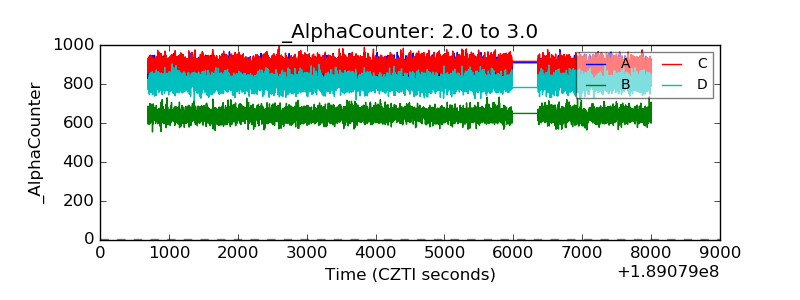 |
| _CPM_Rate | 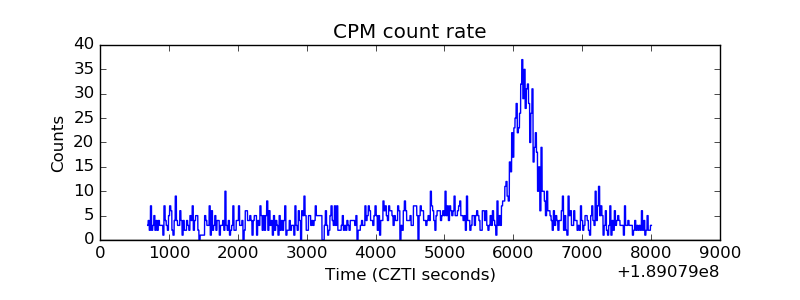 |
| CZT Counter | 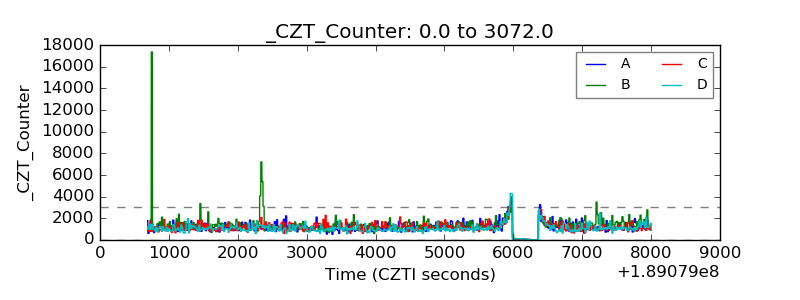 |
| +2.5 Volts monitor |  |
| +5 Volts monitor |  |
| _ROLL_ROT | 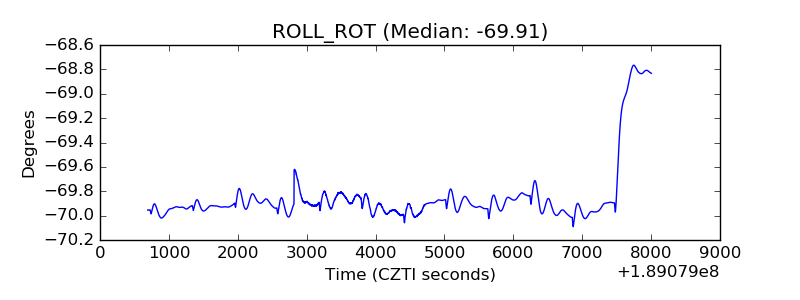 |
| _Roll_DEC | 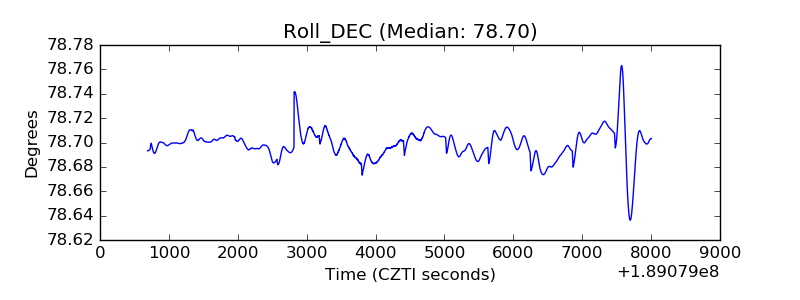 |
| _Roll_RA | 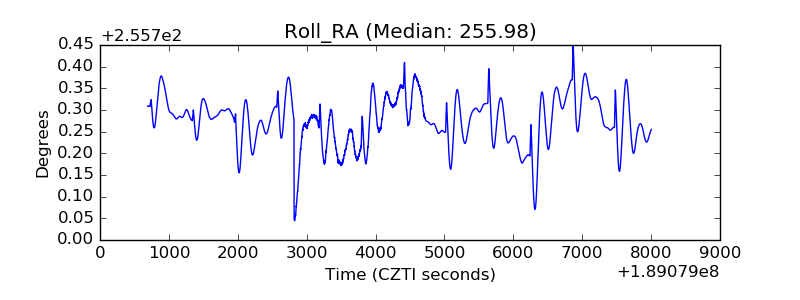 |
| Veto Counter | 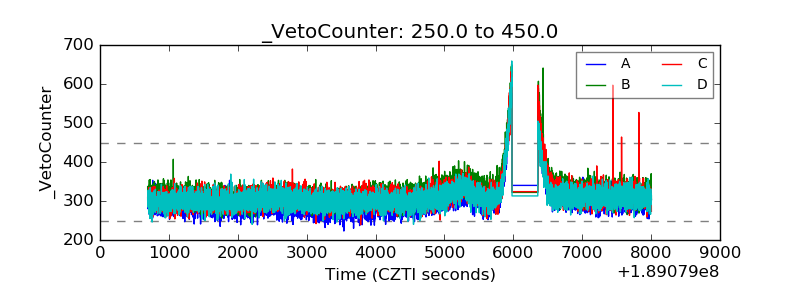 |