| Param | Original file | Final file |
|---|---|---|
| Filename | modeM0/AS1G04_014T02_9000000232_01368cztM0_level2.evt | modeM0/AS1G04_014T02_9000000232_01368cztM0_level2_quad_clean.evt |
| Size (bytes) | 1,166,788,800 | 100,149,120 |
| Size | 1.1 GB | 95.5 MB |
| Events in quadrant A | 8,635,722 | 653,428 |
| Events in quadrant B | 9,646,775 | 652,522 |
| Events in quadrant C | 8,420,070 | 632,364 |
| Events in quadrant D | 8,185,025 | 621,459 |
| Mode SS | |||
|---|---|---|---|
| Quadrant | BADHDUFLAG | Total packets | Discarded packets |
| A | 0 | 138 | 0 |
| B | 0 | 138 | 0 |
| C | 0 | 138 | 0 |
| D | 0 | 138 | 0 |
| Mode M0 | |||
|---|---|---|---|
| Quadrant | BADHDUFLAG | Total packets | Discarded packets |
| A | 0 | 30451 | 2 |
| B | 0 | 33466 | 1 |
| C | 0 | 29858 | 1 |
| D | 0 | 29233 | 1 |
| Mode M9 | |||
|---|---|---|---|
| Quadrant | BADHDUFLAG | Total packets | Discarded packets |
| A | 0 | 6 | 0 |
| B | 0 | 6 | 0 |
| C | 0 | 6 | 0 |
| D | 0 | 6 | 0 |
| Quadrant | Total seconds | Saturated seconds | Saturation percentage |
|---|---|---|---|
| A | 6789 | 50 | 0.736485% |
| B | 6789 | 68 | 1.001620% |
| C | 6789 | 58 | 0.854323% |
| D | 6789 | 170 | 2.504051% |
Noise dominated data is calculated using 1-second bins in cleaned event files. If a bin has >2000 counts, and if more than 50% of those come from <1% of pixels, then it is considered to be noise-dominated and hence unusable.
| Quadrant | # 1 sec bins | Bins with >0 counts | Bins with >2000 counts | High rate bins dominated by noise | Noise dominated (total time) | Noise dominated (detector-on time) | Marked lightcurve |
|---|---|---|---|---|---|---|---|
| A | 7359 | 6789 | 331 | 331 | 4.50% | 4.88% |  |
| B | 7359 | 6790 | 701 | 701 | 9.53% | 10.32% | 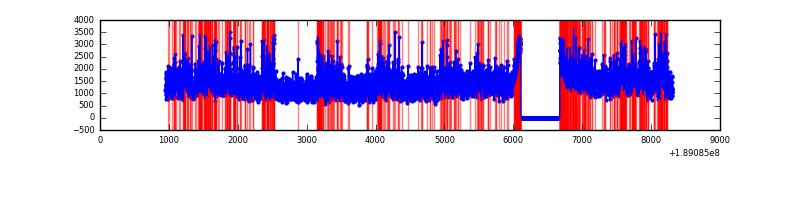 |
| C | 7359 | 6789 | 275 | 275 | 3.74% | 4.05% | 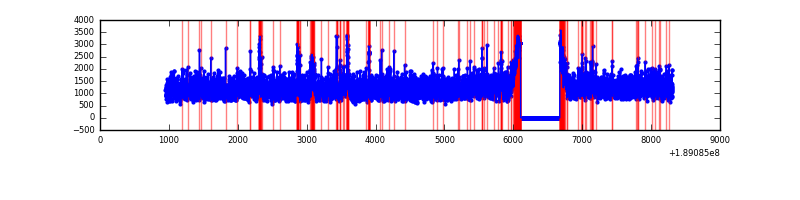 |
| D | 7359 | 6789 | 446 | 446 | 6.06% | 6.57% |  |
Top three noisy pixels from each quadrant. If the there are fewer than three noisy pixels in the level2.evt file, extra rows are filled as -1
| Pixel properties | Quadrant properties | ||||||
|---|---|---|---|---|---|---|---|
| Quadrant | DetID | PixID | Counts | Sigma | Mean | Median | Sigma |
| A | 4 | 32 | 217980 | 420.2 | 2133 | 2147 | 513.6 |
| A | 12 | 243 | 106530 | 203.22 | 2133 | 2147 | 513.6 |
| A | 15 | 127 | 81875 | 155.22 | 2133 | 2147 | 513.6 |
| B | 8 | 4 | 883831 | 1692.29 | 2194 | 2204 | 521.0 |
| B | 12 | 52 | 249262 | 474.23 | 2194 | 2204 | 521.0 |
| B | 5 | 249 | 51594 | 94.8 | 2194 | 2204 | 521.0 |
| C | 15 | 241 | 225254 | 398.69 | 2000 | 2073 | 559.8 |
| C | 9 | 52 | 154448 | 272.2 | 2000 | 2073 | 559.8 |
| C | 7 | 220 | 79859 | 138.96 | 2000 | 2073 | 559.8 |
| D | 13 | 73 | 465788 | 759.95 | 1949 | 2023 | 610.3 |
| D | 9 | 53 | 340917 | 555.33 | 1949 | 2023 | 610.3 |
| D | 10 | 125 | 35664 | 55.13 | 1949 | 2023 | 610.3 |
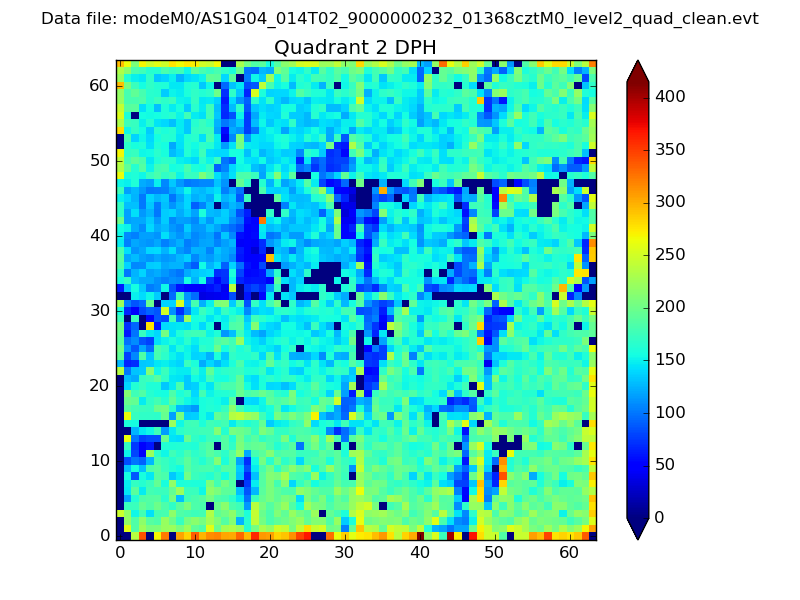
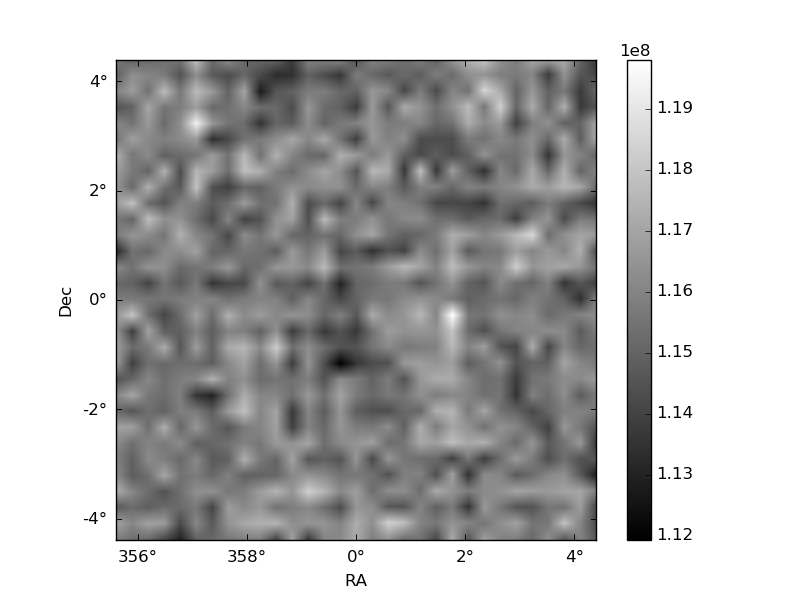
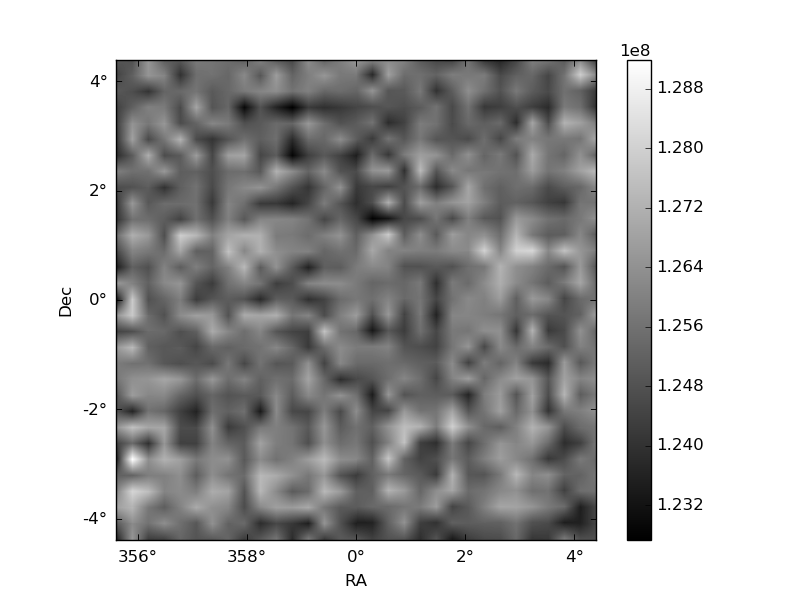
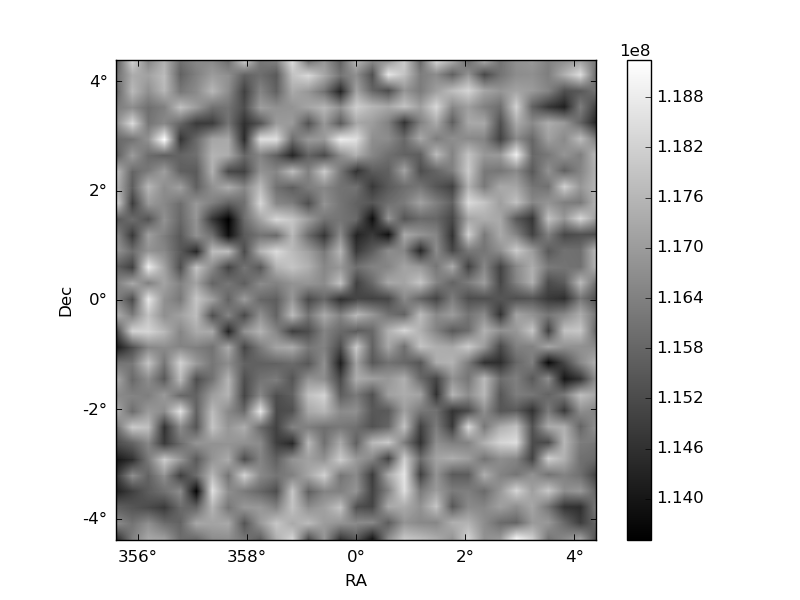
Histogram calculated using DETX and DETY for each event in the final _common_clean file
| Quadrant A | 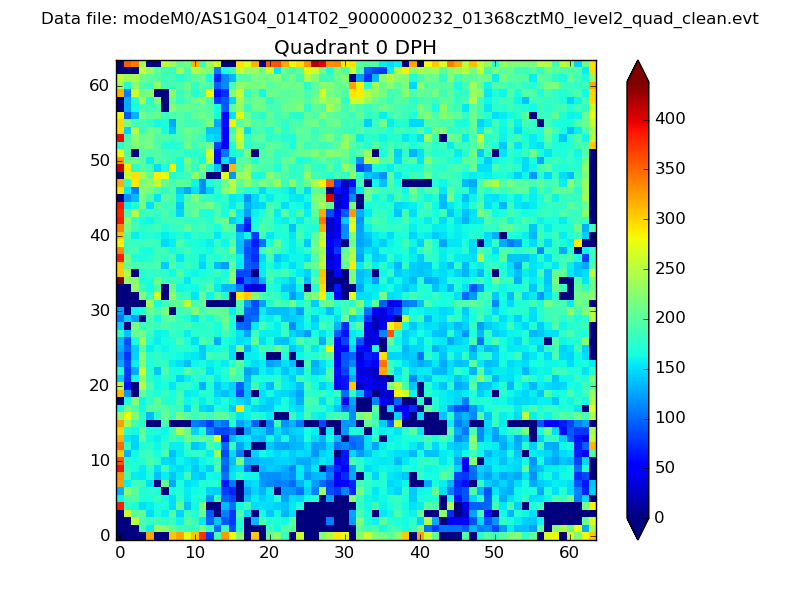 |
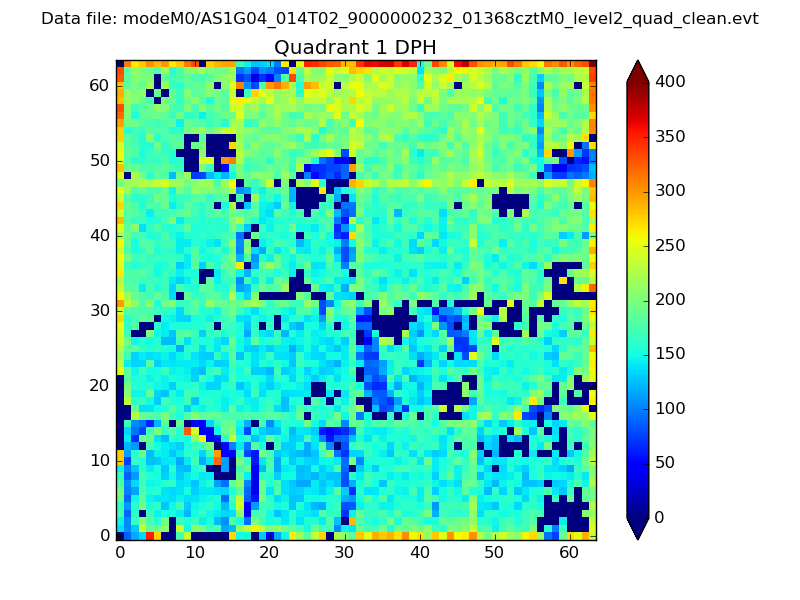 |
Quadrant B |
|---|---|---|---|
| Quadrant D | 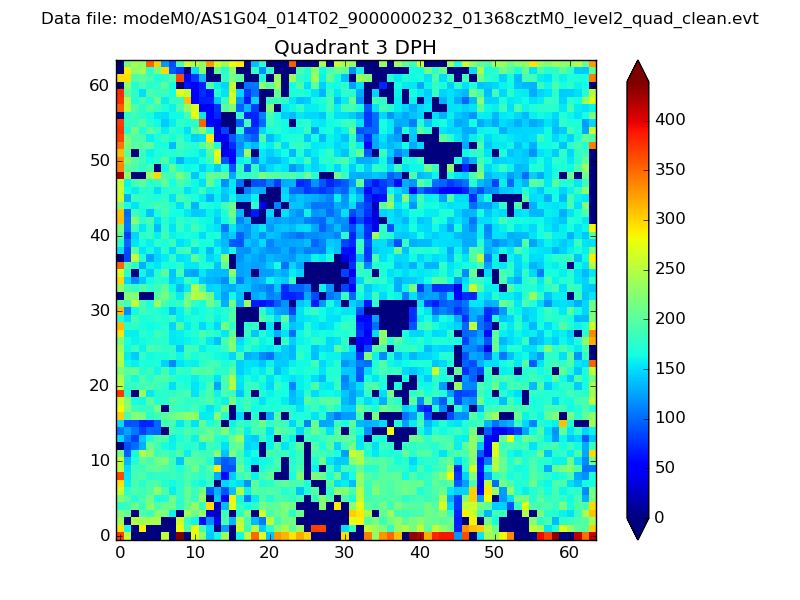 |
 |
Quadrant C |
| Plot type | Count rate plots | Images |
|---|---|---|
| Comparison with Poisson distribution Blue bars denote a histogram of data divided into 1 sec bins. Red curve is a Poisson curve with rate = median count rate of data. |
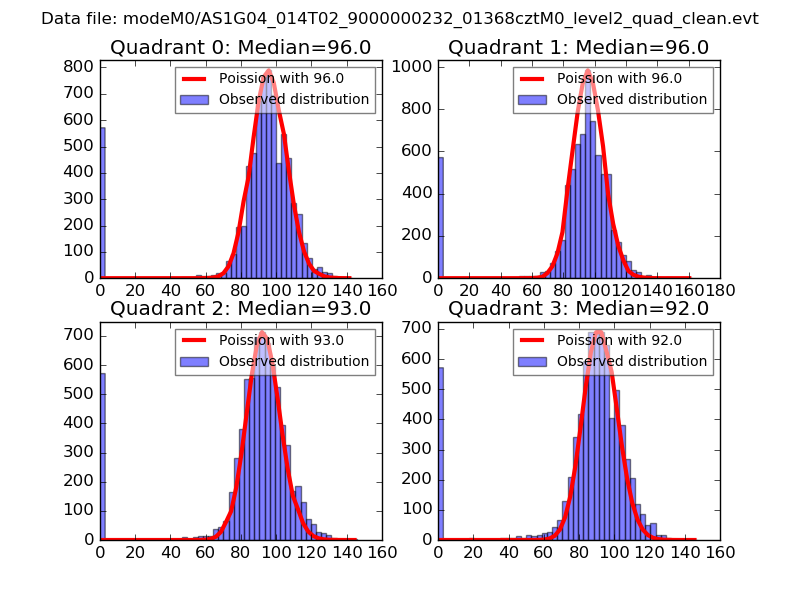 |
 |
| Quadrant-wise count rates Data is divided into 100 sec bins |
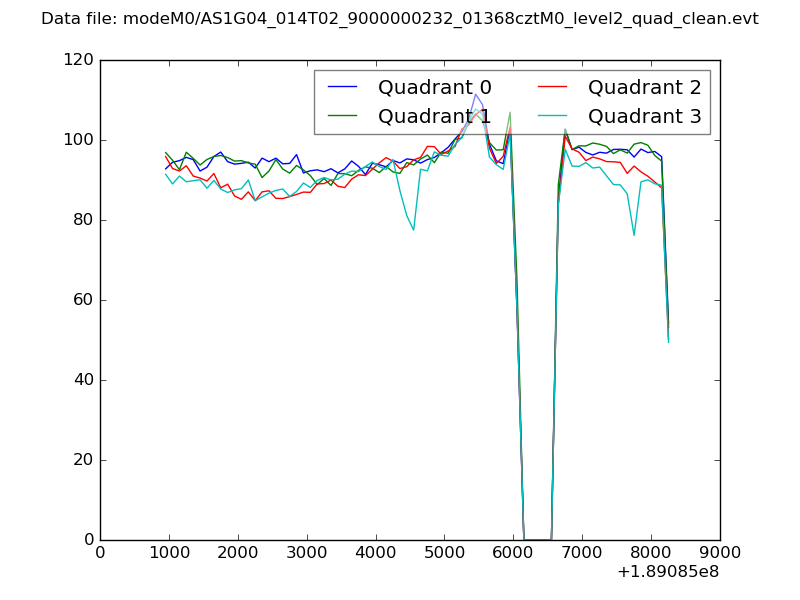 |
|
| Module-wise count rates for Quadrant A Data is divided into 100 sec bins |
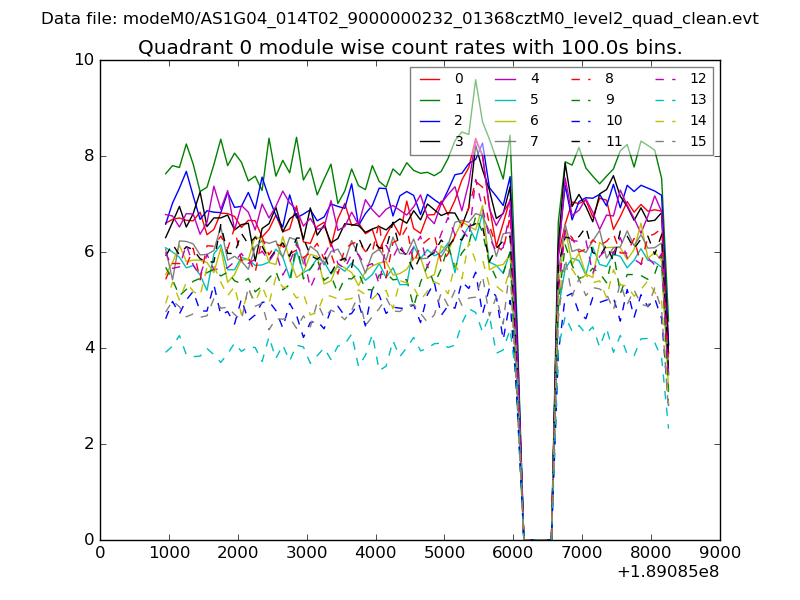 |
 |
| Module-wise count rates for Quadrant B Data is divided into 100 sec bins |
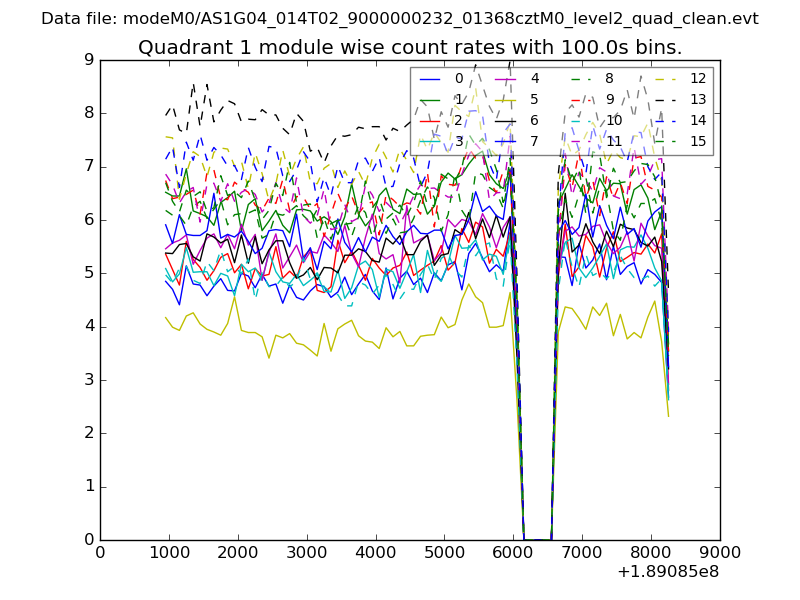 |
 |
| Module-wise count rates for Quadrant C Data is divided into 100 sec bins |
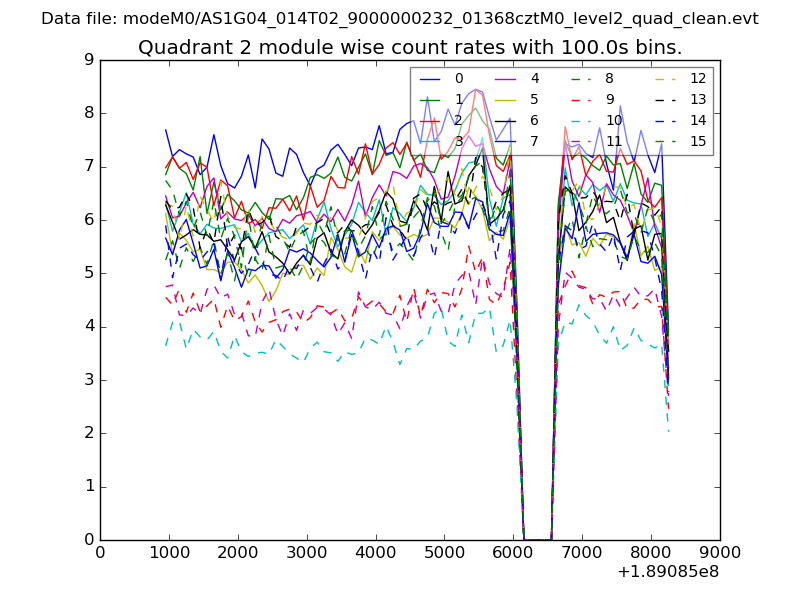 |
 |
| Module-wise count rates for Quadrant D Data is divided into 100 sec bins |
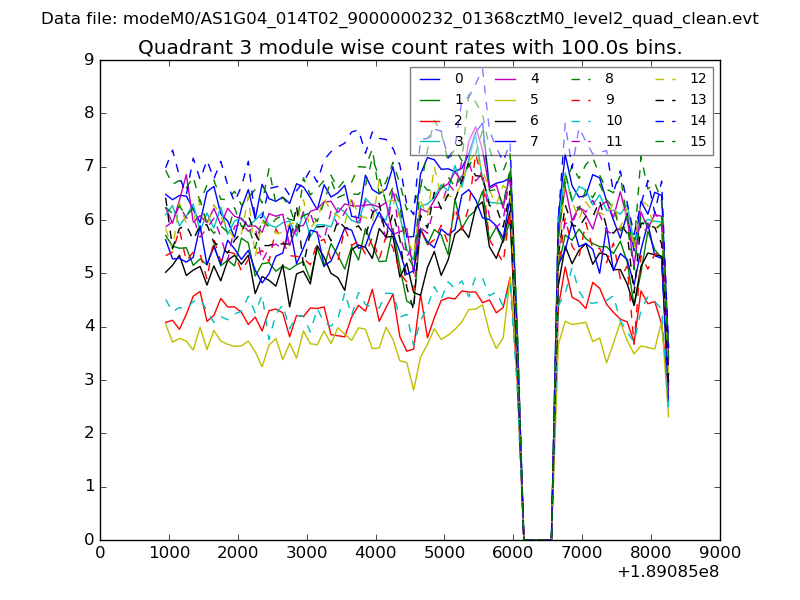 |
 |
| Parameter | Plot |
|---|---|
| CZT HV Monitor | 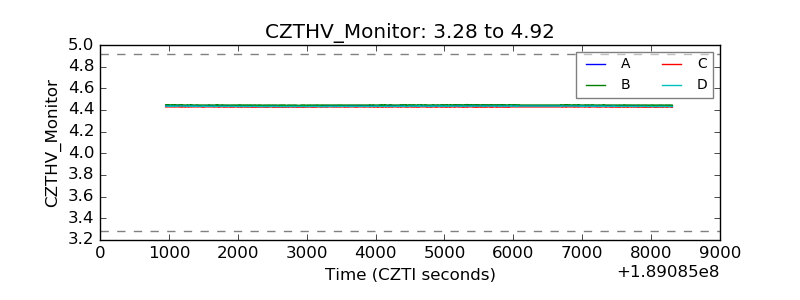 |
| D_VDD | 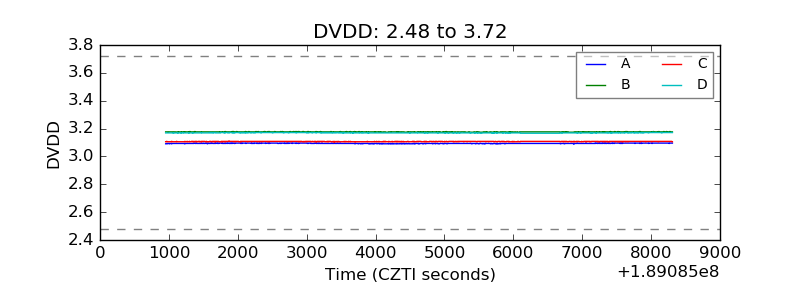 |
| Temperature 1 | 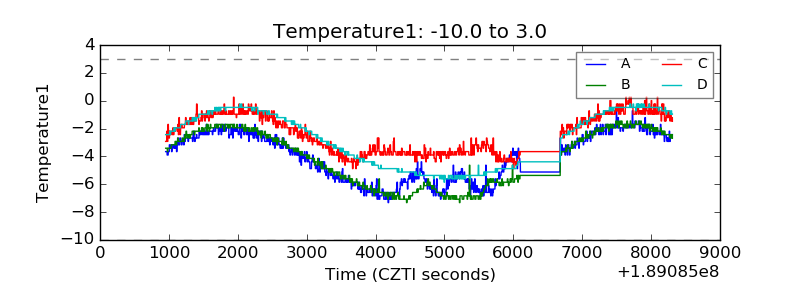 |
| Veto HV Monitor | 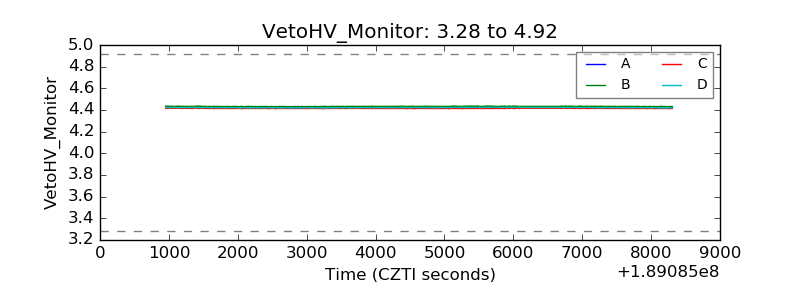 |
| Veto LLD | 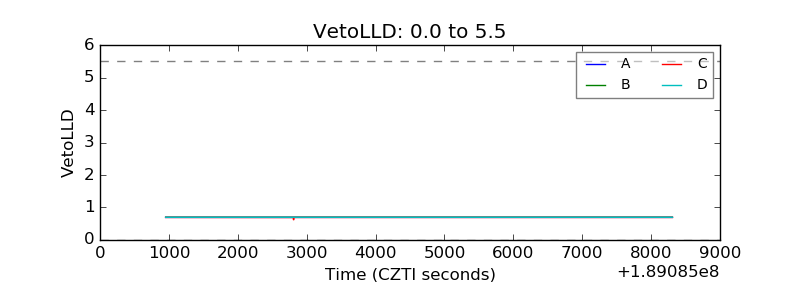 |
| Alpha Counter | 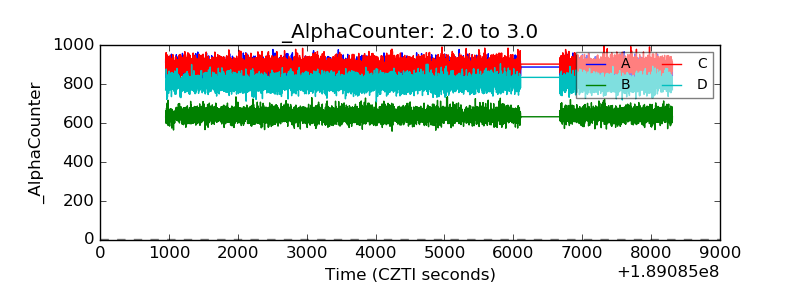 |
| _CPM_Rate | 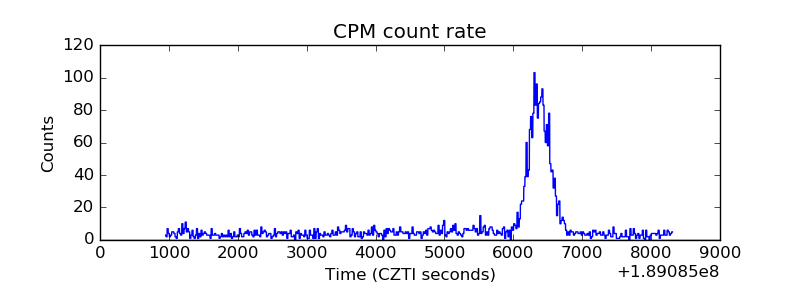 |
| CZT Counter | 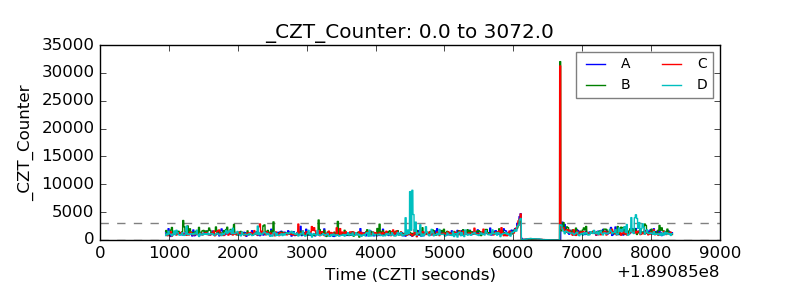 |
| +2.5 Volts monitor |  |
| +5 Volts monitor |  |
| _ROLL_ROT | 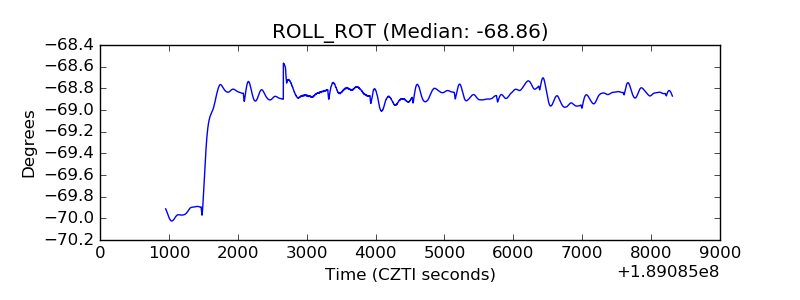 |
| _Roll_DEC | 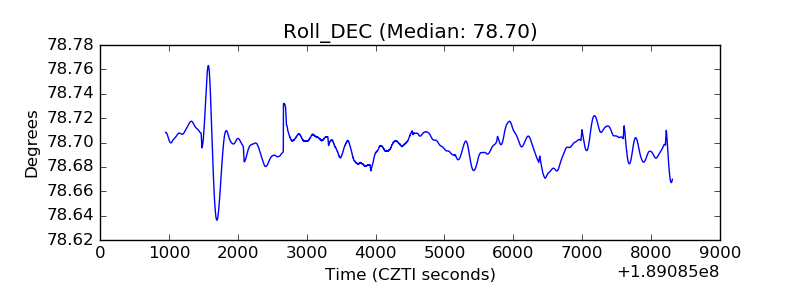 |
| _Roll_RA | 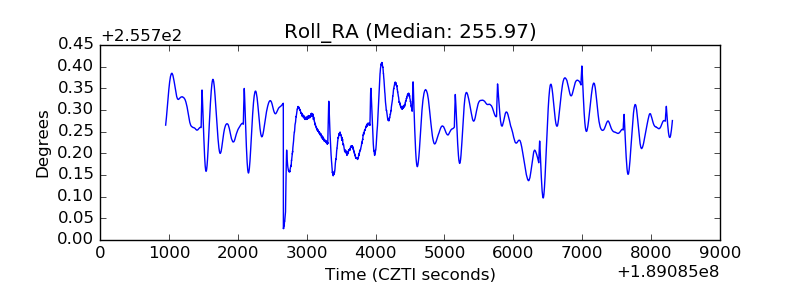 |
| Veto Counter | 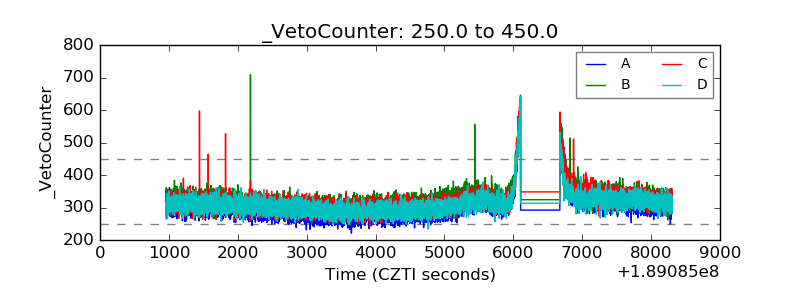 |