| Param | Original file | Final file |
|---|---|---|
| Filename | modeM0/AS1G04_014T02_9000000232_01369cztM0_level2.evt | modeM0/AS1G04_014T02_9000000232_01369cztM0_level2_quad_clean.evt |
| Size (bytes) | 1,115,951,040 | 97,548,480 |
| Size | 1.0 GB | 93.0 MB |
| Events in quadrant A | 8,473,415 | 637,863 |
| Events in quadrant B | 8,739,421 | 638,962 |
| Events in quadrant C | 7,906,975 | 619,467 |
| Events in quadrant D | 8,241,143 | 598,722 |
| Mode SS | |||
|---|---|---|---|
| Quadrant | BADHDUFLAG | Total packets | Discarded packets |
| A | 0 | 134 | 0 |
| B | 0 | 134 | 0 |
| C | 0 | 134 | 0 |
| D | 0 | 134 | 0 |
| Mode M0 | |||
|---|---|---|---|
| Quadrant | BADHDUFLAG | Total packets | Discarded packets |
| A | 0 | 29836 | 2 |
| B | 0 | 30617 | 1 |
| C | 0 | 28164 | 1 |
| D | 0 | 29211 | 1 |
| Mode M9 | |||
|---|---|---|---|
| Quadrant | BADHDUFLAG | Total packets | Discarded packets |
| A | 0 | 8 | 0 |
| B | 0 | 8 | 0 |
| C | 0 | 8 | 0 |
| D | 0 | 8 | 0 |
| Quadrant | Total seconds | Saturated seconds | Saturation percentage |
|---|---|---|---|
| A | 6581 | 48 | 0.729372% |
| B | 6581 | 54 | 0.820544% |
| C | 6581 | 21 | 0.319100% |
| D | 6581 | 312 | 4.740921% |
Noise dominated data is calculated using 1-second bins in cleaned event files. If a bin has >2000 counts, and if more than 50% of those come from <1% of pixels, then it is considered to be noise-dominated and hence unusable.
| Quadrant | # 1 sec bins | Bins with >0 counts | Bins with >2000 counts | High rate bins dominated by noise | Noise dominated (total time) | Noise dominated (detector-on time) | Marked lightcurve |
|---|---|---|---|---|---|---|---|
| A | 7367 | 6582 | 389 | 389 | 5.28% | 5.91% | 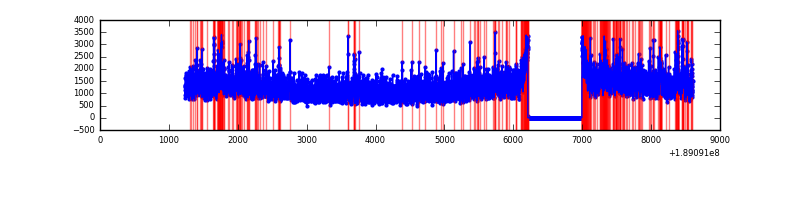 |
| B | 7367 | 6581 | 470 | 470 | 6.38% | 7.14% | 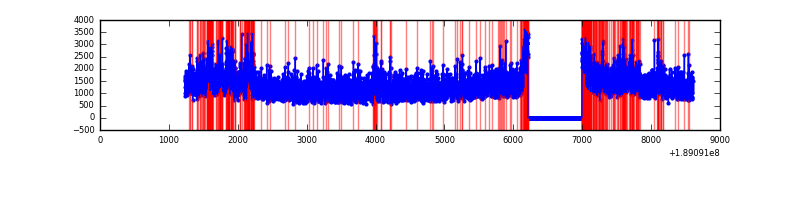 |
| C | 7367 | 6581 | 154 | 154 | 2.09% | 2.34% | 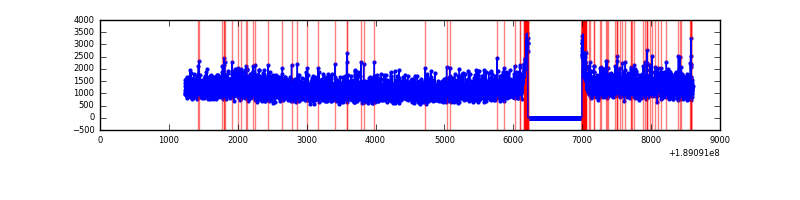 |
| D | 7367 | 6581 | 634 | 634 | 8.61% | 9.63% | 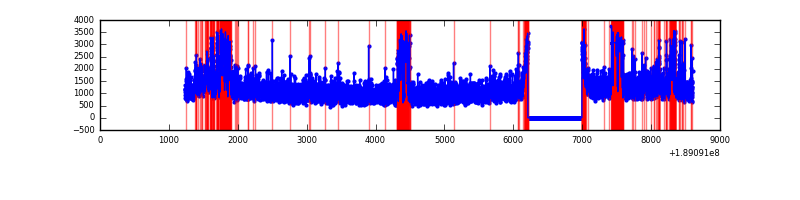 |
Top three noisy pixels from each quadrant. If the there are fewer than three noisy pixels in the level2.evt file, extra rows are filled as -1
| Pixel properties | Quadrant properties | ||||||
|---|---|---|---|---|---|---|---|
| Quadrant | DetID | PixID | Counts | Sigma | Mean | Median | Sigma |
| A | 4 | 32 | 320676 | 650.79 | 2032 | 2047 | 489.6 |
| A | 12 | 243 | 179598 | 362.64 | 2032 | 2047 | 489.6 |
| A | 15 | 127 | 89523 | 178.67 | 2032 | 2047 | 489.6 |
| B | 8 | 4 | 402751 | 802.57 | 2102 | 2108 | 499.2 |
| B | 5 | 249 | 116499 | 229.15 | 2102 | 2108 | 499.2 |
| B | 12 | 52 | 77267 | 150.56 | 2102 | 2108 | 499.2 |
| C | 15 | 241 | 220269 | 401.63 | 1941 | 2013 | 543.4 |
| C | 3 | 79 | 31100 | 53.53 | 1941 | 2013 | 543.4 |
| C | 3 | 111 | 25891 | 43.94 | 1941 | 2013 | 543.4 |
| D | 13 | 73 | 727944 | 1265.67 | 1852 | 1925 | 573.6 |
| D | 9 | 53 | 495465 | 860.39 | 1852 | 1925 | 573.6 |
| D | 13 | 252 | 29273 | 47.68 | 1852 | 1925 | 573.6 |
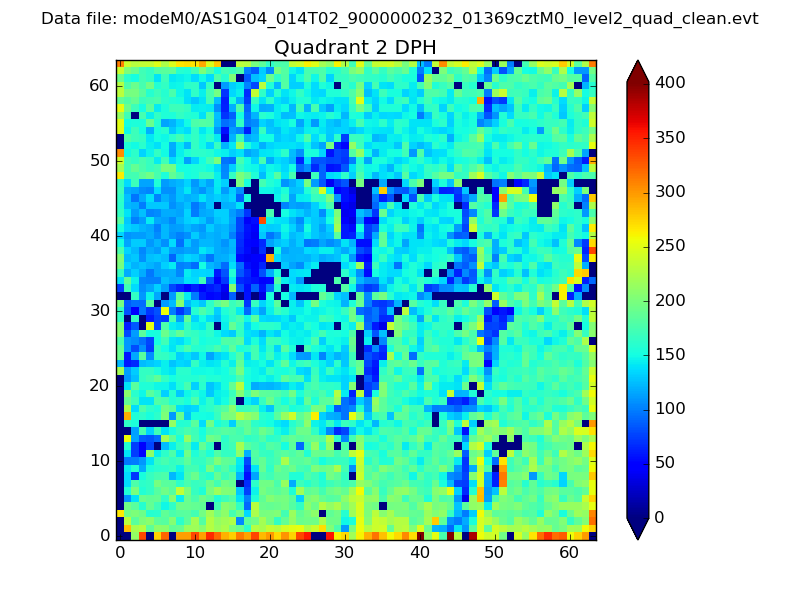
Histogram calculated using DETX and DETY for each event in the final _common_clean file
| Quadrant A | 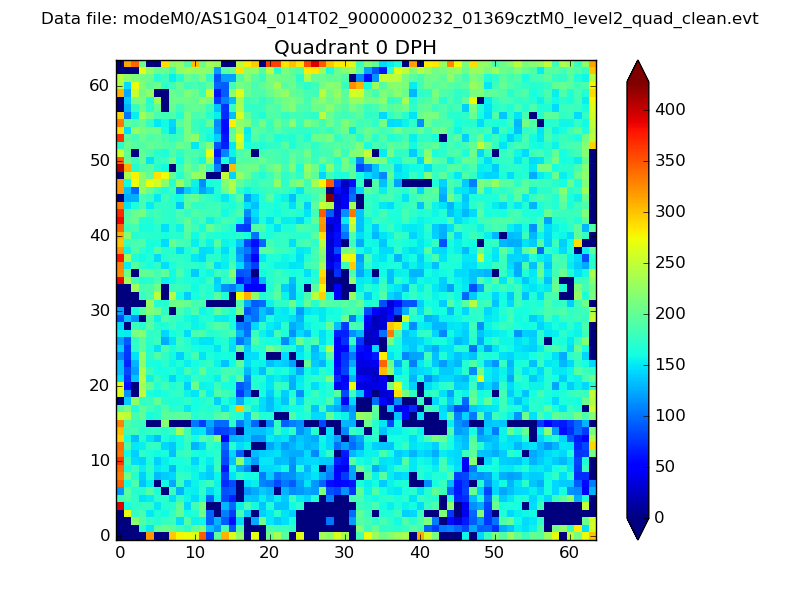 |
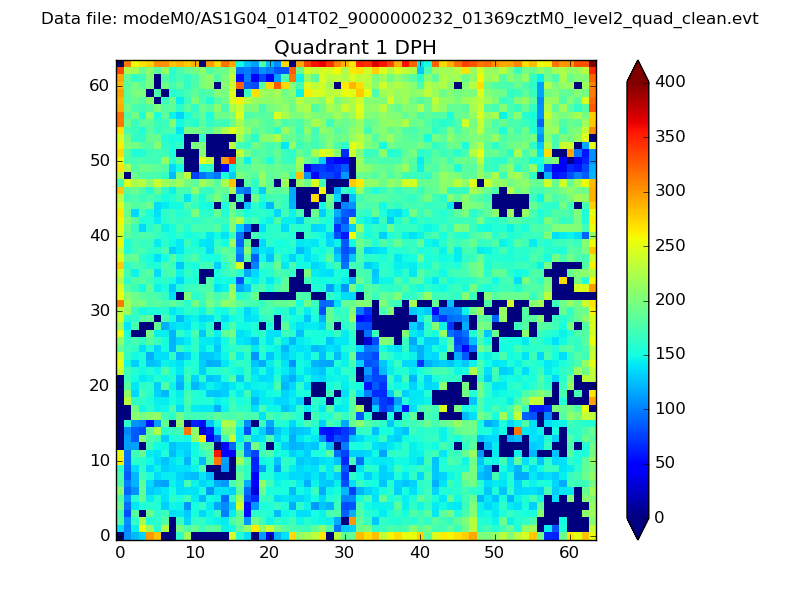 |
Quadrant B |
|---|---|---|---|
| Quadrant D | 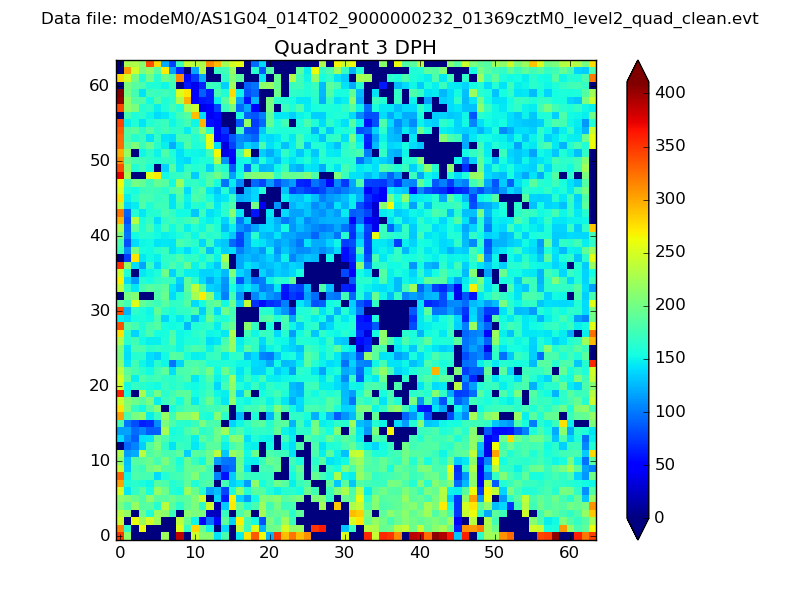 |
 |
Quadrant C |
| Plot type | Count rate plots | Images |
|---|---|---|
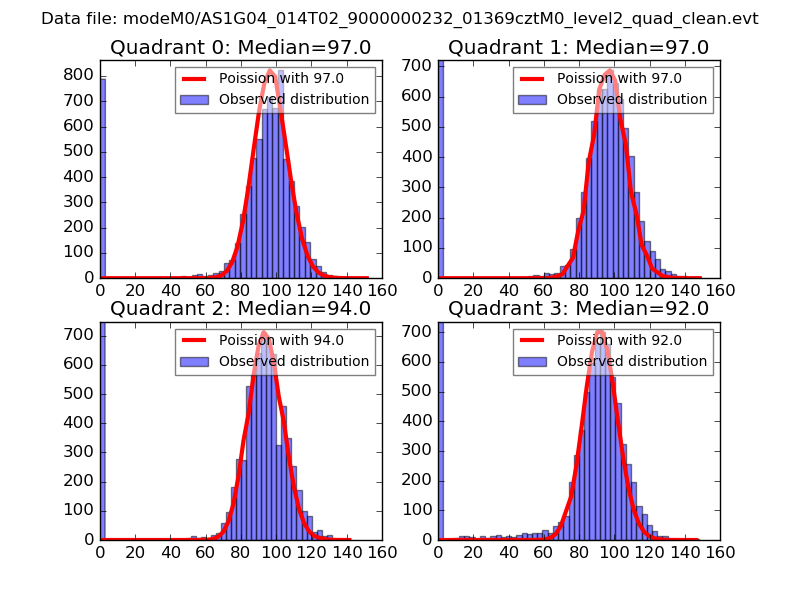
| Comparison with Poisson distribution Blue bars denote a histogram of data divided into 1 sec bins. Red curve is a Poisson curve with rate = median count rate of data. |
 |
 |
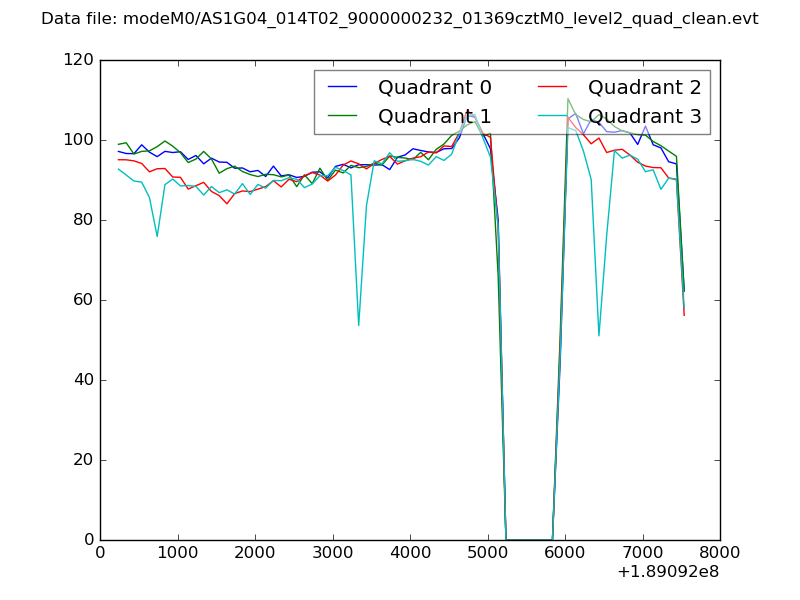
| Quadrant-wise count rates Data is divided into 100 sec bins |
 |
|
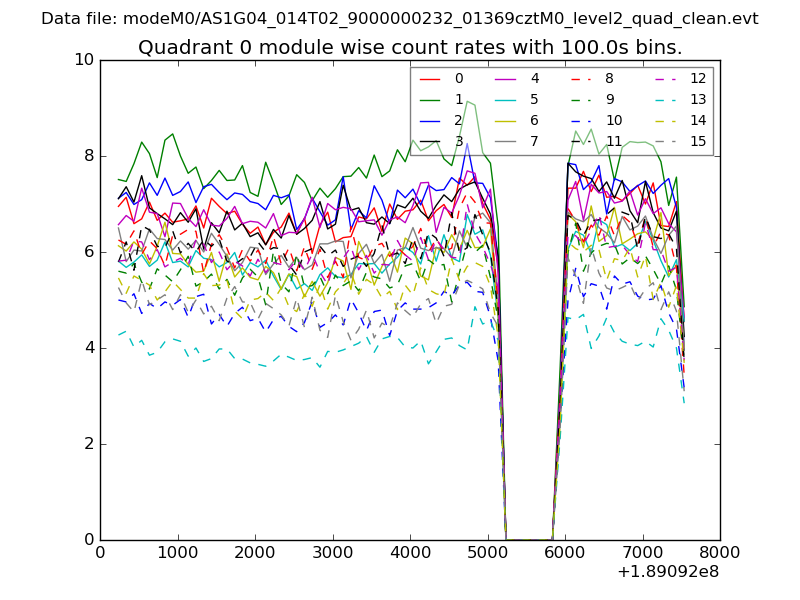
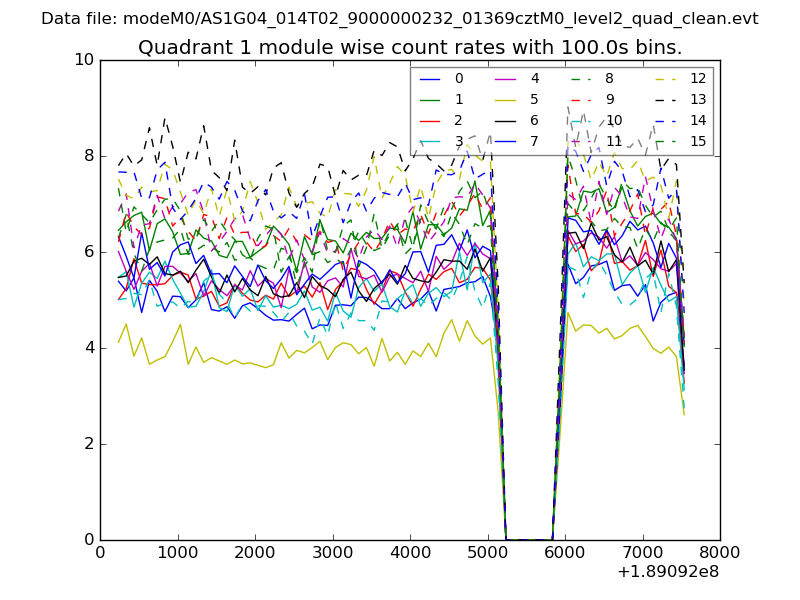
| Module-wise count rates for Quadrant A Data is divided into 100 sec bins |
 |
 |
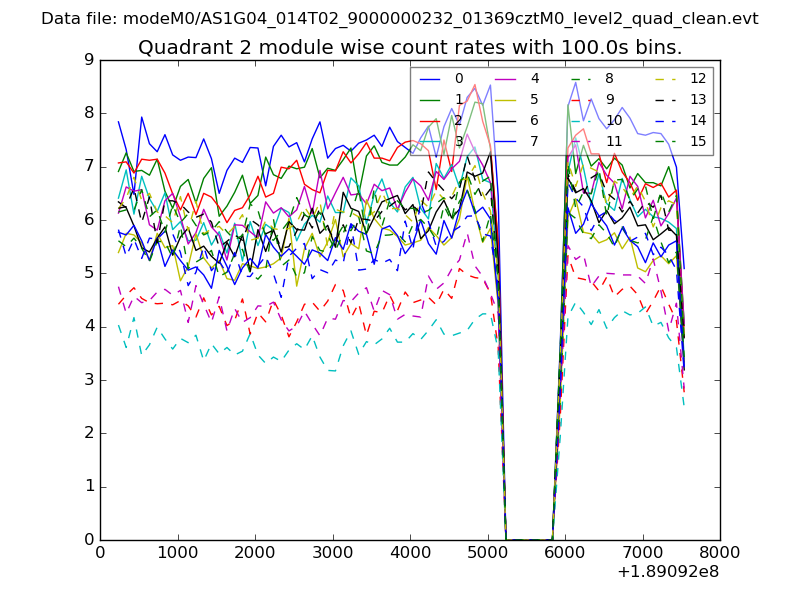
| Module-wise count rates for Quadrant B Data is divided into 100 sec bins |
 |
 |
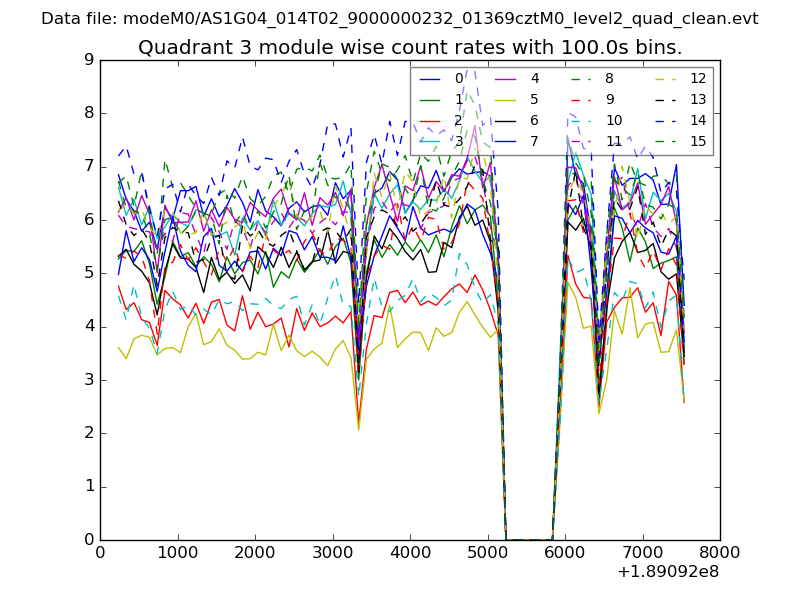
| Module-wise count rates for Quadrant C Data is divided into 100 sec bins |
 |
 |
| Module-wise count rates for Quadrant D Data is divided into 100 sec bins |
 |
 |
| Parameter | Plot |
|---|---|
| CZT HV Monitor | 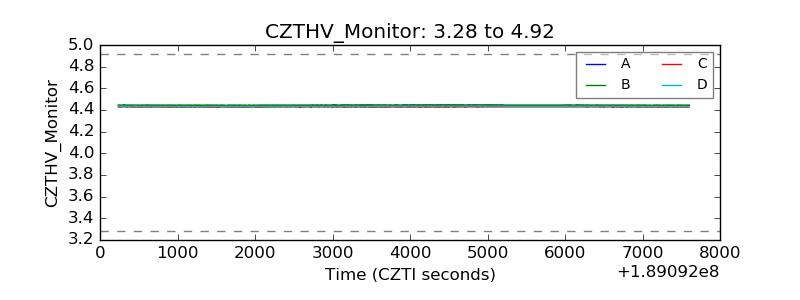 |
| D_VDD | 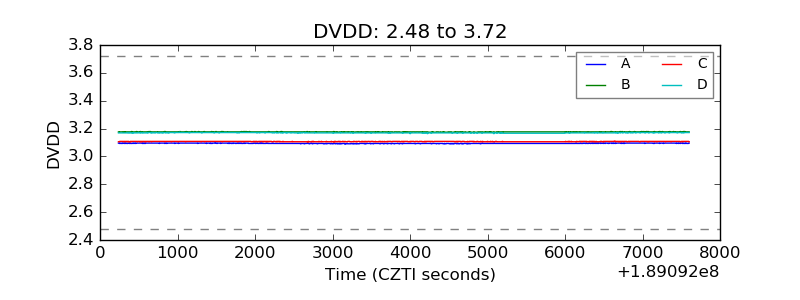 |
| Temperature 1 | 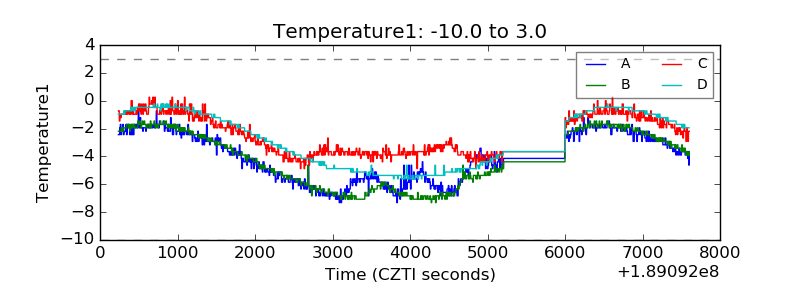 |
| Veto HV Monitor | 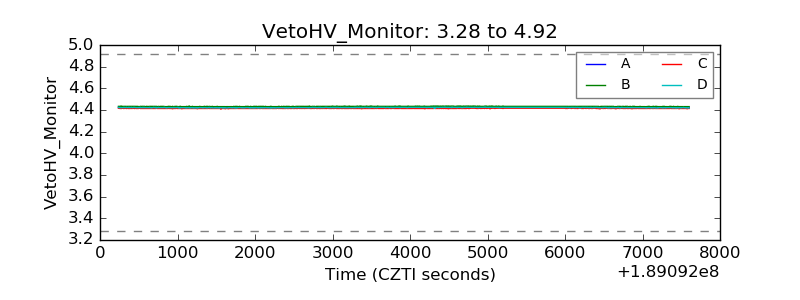 |
| Veto LLD | 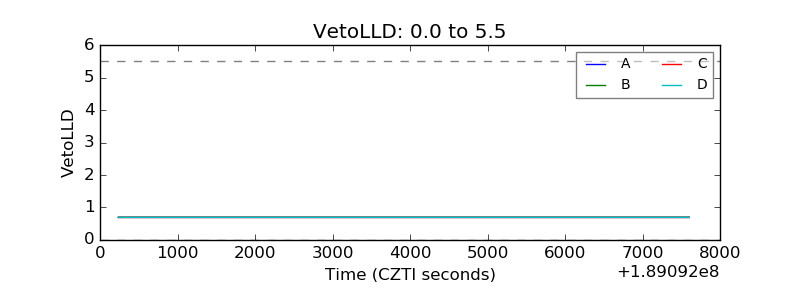 |
| Alpha Counter | 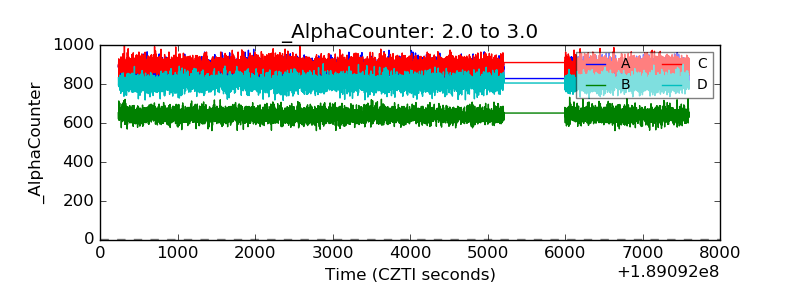 |
| _CPM_Rate | 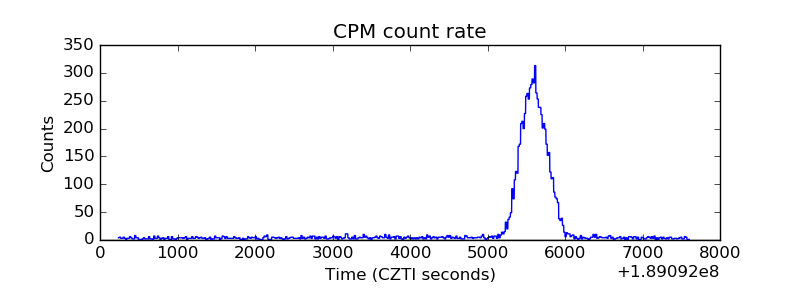 |
| CZT Counter | 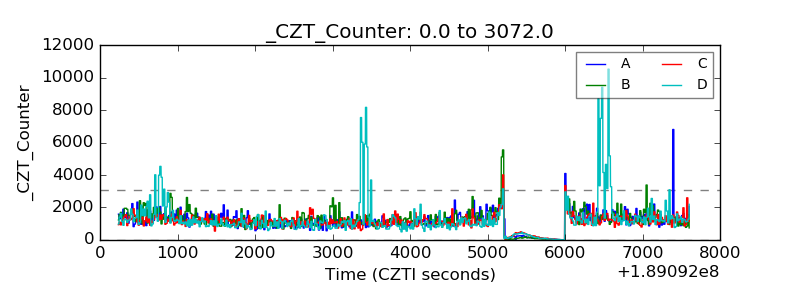 |
| +2.5 Volts monitor | 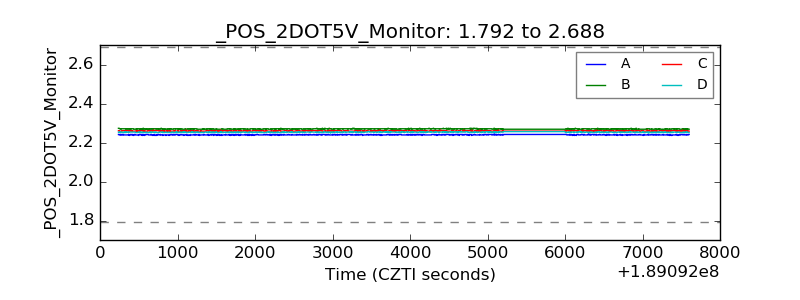 |
| +5 Volts monitor | 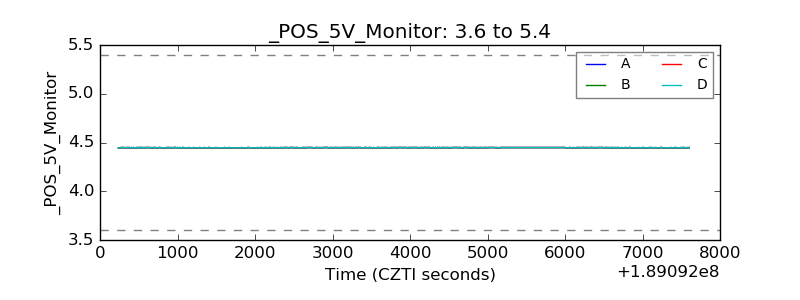 |
| _ROLL_ROT | 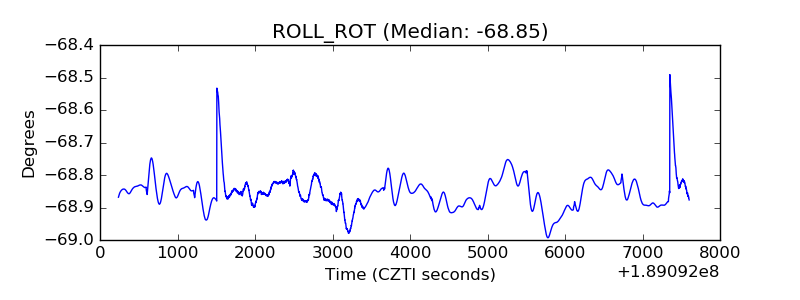 |
| _Roll_DEC | 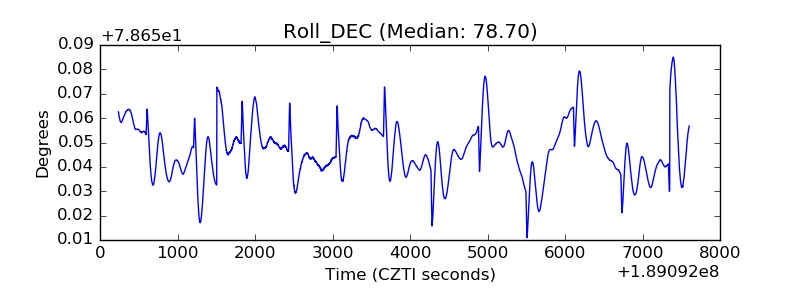 |
| _Roll_RA | 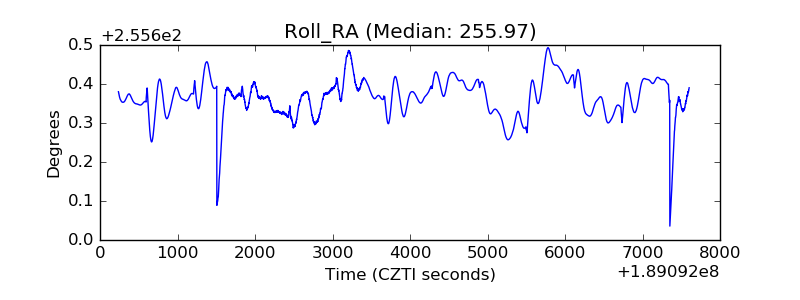 |
| Veto Counter | 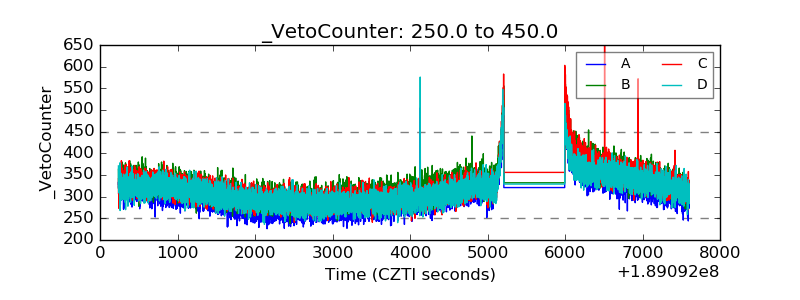 |