| Param | Original file | Final file |
|---|---|---|
| Filename | modeM0/AS1G04_014T02_9000000232_01370cztM0_level2.evt | modeM0/AS1G04_014T02_9000000232_01370cztM0_level2_quad_clean.evt |
| Size (bytes) | 1,116,368,640 | 91,212,480 |
| Size | 1.0 GB | 87.0 MB |
| Events in quadrant A | 7,909,150 | 611,855 |
| Events in quadrant B | 8,235,318 | 612,230 |
| Events in quadrant C | 7,483,743 | 596,761 |
| Events in quadrant D | 9,767,974 | 505,466 |
| Mode SS | |||
|---|---|---|---|
| Quadrant | BADHDUFLAG | Total packets | Discarded packets |
| A | 0 | 128 | 0 |
| B | 0 | 128 | 0 |
| C | 0 | 128 | 0 |
| D | 0 | 128 | 0 |
| Mode M0 | |||
|---|---|---|---|
| Quadrant | BADHDUFLAG | Total packets | Discarded packets |
| A | 0 | 27890 | 2 |
| B | 0 | 28856 | 1 |
| C | 0 | 26667 | 1 |
| D | 0 | 33737 | 1 |
| Mode M9 | |||
|---|---|---|---|
| Quadrant | BADHDUFLAG | Total packets | Discarded packets |
| A | 0 | 9 | 0 |
| B | 0 | 9 | 0 |
| C | 0 | 9 | 0 |
| D | 0 | 9 | 0 |
| Quadrant | Total seconds | Saturated seconds | Saturation percentage |
|---|---|---|---|
| A | 6232 | 48 | 0.770218% |
| B | 6232 | 67 | 1.075096% |
| C | 6232 | 48 | 0.770218% |
| D | 6232 | 1562 | 25.064185% |
Noise dominated data is calculated using 1-second bins in cleaned event files. If a bin has >2000 counts, and if more than 50% of those come from <1% of pixels, then it is considered to be noise-dominated and hence unusable.
| Quadrant | # 1 sec bins | Bins with >0 counts | Bins with >2000 counts | High rate bins dominated by noise | Noise dominated (total time) | Noise dominated (detector-on time) | Marked lightcurve |
|---|---|---|---|---|---|---|---|
| A | 7182 | 6233 | 322 | 322 | 4.48% | 5.17% | 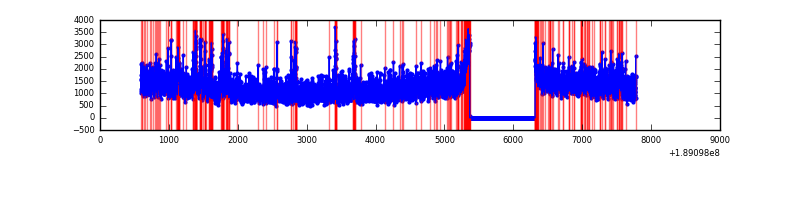 |
| B | 7182 | 6232 | 351 | 351 | 4.89% | 5.63% |  |
| C | 7182 | 6232 | 181 | 181 | 2.52% | 2.90% | 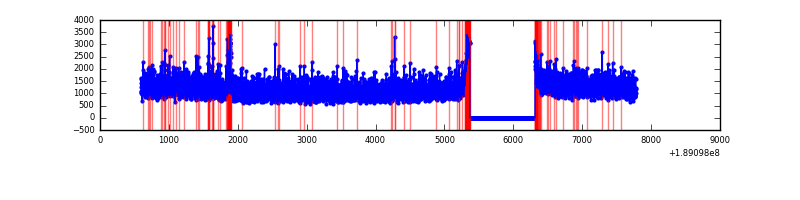 |
| D | 7181 | 6231 | 1695 | 1695 | 23.60% | 27.20% | 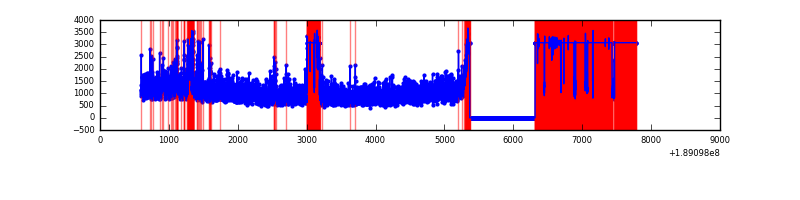 |
Top three noisy pixels from each quadrant. If the there are fewer than three noisy pixels in the level2.evt file, extra rows are filled as -1
| Pixel properties | Quadrant properties | ||||||
|---|---|---|---|---|---|---|---|
| Quadrant | DetID | PixID | Counts | Sigma | Mean | Median | Sigma |
| A | 4 | 32 | 247732 | 537.58 | 1899 | 1914 | 457.3 |
| A | 12 | 243 | 166020 | 358.88 | 1899 | 1914 | 457.3 |
| A | 15 | 127 | 154755 | 334.25 | 1899 | 1914 | 457.3 |
| B | 8 | 4 | 454035 | 972.68 | 1977 | 1986 | 464.7 |
| B | 5 | 191 | 120208 | 254.38 | 1977 | 1986 | 464.7 |
| B | 8 | 219 | 47756 | 98.48 | 1977 | 1986 | 464.7 |
| C | 15 | 241 | 206424 | 401.27 | 1823 | 1888 | 509.7 |
| C | 10 | 19 | 86055 | 165.13 | 1823 | 1888 | 509.7 |
| C | 3 | 111 | 21982 | 39.42 | 1823 | 1888 | 509.7 |
| D | 9 | 53 | 3412580 | 7120.69 | 1545 | 1603 | 479.0 |
| D | 13 | 73 | 503820 | 1048.42 | 1545 | 1603 | 479.0 |
| D | 10 | 125 | 38659 | 77.36 | 1545 | 1603 | 479.0 |
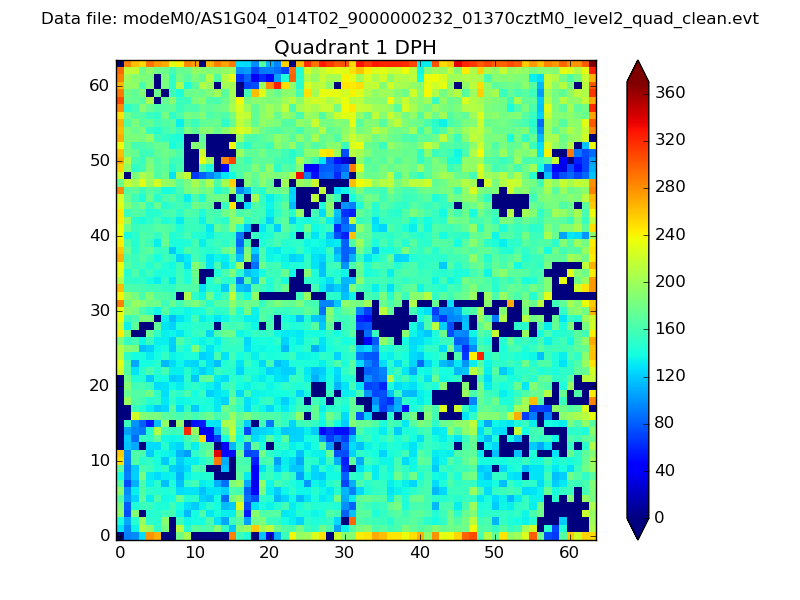
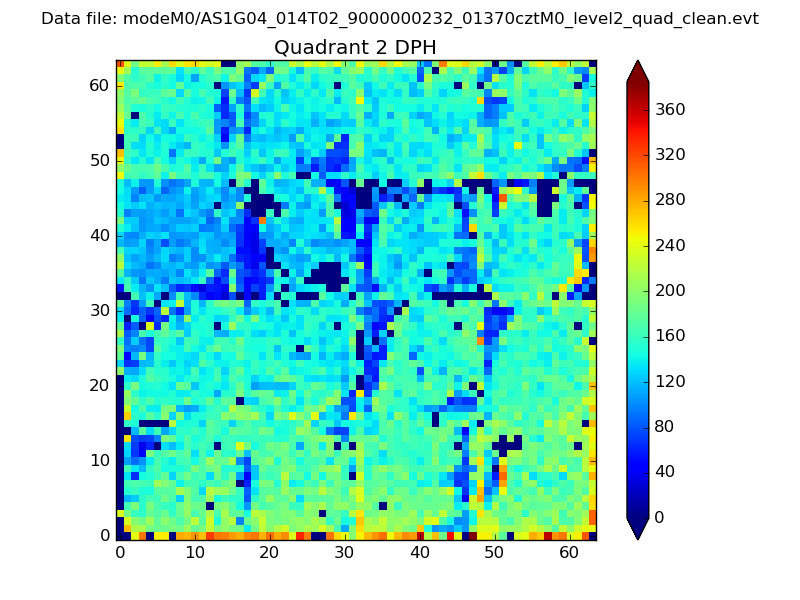
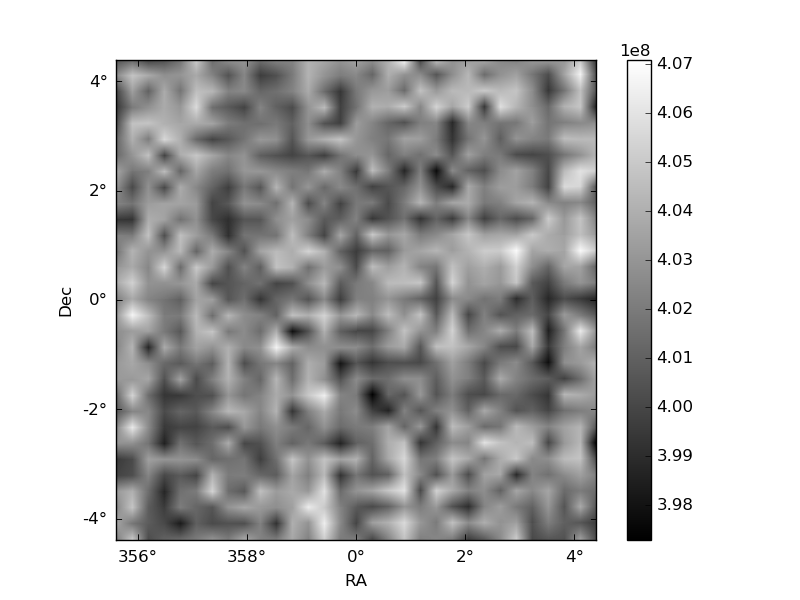
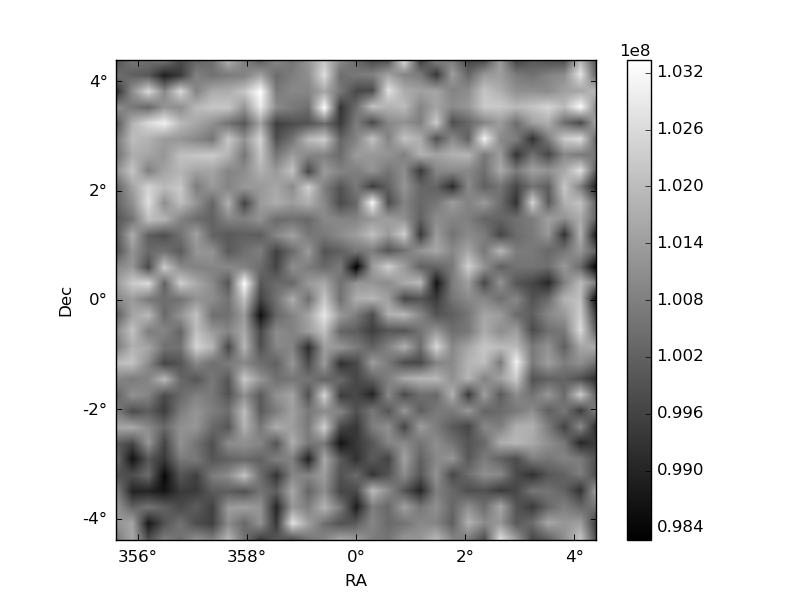
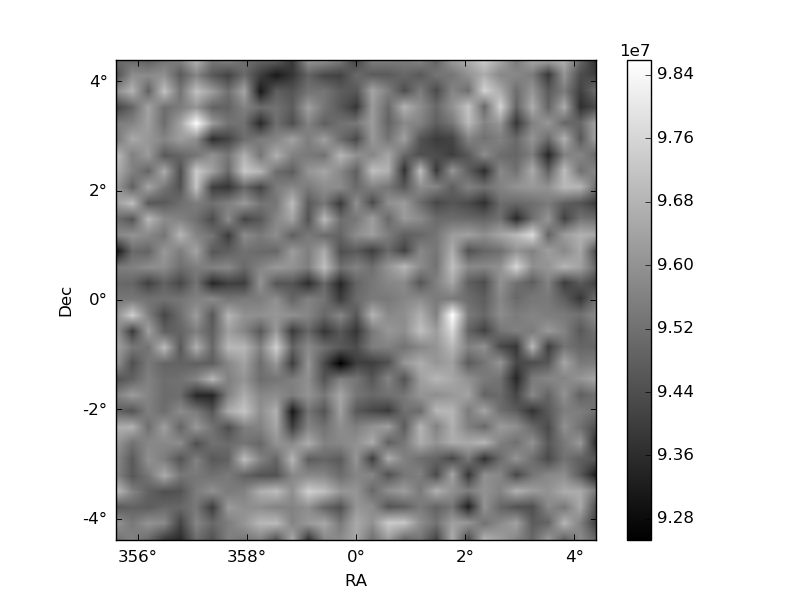
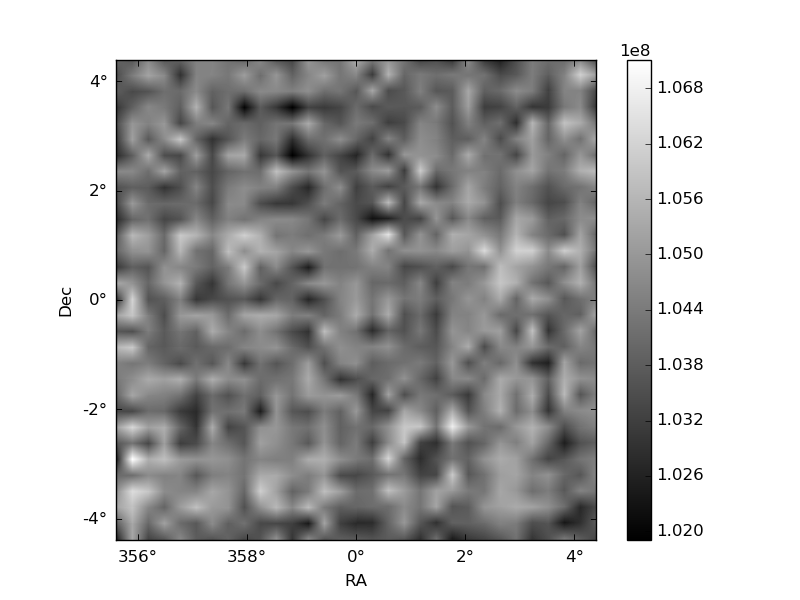
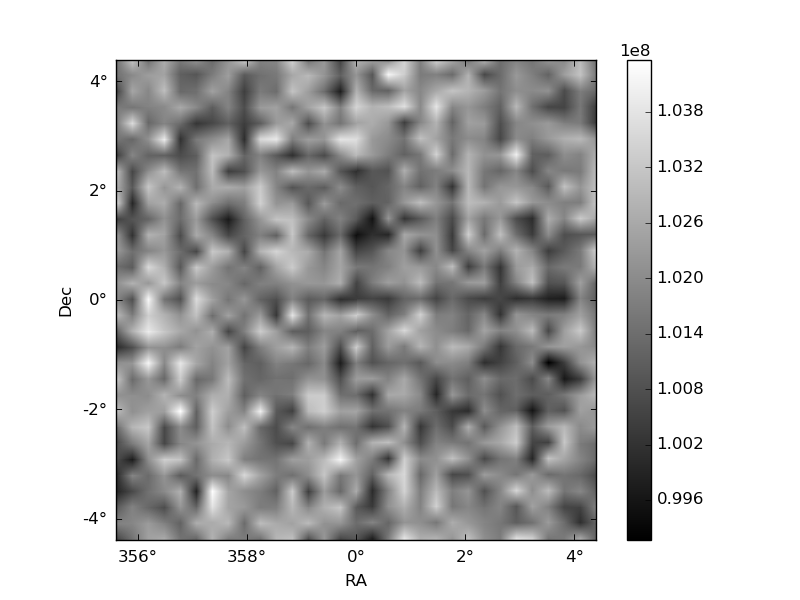
Histogram calculated using DETX and DETY for each event in the final _common_clean file
| Quadrant A | 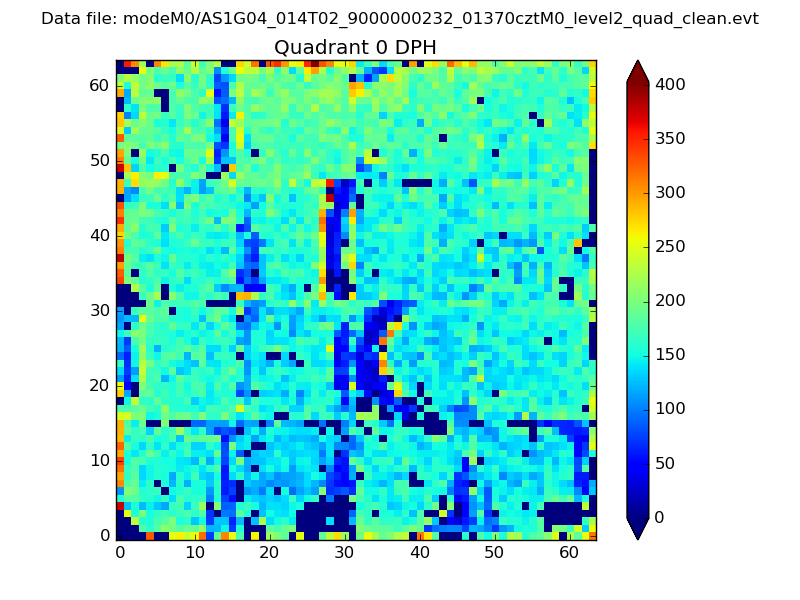 |
 |
Quadrant B |
|---|---|---|---|
| Quadrant D | 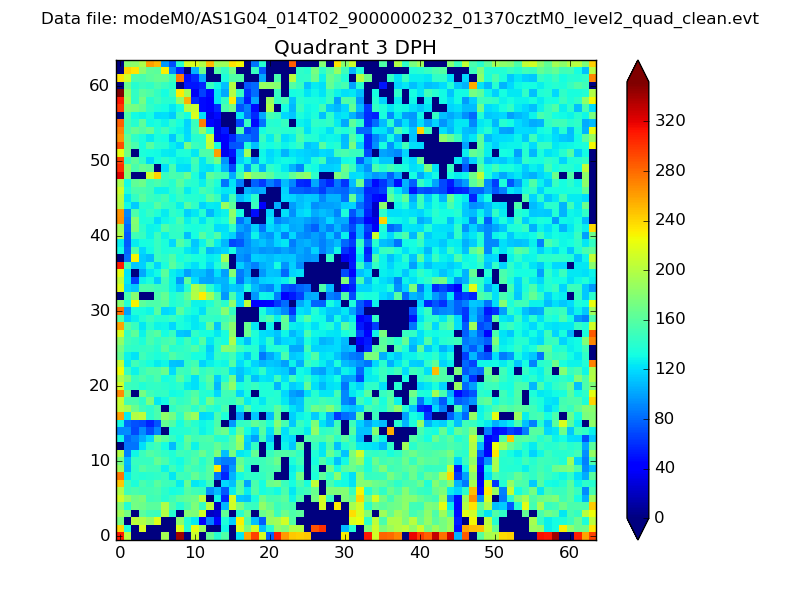 |
 |
Quadrant C |
| Plot type | Count rate plots | Images |
|---|---|---|
| Comparison with Poisson distribution Blue bars denote a histogram of data divided into 1 sec bins. Red curve is a Poisson curve with rate = median count rate of data. |
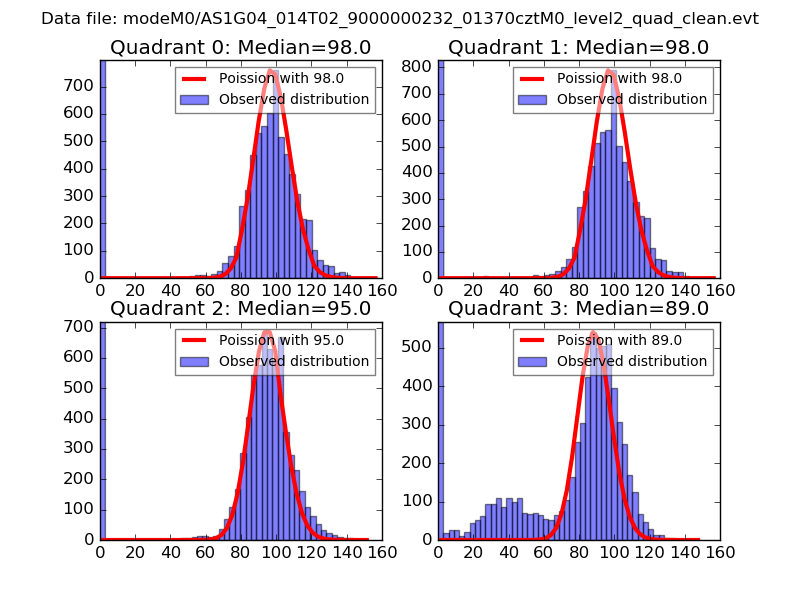 |
 |
| Quadrant-wise count rates Data is divided into 100 sec bins |
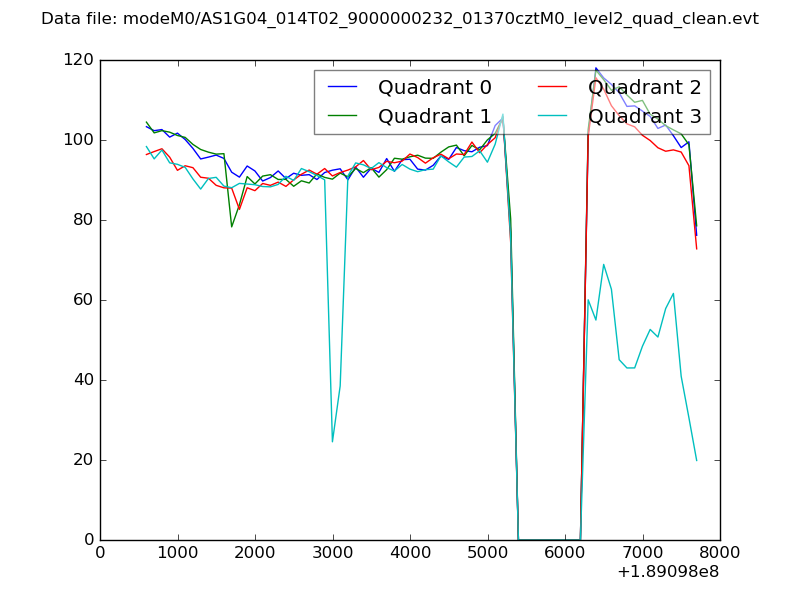 |
|
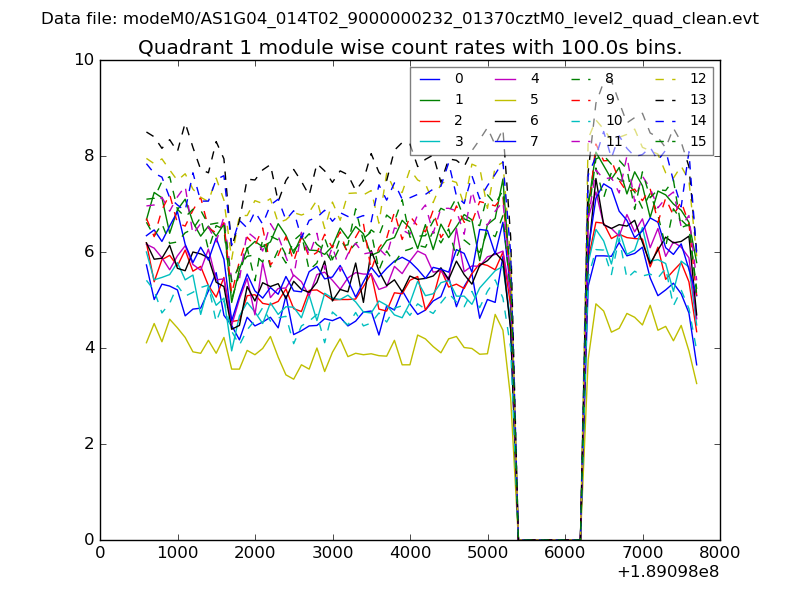
| Module-wise count rates for Quadrant A Data is divided into 100 sec bins |
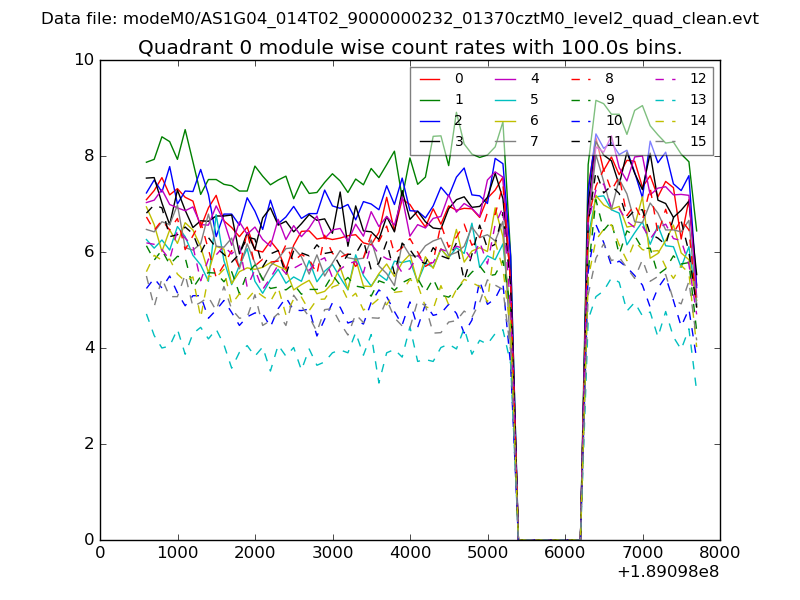 |
 |
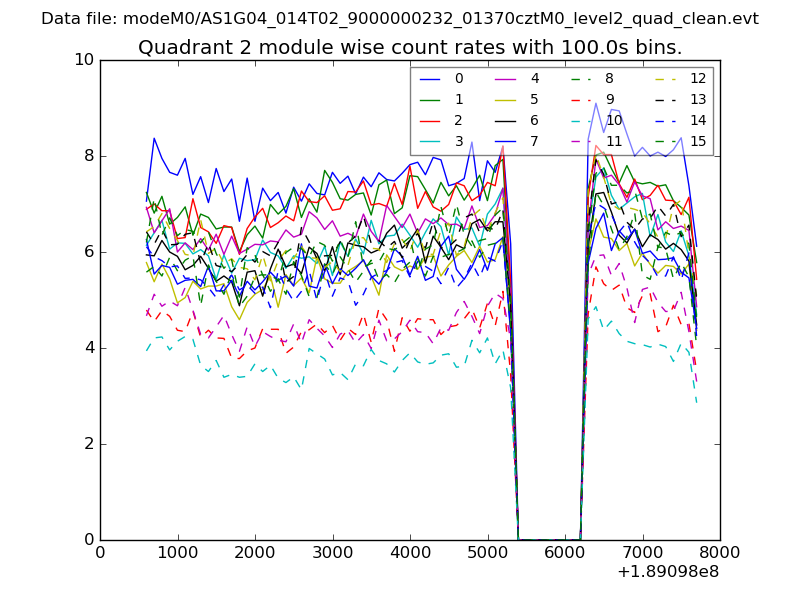
| Module-wise count rates for Quadrant B Data is divided into 100 sec bins |
 |
 |
| Module-wise count rates for Quadrant C Data is divided into 100 sec bins |
 |
 |
| Module-wise count rates for Quadrant D Data is divided into 100 sec bins |
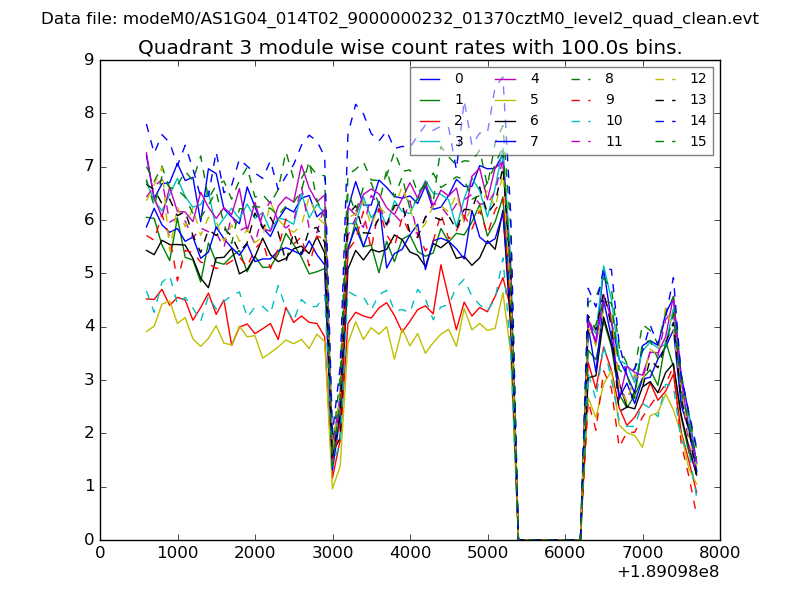 |
 |
| Parameter | Plot |
|---|---|
| CZT HV Monitor | 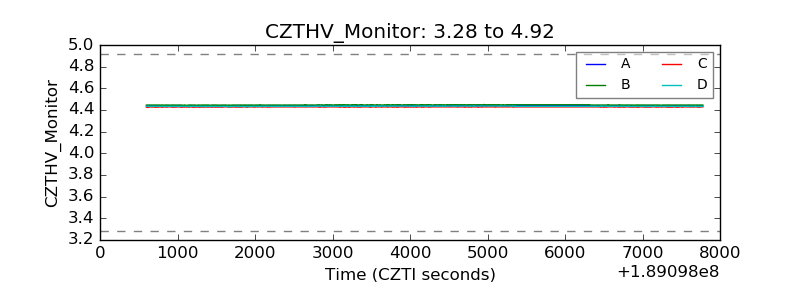 |
| D_VDD | 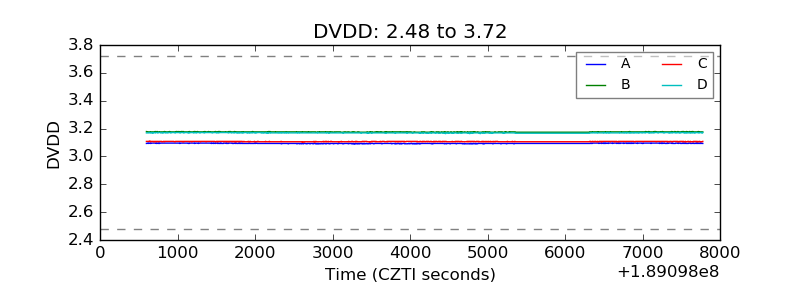 |
| Temperature 1 | 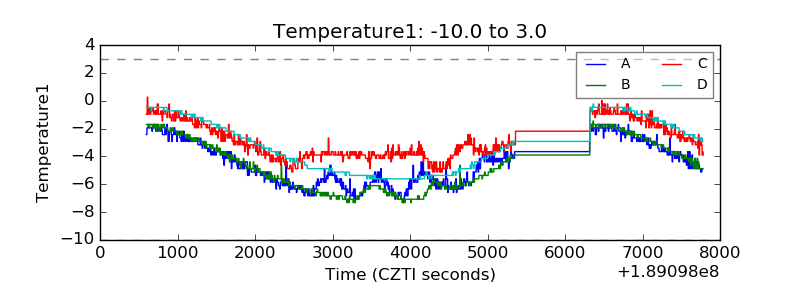 |
| Veto HV Monitor | 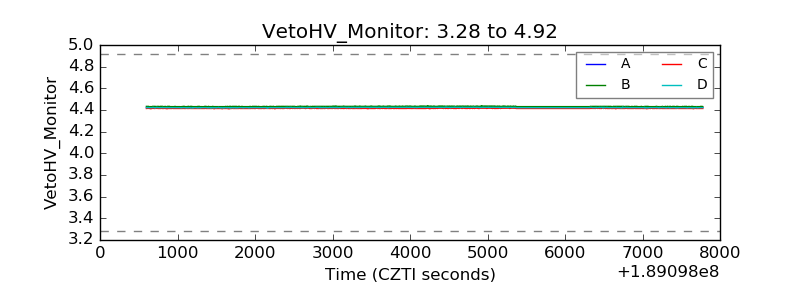 |
| Veto LLD | 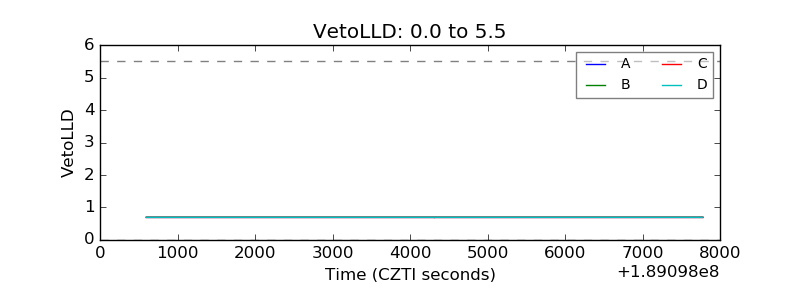 |
| Alpha Counter | 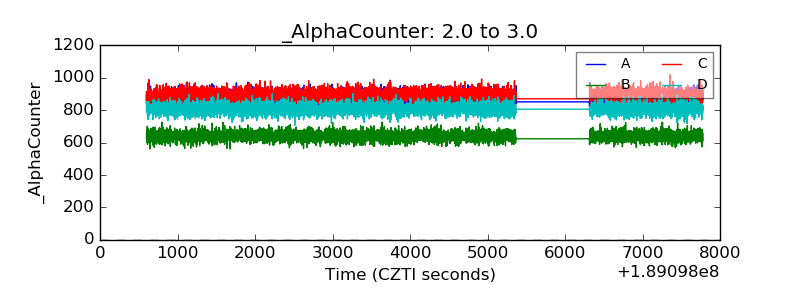 |
| _CPM_Rate | 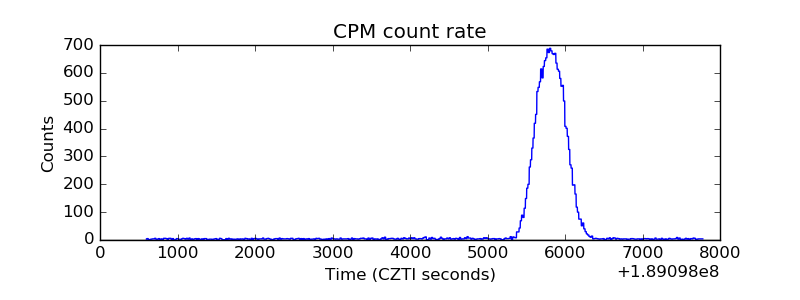 |
| CZT Counter | 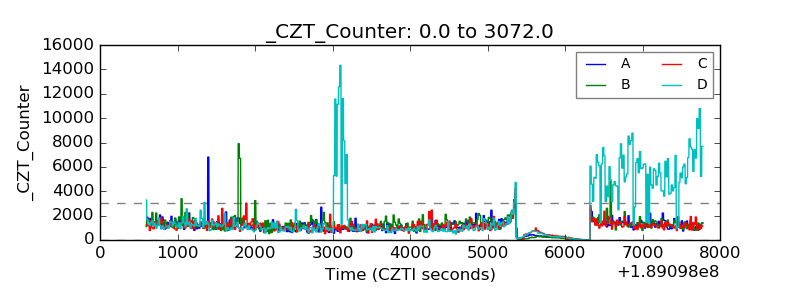 |
| +2.5 Volts monitor |  |
| +5 Volts monitor |  |
| _ROLL_ROT | 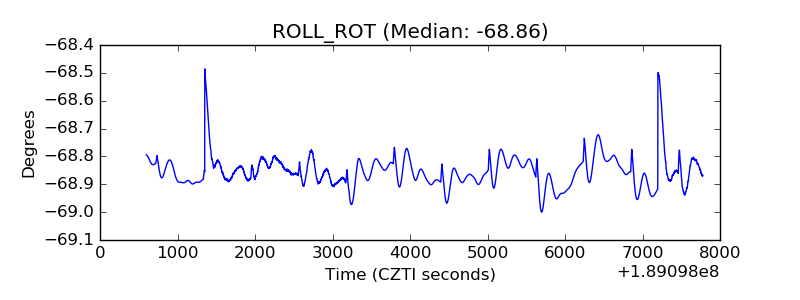 |
| _Roll_DEC | 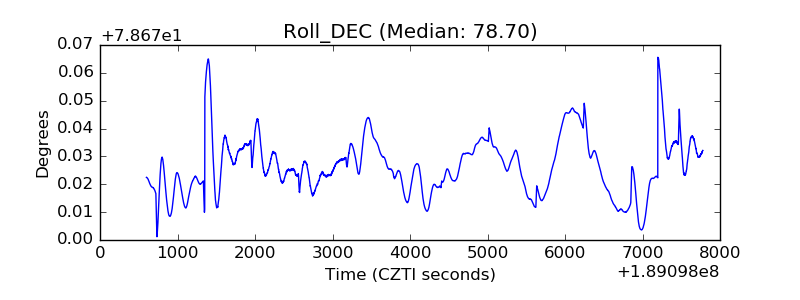 |
| _Roll_RA | 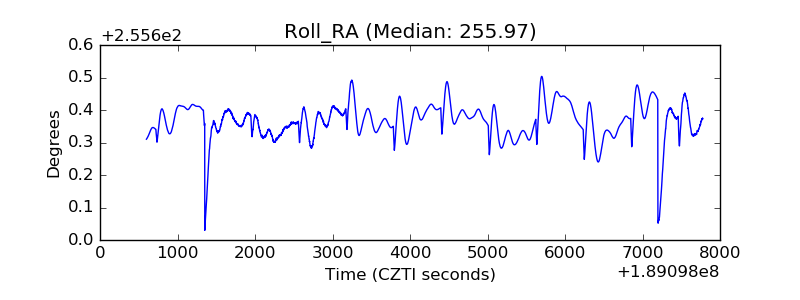 |
| Veto Counter | 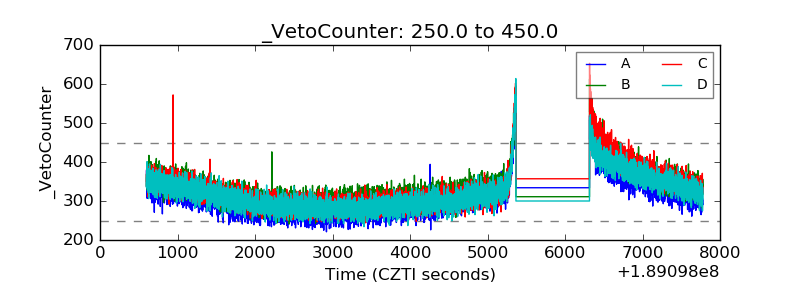 |