| Param | Original file | Final file |
|---|---|---|
| Filename | modeM0/AS1G04_014T02_9000000232_01372cztM0_level2.evt | modeM0/AS1G04_014T02_9000000232_01372cztM0_level2_quad_clean.evt |
| Size (bytes) | 1,157,454,720 | 94,898,880 |
| Size | 1.1 GB | 90.5 MB |
| Events in quadrant A | 8,121,167 | 634,855 |
| Events in quadrant B | 7,930,286 | 644,775 |
| Events in quadrant C | 7,557,800 | 628,103 |
| Events in quadrant D | 11,026,379 | 524,518 |
| Mode SS | |||
|---|---|---|---|
| Quadrant | BADHDUFLAG | Total packets | Discarded packets |
| A | 0 | 128 | 0 |
| B | 0 | 128 | 0 |
| C | 0 | 128 | 0 |
| D | 0 | 128 | 0 |
| Mode M0 | |||
|---|---|---|---|
| Quadrant | BADHDUFLAG | Total packets | Discarded packets |
| A | 0 | 28591 | 2 |
| B | 0 | 28046 | 1 |
| C | 0 | 26915 | 1 |
| D | 0 | 37552 | 1 |
| Mode M9 | |||
|---|---|---|---|
| Quadrant | BADHDUFLAG | Total packets | Discarded packets |
| A | 0 | 11 | 0 |
| B | 0 | 11 | 0 |
| C | 0 | 11 | 0 |
| D | 0 | 11 | 0 |
| Quadrant | Total seconds | Saturated seconds | Saturation percentage |
|---|---|---|---|
| A | 6316 | 63 | 0.997467% |
| B | 6316 | 23 | 0.364155% |
| C | 6316 | 32 | 0.506650% |
| D | 6316 | 1784 | 28.245725% |
Noise dominated data is calculated using 1-second bins in cleaned event files. If a bin has >2000 counts, and if more than 50% of those come from <1% of pixels, then it is considered to be noise-dominated and hence unusable.
| Quadrant | # 1 sec bins | Bins with >0 counts | Bins with >2000 counts | High rate bins dominated by noise | Noise dominated (total time) | Noise dominated (detector-on time) | Marked lightcurve |
|---|---|---|---|---|---|---|---|
| A | 7401 | 6316 | 363 | 363 | 4.90% | 5.75% |  |
| B | 7401 | 6316 | 217 | 217 | 2.93% | 3.44% | 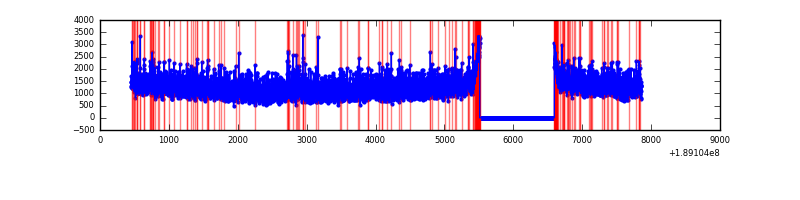 |
| C | 7401 | 6316 | 161 | 161 | 2.18% | 2.55% | 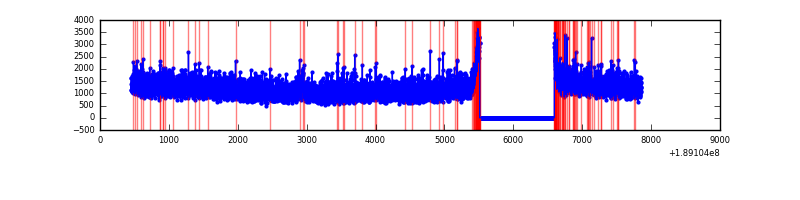 |
| D | 7401 | 6316 | 2136 | 2136 | 28.86% | 33.82% |  |
Top three noisy pixels from each quadrant. If the there are fewer than three noisy pixels in the level2.evt file, extra rows are filled as -1
| Pixel properties | Quadrant properties | ||||||
|---|---|---|---|---|---|---|---|
| Quadrant | DetID | PixID | Counts | Sigma | Mean | Median | Sigma |
| A | 15 | 127 | 410714 | 887.16 | 1933 | 1948 | 460.8 |
| A | 4 | 32 | 121504 | 259.48 | 1933 | 1948 | 460.8 |
| A | 12 | 243 | 74926 | 158.39 | 1933 | 1948 | 460.8 |
| B | 6 | 53 | 78972 | 162.24 | 2020 | 2024 | 474.3 |
| B | 8 | 4 | 65747 | 134.35 | 2020 | 2024 | 474.3 |
| B | 15 | 22 | 38288 | 76.46 | 2020 | 2024 | 474.3 |
| C | 15 | 241 | 203577 | 392.03 | 1858 | 1925 | 514.4 |
| C | 10 | 19 | 35038 | 64.37 | 1858 | 1925 | 514.4 |
| C | 7 | 222 | 21570 | 38.19 | 1858 | 1925 | 514.4 |
| D | 9 | 53 | 4873603 | 10035.38 | 1569 | 1627 | 485.5 |
| D | 13 | 73 | 150871 | 307.42 | 1569 | 1627 | 485.5 |
| D | 10 | 125 | 110261 | 223.77 | 1569 | 1627 | 485.5 |
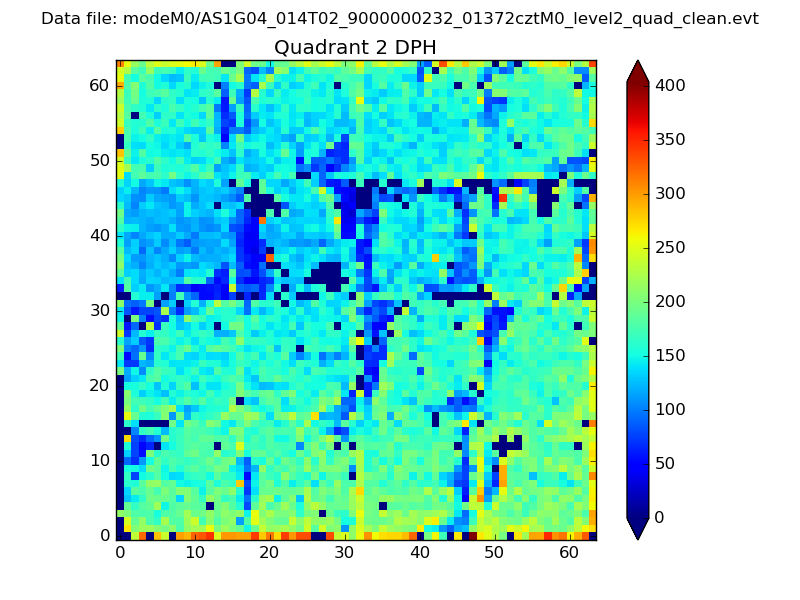
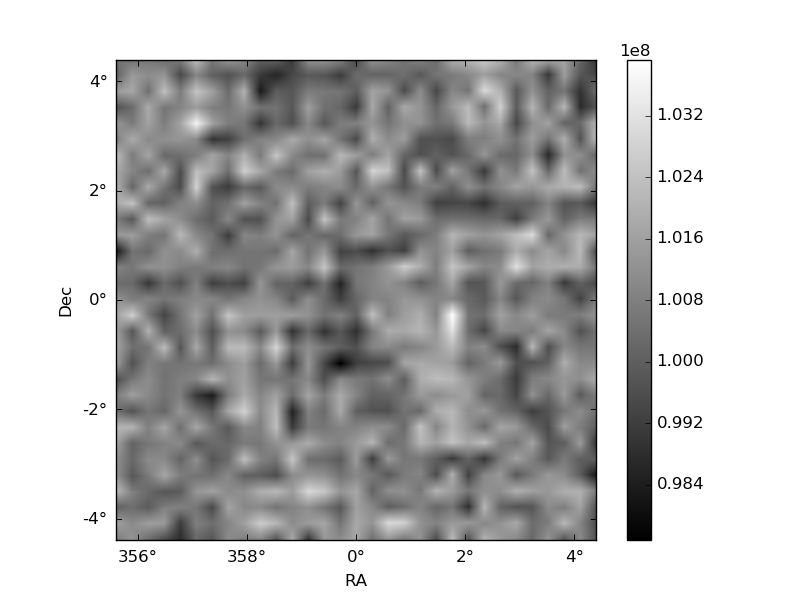
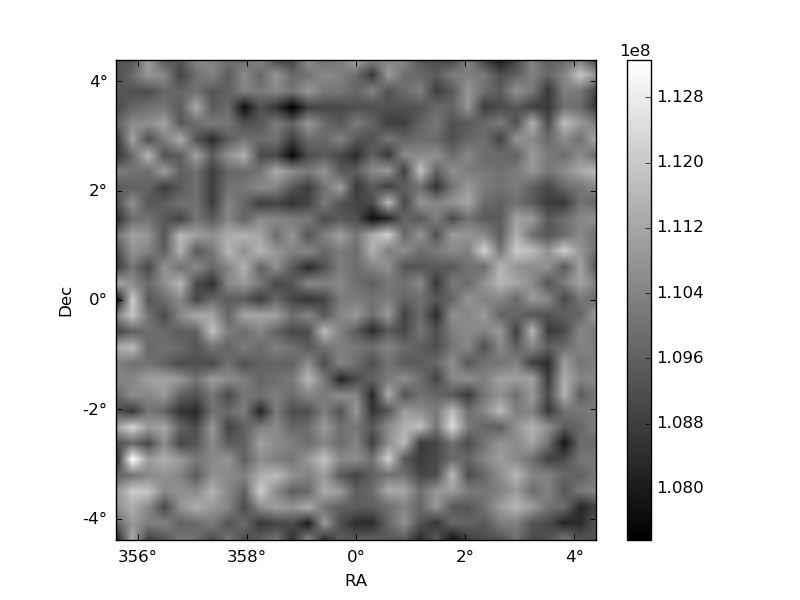
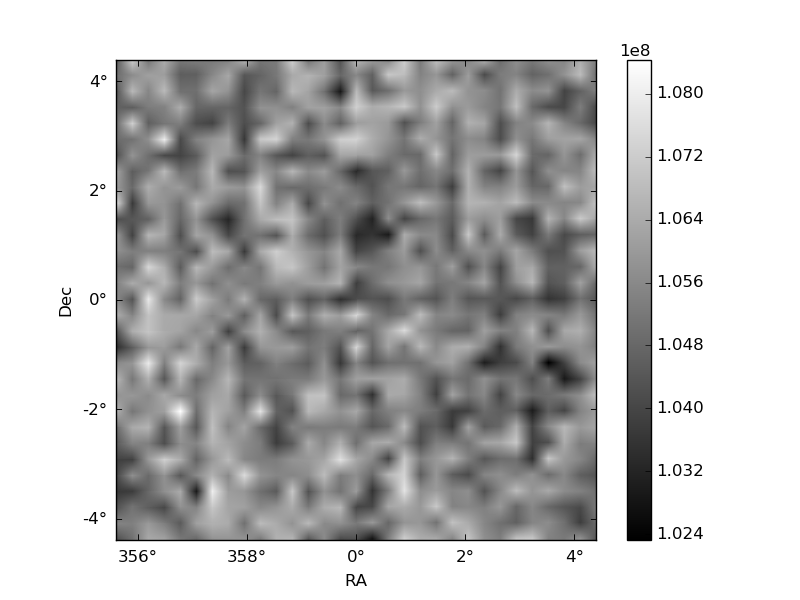
Histogram calculated using DETX and DETY for each event in the final _common_clean file
| Quadrant A | 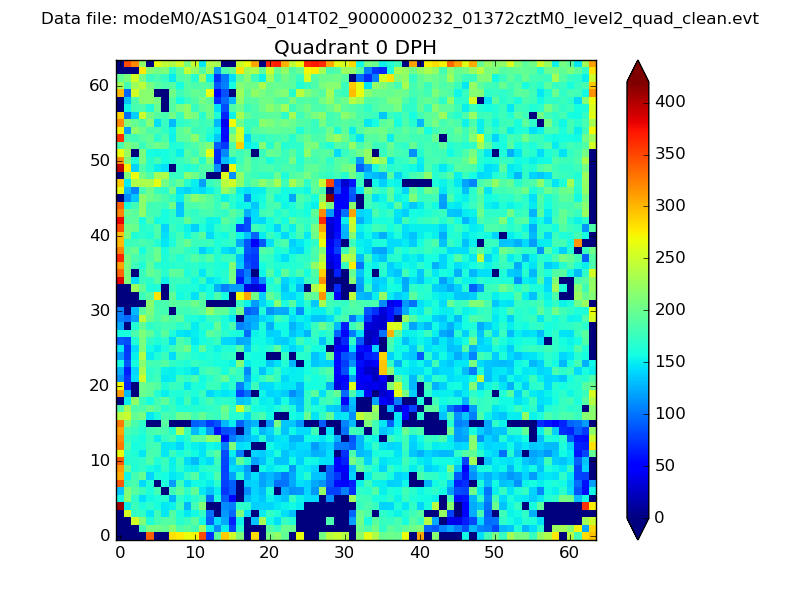 |
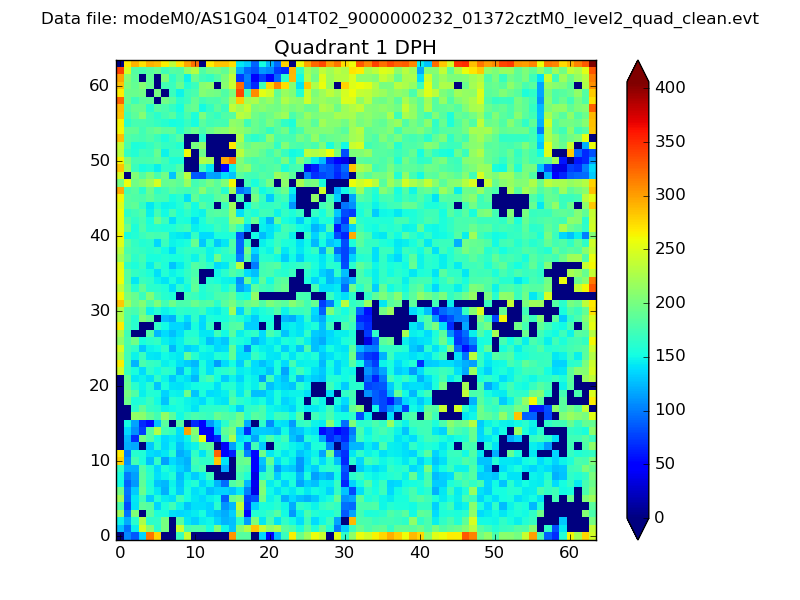 |
Quadrant B |
|---|---|---|---|
| Quadrant D | 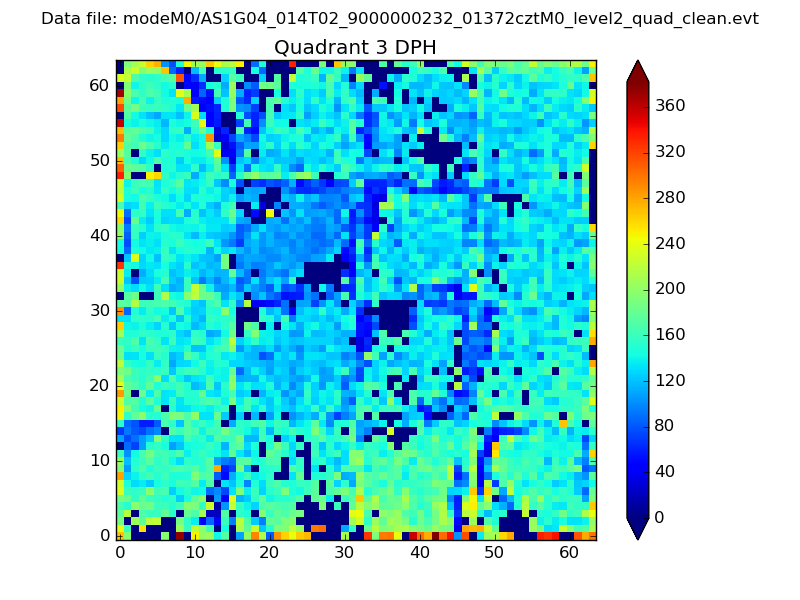 |
 |
Quadrant C |
| Plot type | Count rate plots | Images |
|---|---|---|
| Comparison with Poisson distribution Blue bars denote a histogram of data divided into 1 sec bins. Red curve is a Poisson curve with rate = median count rate of data. |
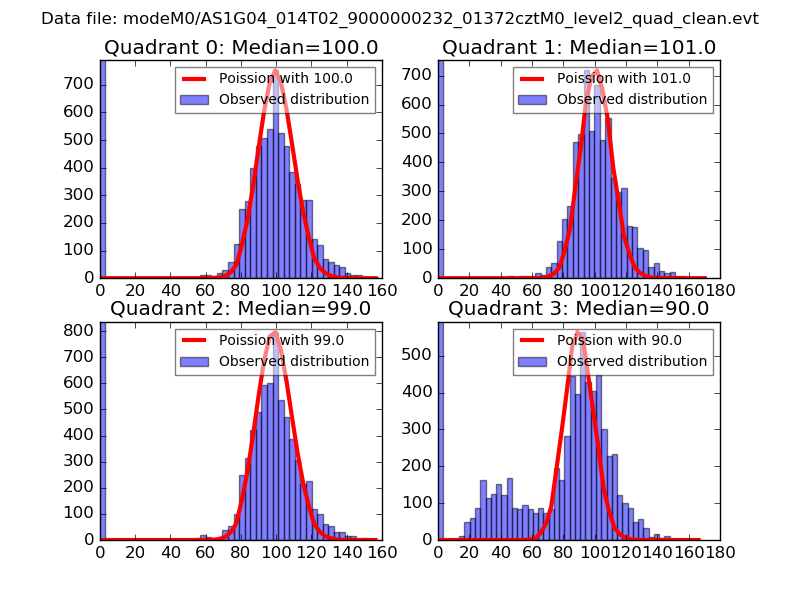 |
 |
| Quadrant-wise count rates Data is divided into 100 sec bins |
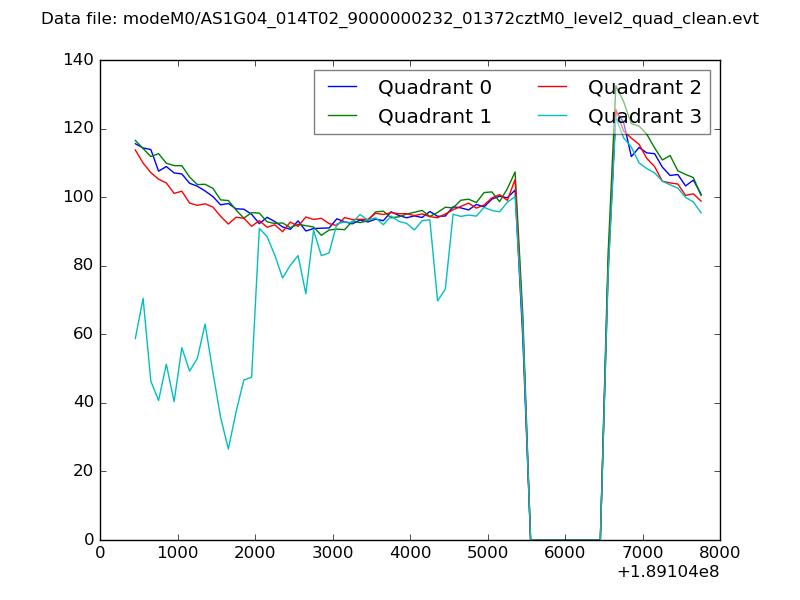 |
|
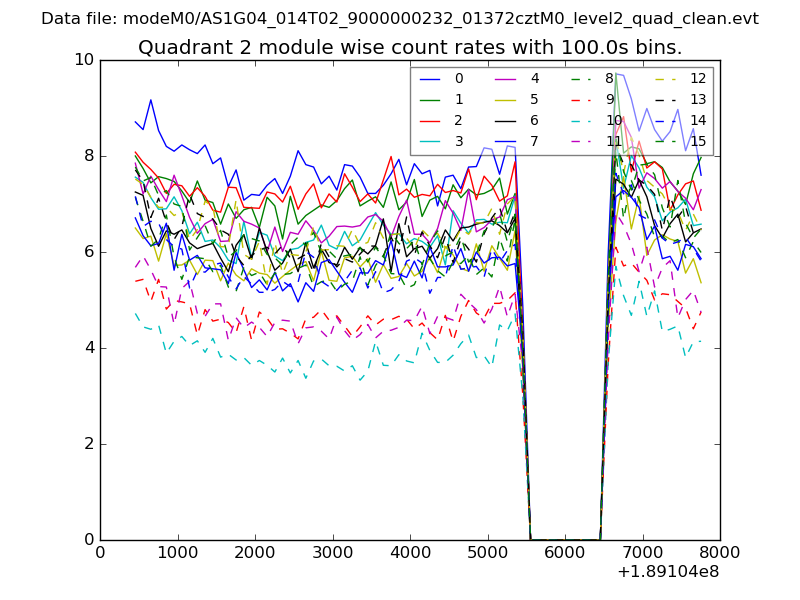
| Module-wise count rates for Quadrant A Data is divided into 100 sec bins |
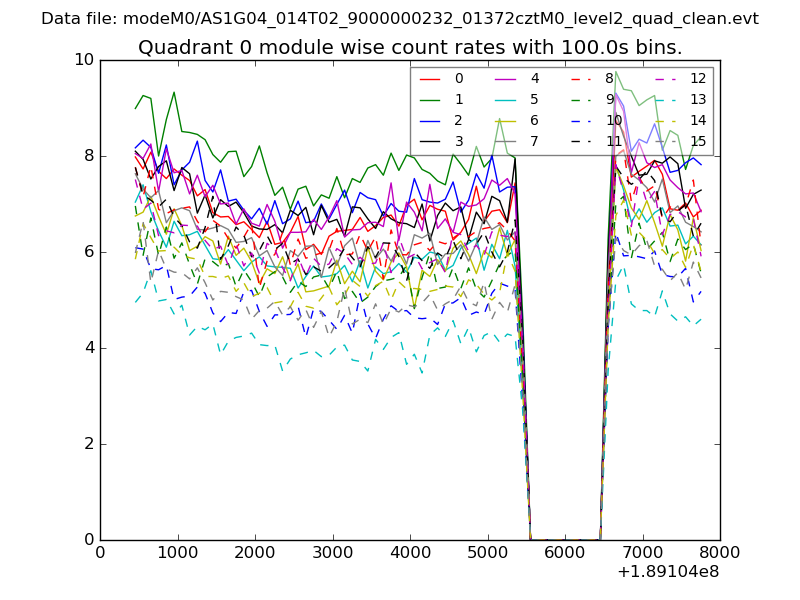 |
 |
| Module-wise count rates for Quadrant B Data is divided into 100 sec bins |
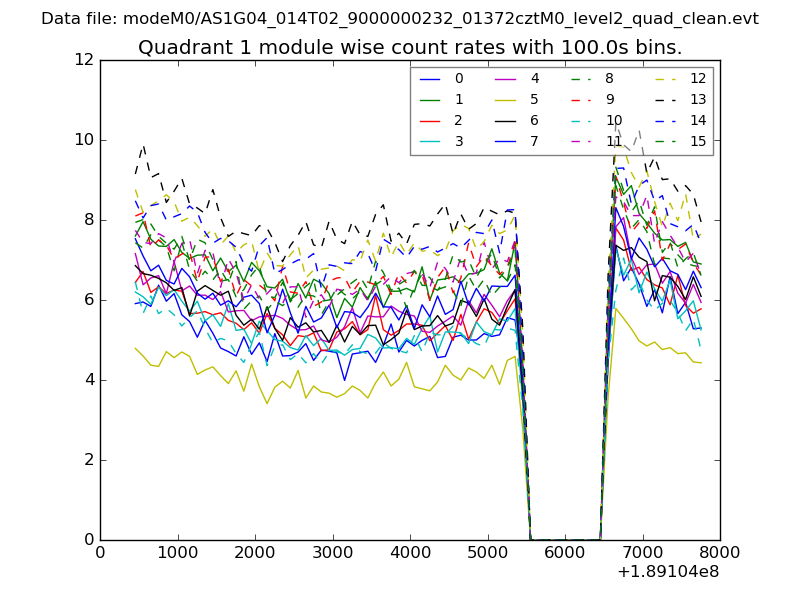 |
 |
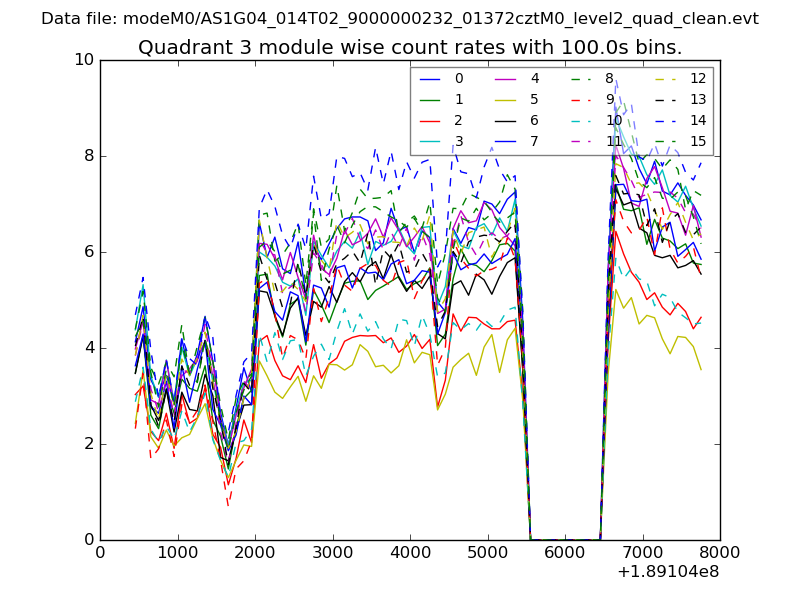
| Module-wise count rates for Quadrant C Data is divided into 100 sec bins |
 |
 |
| Module-wise count rates for Quadrant D Data is divided into 100 sec bins |
 |
 |
| Parameter | Plot |
|---|---|
| CZT HV Monitor | 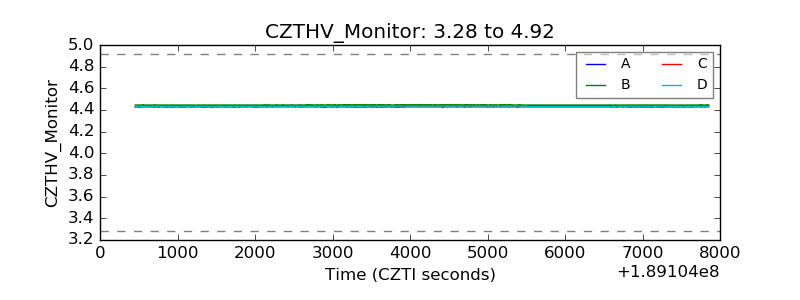 |
| D_VDD | 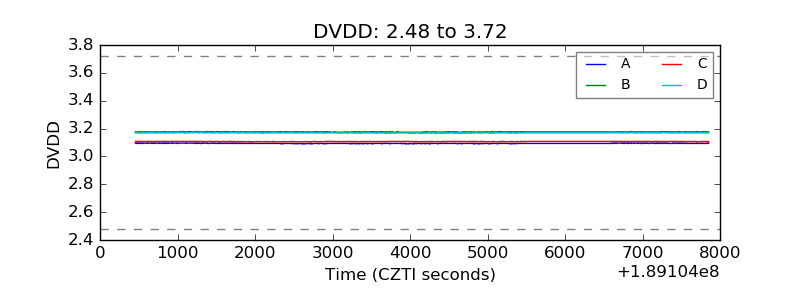 |
| Temperature 1 | 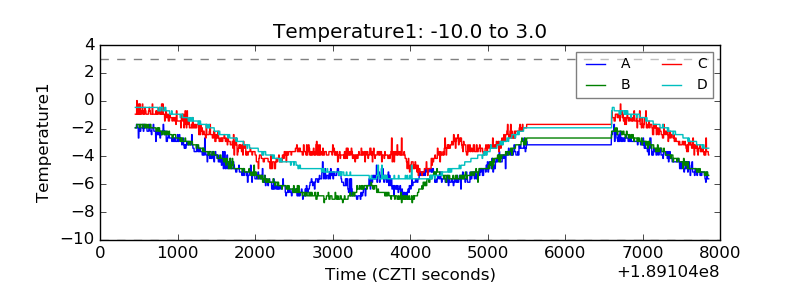 |
| Veto HV Monitor | 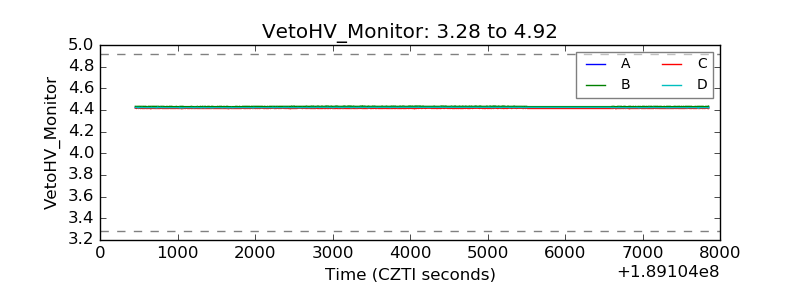 |
| Veto LLD | 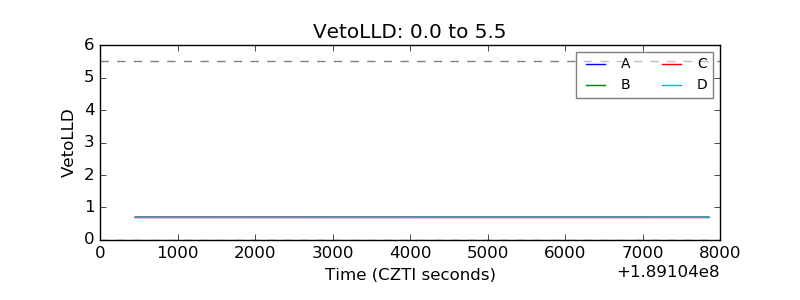 |
| Alpha Counter | 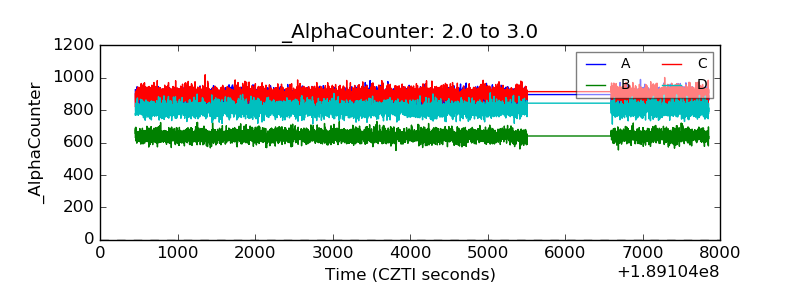 |
| _CPM_Rate | 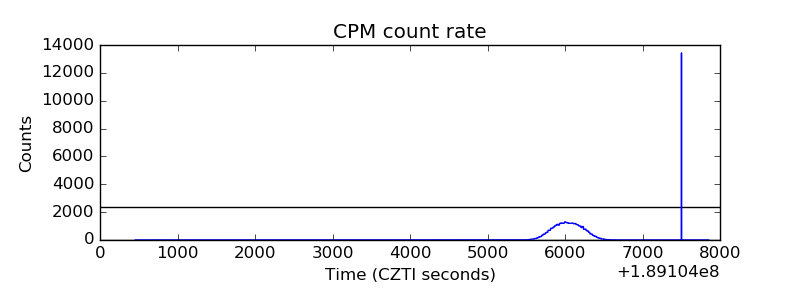 |
| CZT Counter | 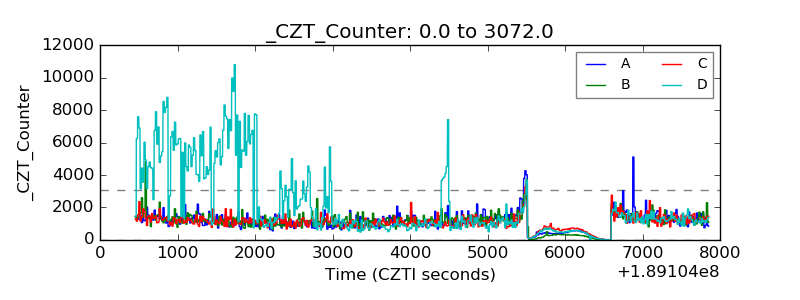 |
| +2.5 Volts monitor |  |
| +5 Volts monitor |  |
| _ROLL_ROT | 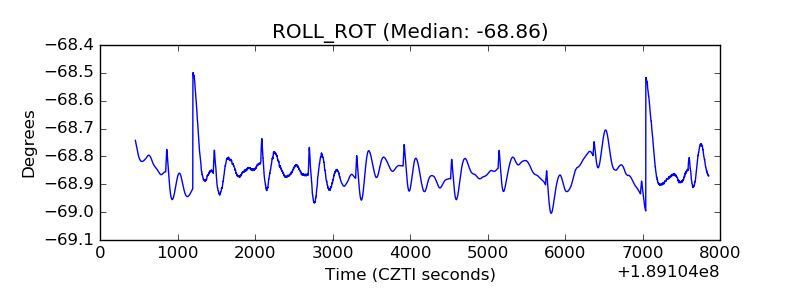 |
| _Roll_DEC | 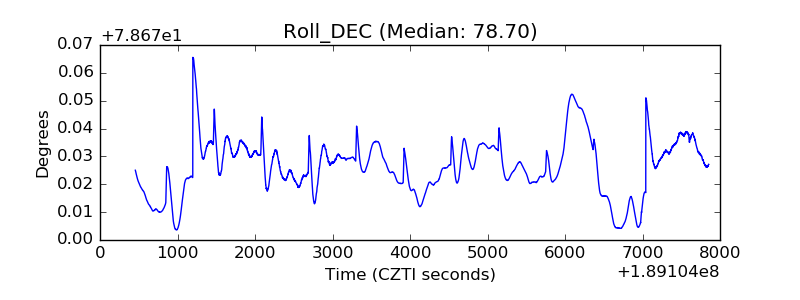 |
| _Roll_RA | 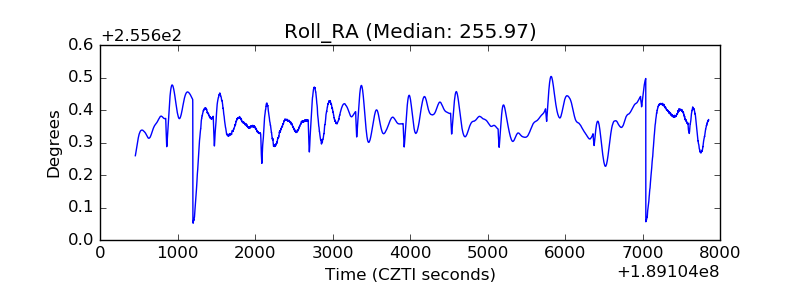 |
| Veto Counter | 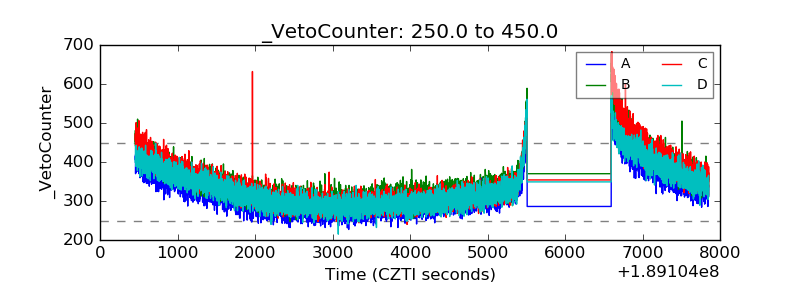 |