| Param | Original file | Final file |
|---|---|---|
| Filename | modeM0/AS1G04_014T02_9000000232_01373cztM0_level2.evt | modeM0/AS1G04_014T02_9000000232_01373cztM0_level2_quad_clean.evt |
| Size (bytes) | 1,049,238,720 | 102,326,400 |
| Size | 1000.6 MB | 97.6 MB |
| Events in quadrant A | 8,148,971 | 661,719 |
| Events in quadrant B | 8,249,661 | 678,537 |
| Events in quadrant C | 7,709,039 | 664,983 |
| Events in quadrant D | 7,243,580 | 646,404 |
| Mode SS | |||
|---|---|---|---|
| Quadrant | BADHDUFLAG | Total packets | Discarded packets |
| A | 0 | 130 | 0 |
| B | 0 | 130 | 0 |
| C | 0 | 130 | 0 |
| D | 0 | 130 | 0 |
| Mode M0 | |||
|---|---|---|---|
| Quadrant | BADHDUFLAG | Total packets | Discarded packets |
| A | 0 | 28730 | 3 |
| B | 0 | 29067 | 2 |
| C | 0 | 27420 | 2 |
| D | 0 | 26096 | 2 |
| Mode M9 | |||
|---|---|---|---|
| Quadrant | BADHDUFLAG | Total packets | Discarded packets |
| A | 0 | 16 | 0 |
| B | 0 | 16 | 0 |
| C | 0 | 16 | 0 |
| D | 0 | 17 | 0 |
| Quadrant | Total seconds | Saturated seconds | Saturation percentage |
|---|---|---|---|
| A | 6414 | 54 | 0.841908% |
| B | 6414 | 33 | 0.514500% |
| C | 6414 | 27 | 0.420954% |
| D | 6414 | 52 | 0.810727% |
Noise dominated data is calculated using 1-second bins in cleaned event files. If a bin has >2000 counts, and if more than 50% of those come from <1% of pixels, then it is considered to be noise-dominated and hence unusable.
| Quadrant | # 1 sec bins | Bins with >0 counts | Bins with >2000 counts | High rate bins dominated by noise | Noise dominated (total time) | Noise dominated (detector-on time) | Marked lightcurve |
|---|---|---|---|---|---|---|---|
| A | 7619 | 6415 | 391 | 391 | 5.13% | 6.10% | 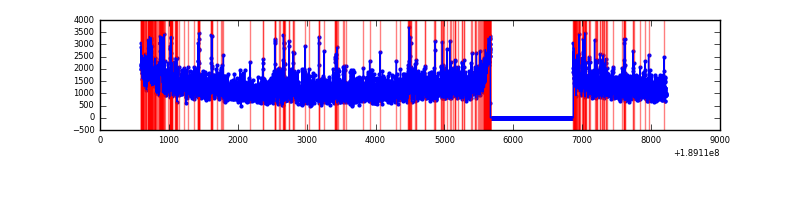 |
| B | 7619 | 6415 | 354 | 354 | 4.65% | 5.52% | 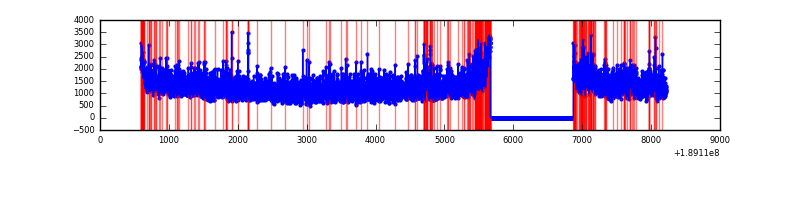 |
| C | 7619 | 6415 | 196 | 196 | 2.57% | 3.06% | 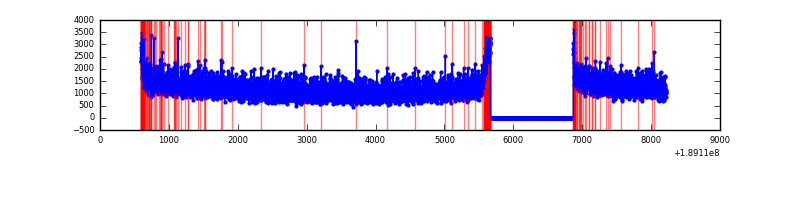 |
| D | 7619 | 6415 | 202 | 202 | 2.65% | 3.15% | 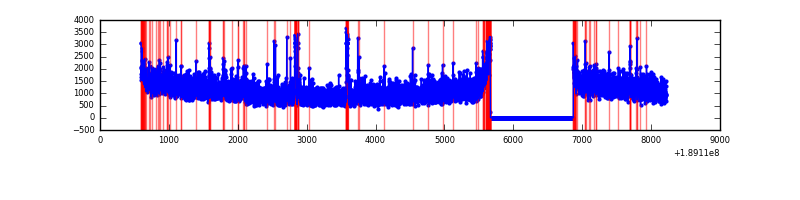 |
Top three noisy pixels from each quadrant. If the there are fewer than three noisy pixels in the level2.evt file, extra rows are filled as -1
| Pixel properties | Quadrant properties | ||||||
|---|---|---|---|---|---|---|---|
| Quadrant | DetID | PixID | Counts | Sigma | Mean | Median | Sigma |
| A | 15 | 127 | 329638 | 708.6 | 1942 | 1958 | 462.4 |
| A | 4 | 32 | 192518 | 412.08 | 1942 | 1958 | 462.4 |
| A | 12 | 243 | 70186 | 147.54 | 1942 | 1958 | 462.4 |
| B | 8 | 4 | 221716 | 458.81 | 2056 | 2063 | 478.7 |
| B | 12 | 52 | 77458 | 157.49 | 2056 | 2063 | 478.7 |
| B | 8 | 219 | 48630 | 97.27 | 2056 | 2063 | 478.7 |
| C | 15 | 241 | 207403 | 390.99 | 1901 | 1972 | 525.4 |
| C | 7 | 159 | 21799 | 37.74 | 1901 | 1972 | 525.4 |
| C | 3 | 111 | 20686 | 35.62 | 1901 | 1972 | 525.4 |
| D | 9 | 53 | 177069 | 311.86 | 1828 | 1895 | 561.7 |
| D | 10 | 125 | 116056 | 203.24 | 1828 | 1895 | 561.7 |
| D | 13 | 73 | 75976 | 131.89 | 1828 | 1895 | 561.7 |
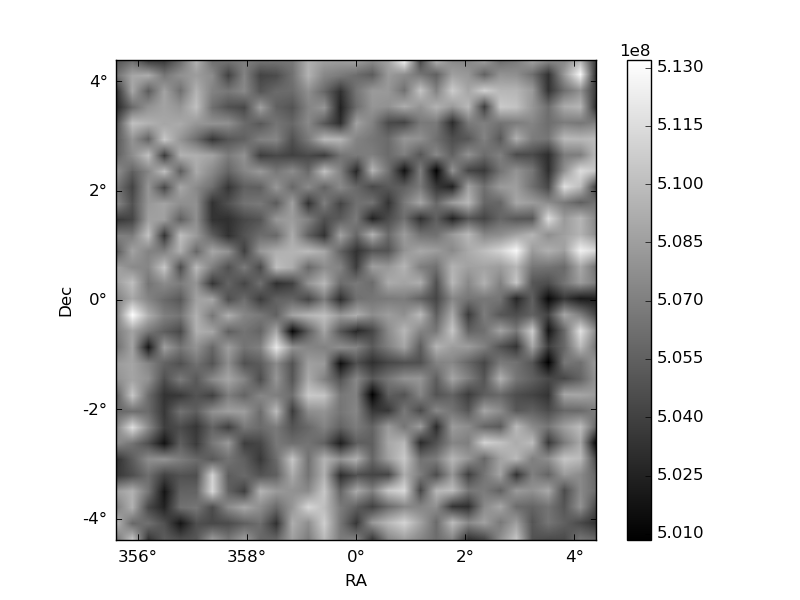
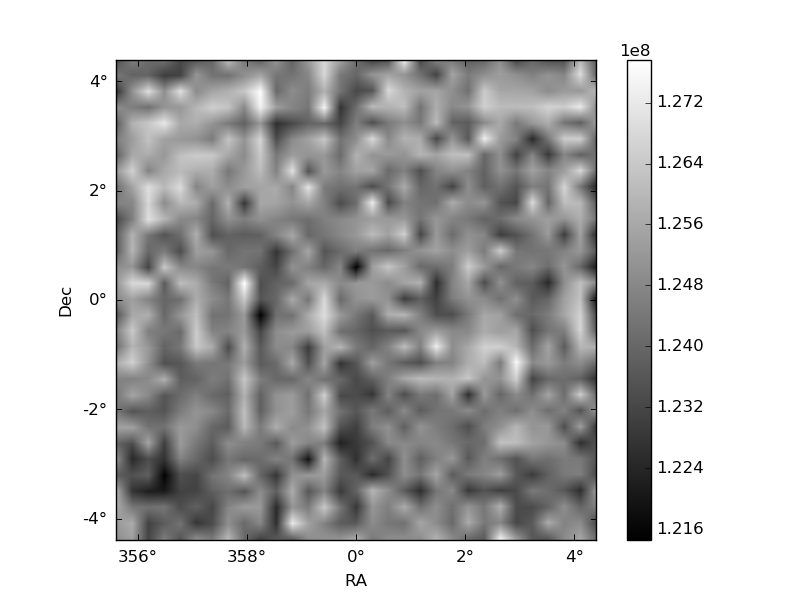
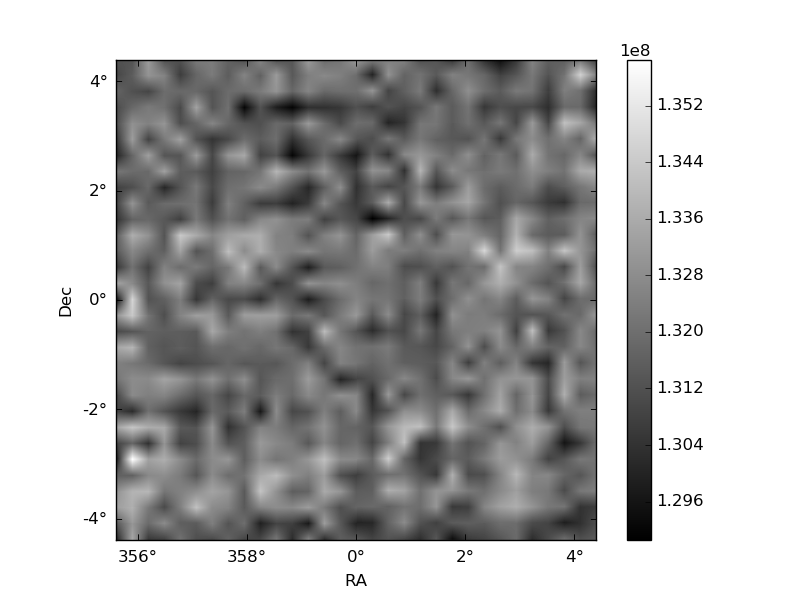
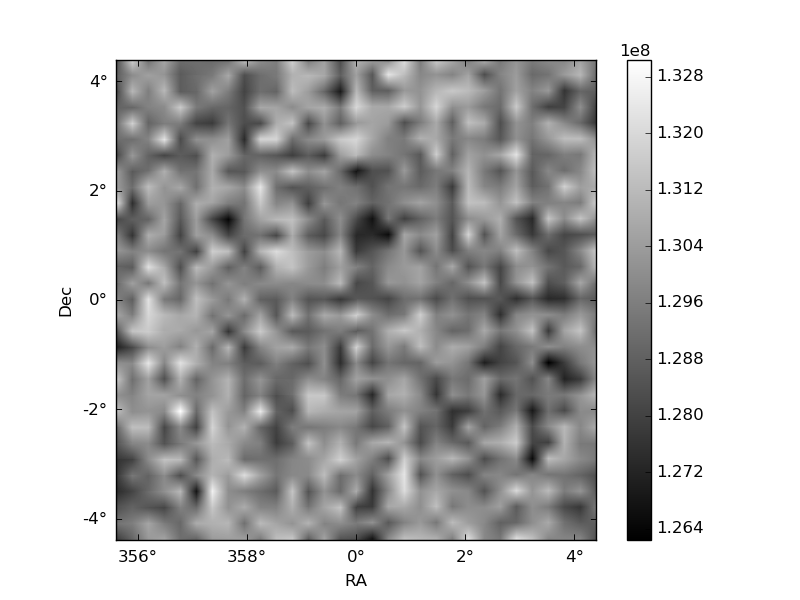
Histogram calculated using DETX and DETY for each event in the final _common_clean file
| Quadrant A | 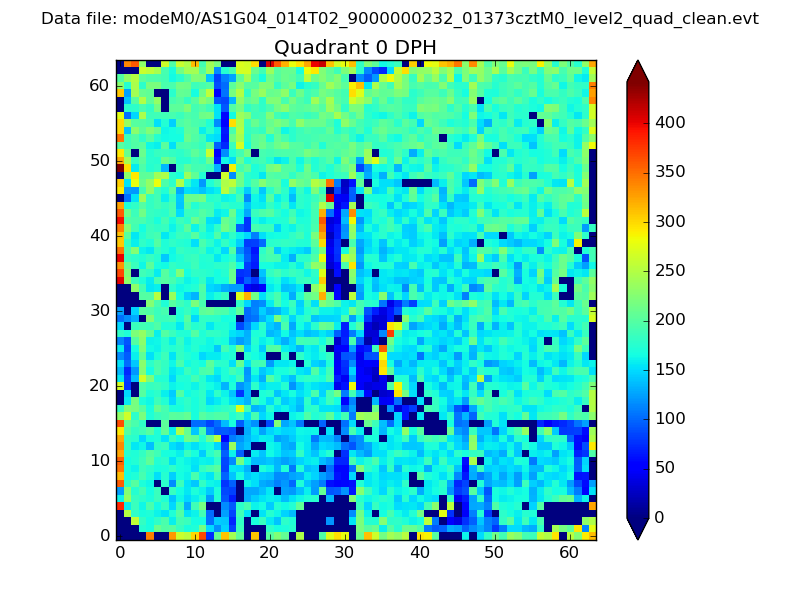 |
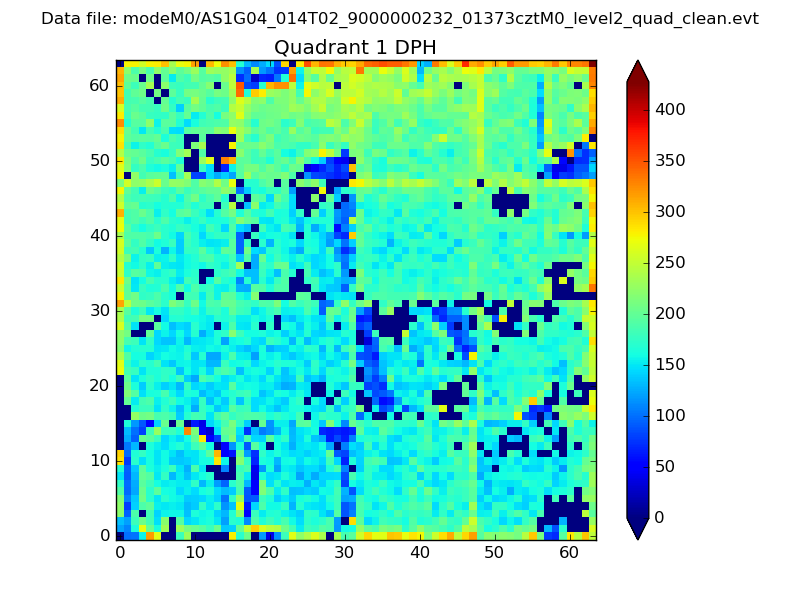 |
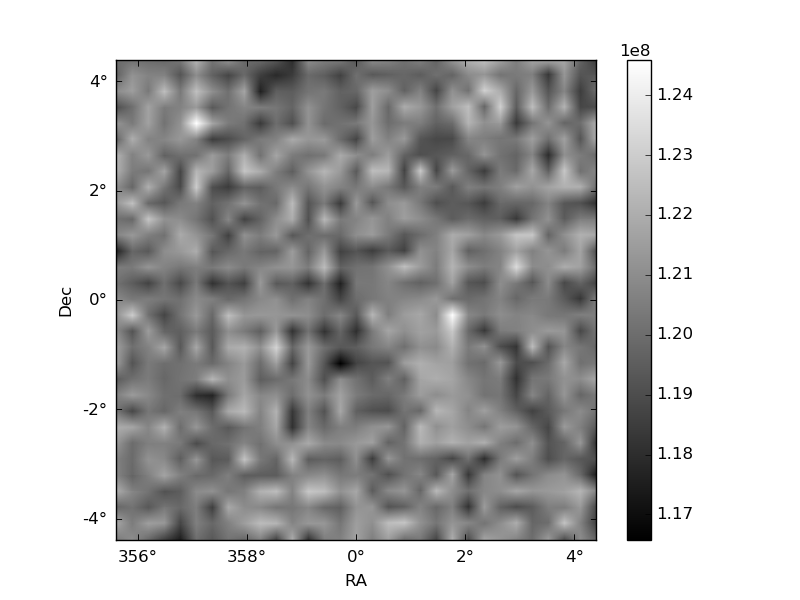
Quadrant B |
|---|---|---|---|
| Quadrant D | 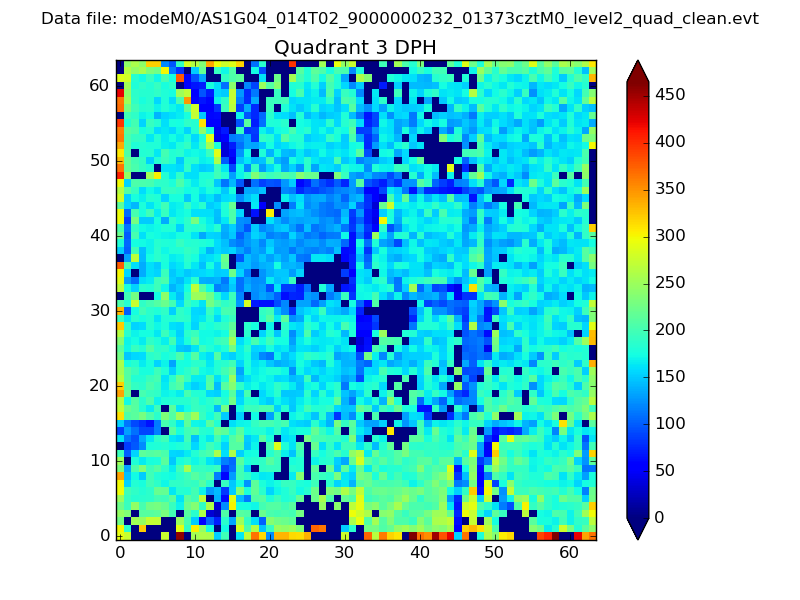 |
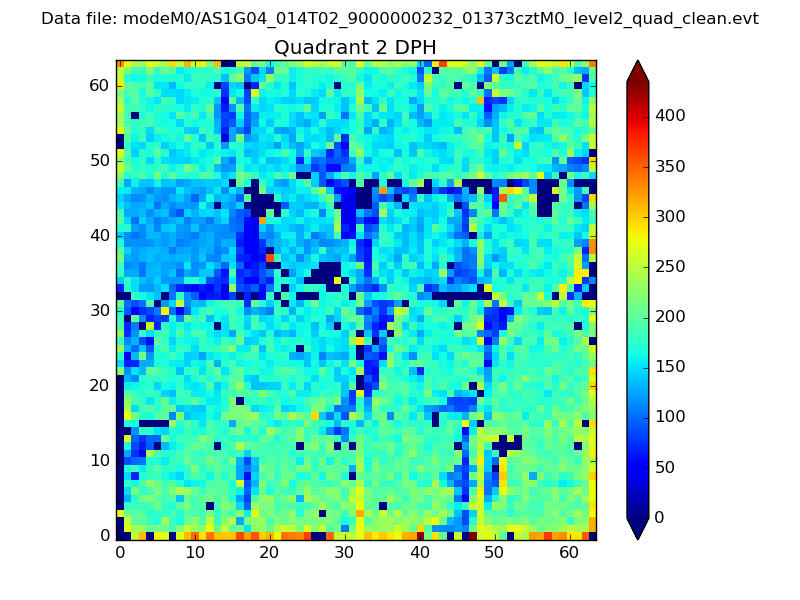 |
Quadrant C |
| Plot type | Count rate plots | Images |
|---|---|---|
| Comparison with Poisson distribution Blue bars denote a histogram of data divided into 1 sec bins. Red curve is a Poisson curve with rate = median count rate of data. |
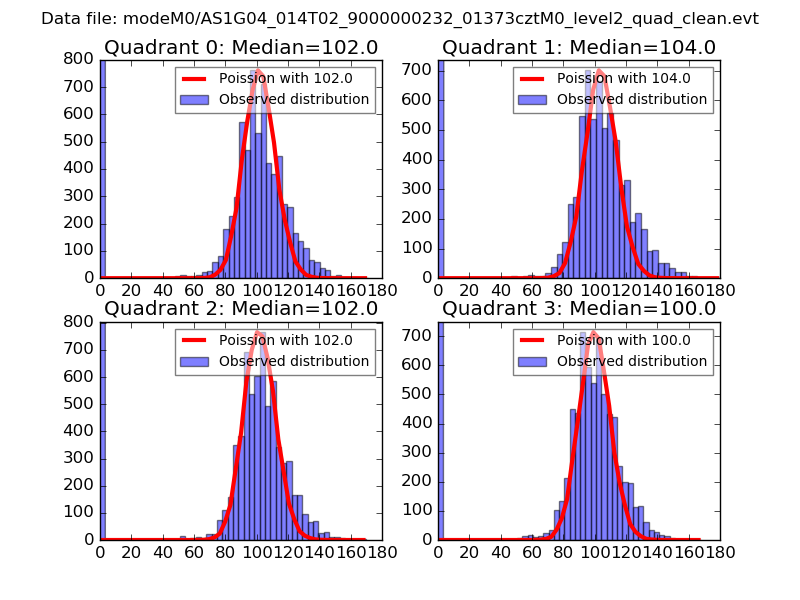 |
 |
| Quadrant-wise count rates Data is divided into 100 sec bins |
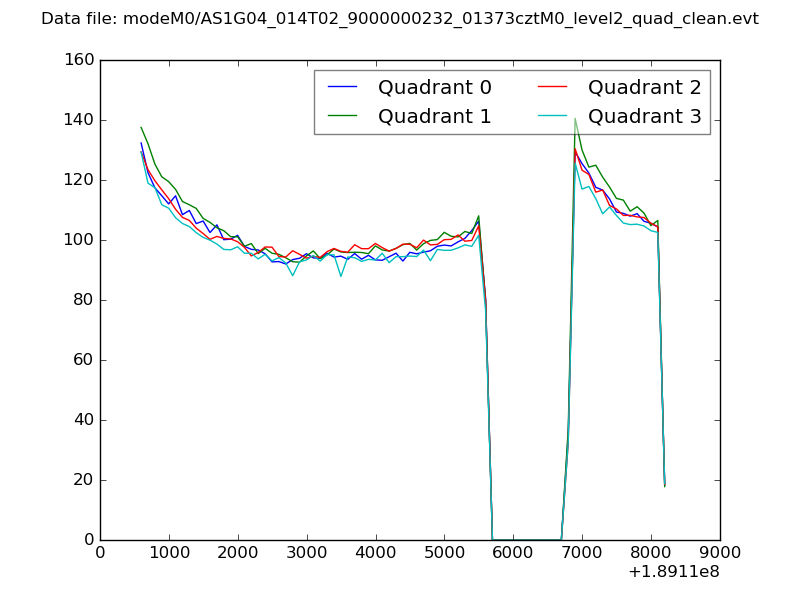 |
|
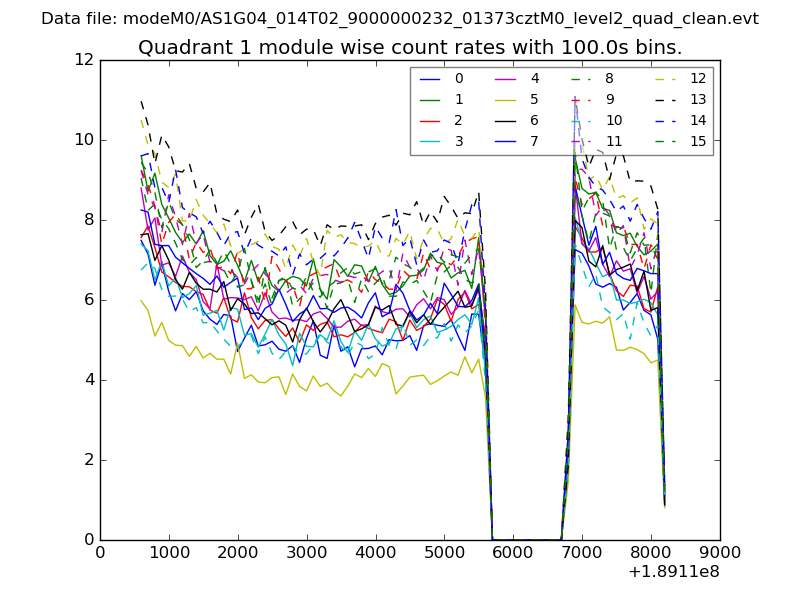
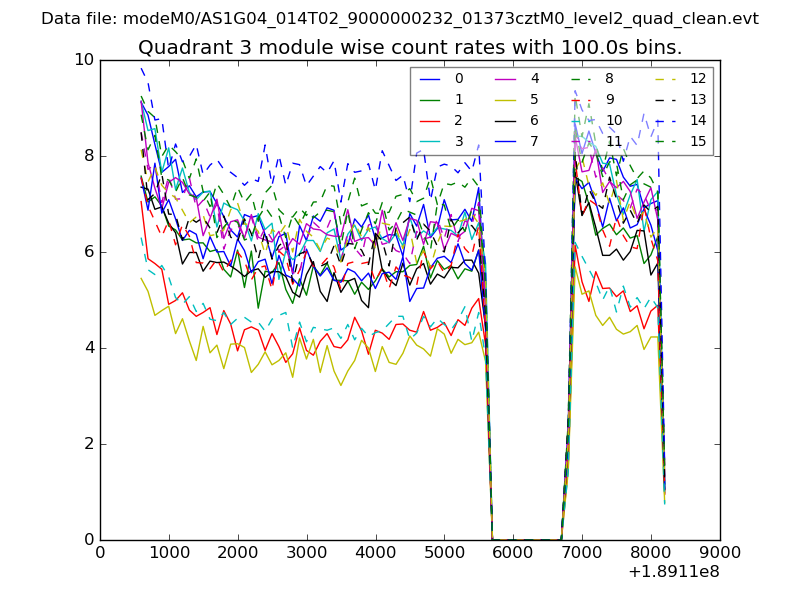
| Module-wise count rates for Quadrant A Data is divided into 100 sec bins |
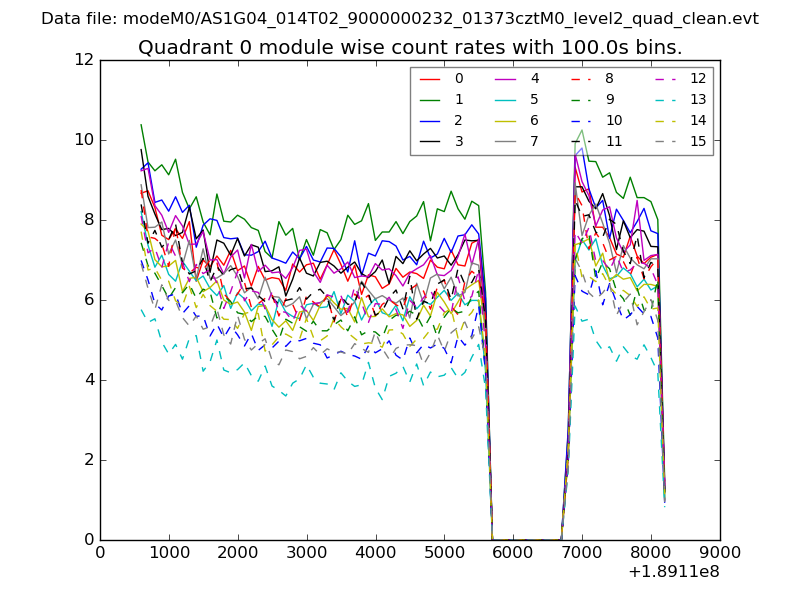 |
 |
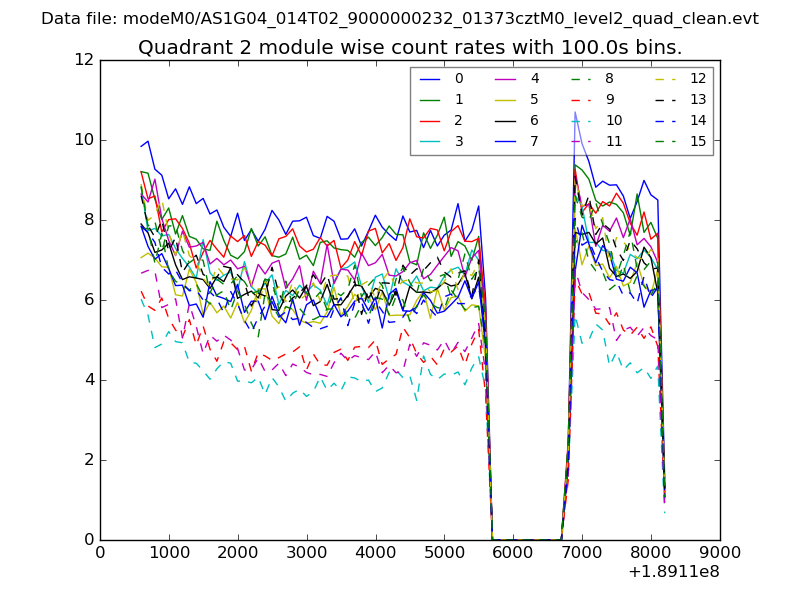
| Module-wise count rates for Quadrant B Data is divided into 100 sec bins |
 |
 |
| Module-wise count rates for Quadrant C Data is divided into 100 sec bins |
 |
 |
| Module-wise count rates for Quadrant D Data is divided into 100 sec bins |
 |
 |
| Parameter | Plot |
|---|---|
| CZT HV Monitor | 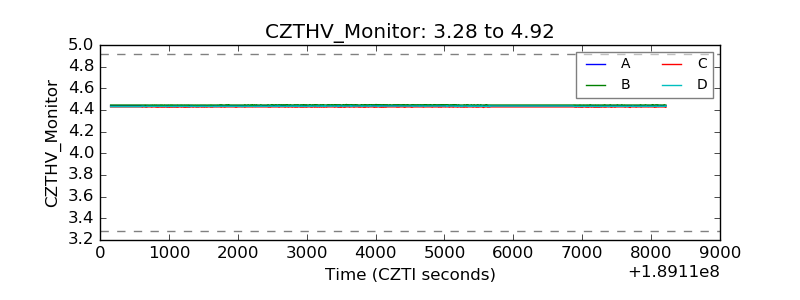 |
| D_VDD | 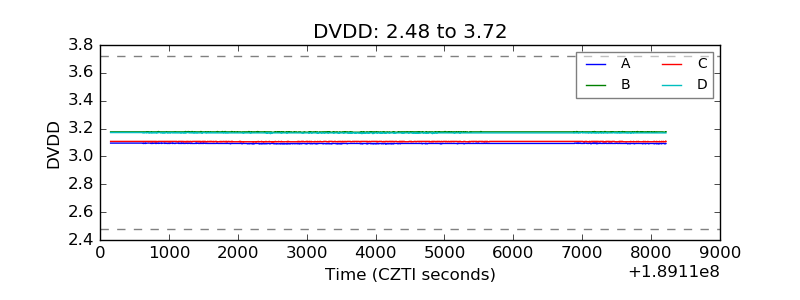 |
| Temperature 1 | 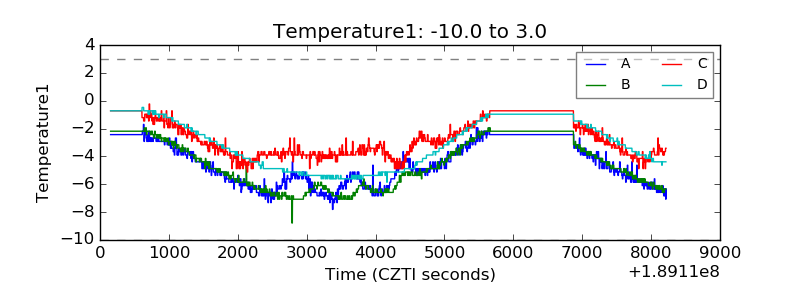 |
| Veto HV Monitor | 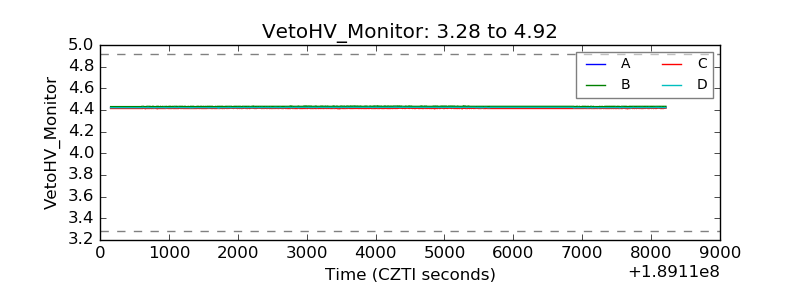 |
| Veto LLD | 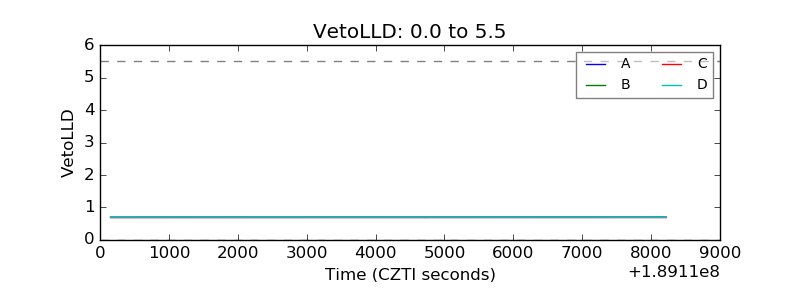 |
| Alpha Counter | 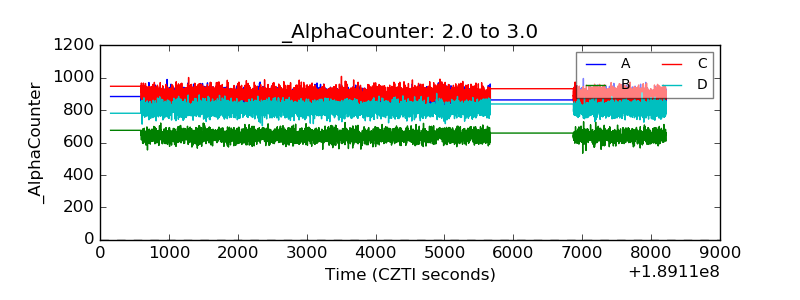 |
| _CPM_Rate | 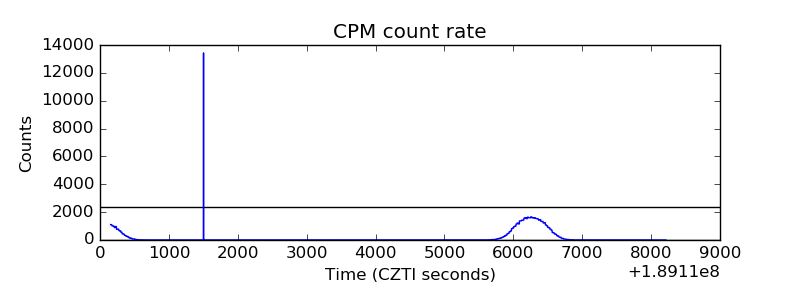 |
| CZT Counter | 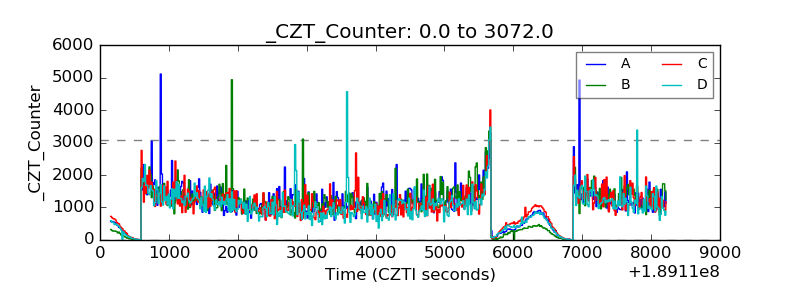 |
| +2.5 Volts monitor |  |
| +5 Volts monitor |  |
| _ROLL_ROT | 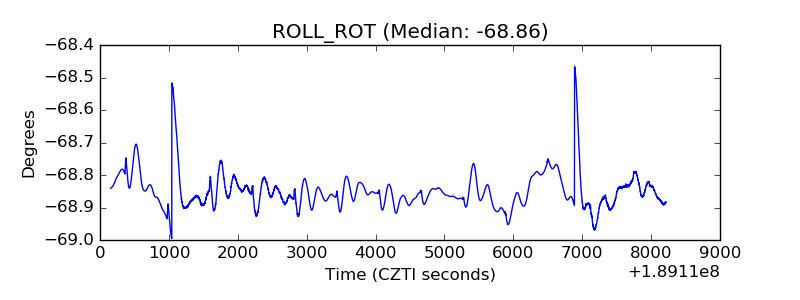 |
| _Roll_DEC | 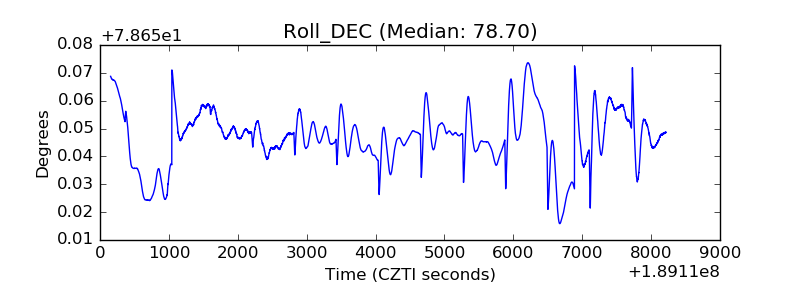 |
| _Roll_RA | 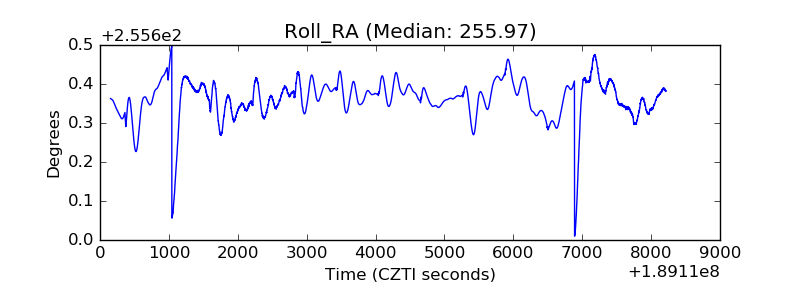 |
| Veto Counter | 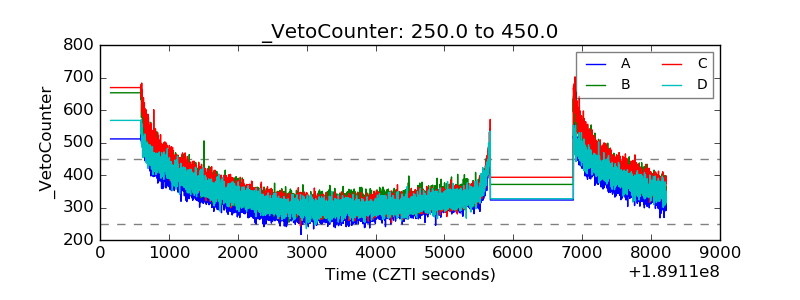 |