| Param | Original file | Final file |
|---|---|---|
| Filename | modeM0/AS1G04_014T02_9000000232_01375cztM0_level2.evt | modeM0/AS1G04_014T02_9000000232_01375cztM0_level2_quad_clean.evt |
| Size (bytes) | 1,055,520,000 | 104,045,760 |
| Size | 1006.6 MB | 99.2 MB |
| Events in quadrant A | 7,655,719 | 676,809 |
| Events in quadrant B | 8,960,569 | 688,512 |
| Events in quadrant C | 7,571,300 | 680,547 |
| Events in quadrant D | 7,344,814 | 648,692 |
| Mode SS | |||
|---|---|---|---|
| Quadrant | BADHDUFLAG | Total packets | Discarded packets |
| A | 0 | 132 | 0 |
| B | 0 | 132 | 0 |
| C | 0 | 132 | 0 |
| D | 0 | 132 | 0 |
| Mode M0 | |||
|---|---|---|---|
| Quadrant | BADHDUFLAG | Total packets | Discarded packets |
| A | 0 | 27411 | 3 |
| B | 0 | 31237 | 2 |
| C | 0 | 27101 | 2 |
| D | 0 | 26536 | 2 |
| Mode M9 | |||
|---|---|---|---|
| Quadrant | BADHDUFLAG | Total packets | Discarded packets |
| A | 0 | 23 | 0 |
| B | 0 | 23 | 0 |
| C | 0 | 23 | 0 |
| D | 0 | 24 | 0 |
| Quadrant | Total seconds | Saturated seconds | Saturation percentage |
|---|---|---|---|
| A | 6549 | 11 | 0.167965% |
| B | 6549 | 29 | 0.442816% |
| C | 6549 | 6 | 0.091617% |
| D | 6549 | 192 | 2.931745% |
Noise dominated data is calculated using 1-second bins in cleaned event files. If a bin has >2000 counts, and if more than 50% of those come from <1% of pixels, then it is considered to be noise-dominated and hence unusable.
| Quadrant | # 1 sec bins | Bins with >0 counts | Bins with >2000 counts | High rate bins dominated by noise | Noise dominated (total time) | Noise dominated (detector-on time) | Marked lightcurve |
|---|---|---|---|---|---|---|---|
| A | 7874 | 6550 | 173 | 173 | 2.20% | 2.64% | 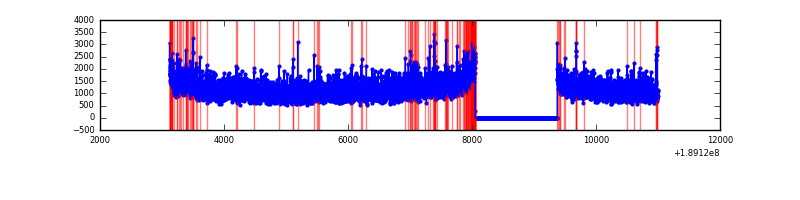 |
| B | 7874 | 6550 | 535 | 535 | 6.79% | 8.17% | 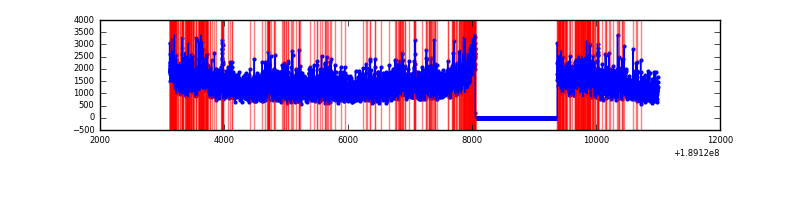 |
| C | 7874 | 6550 | 140 | 140 | 1.78% | 2.14% | 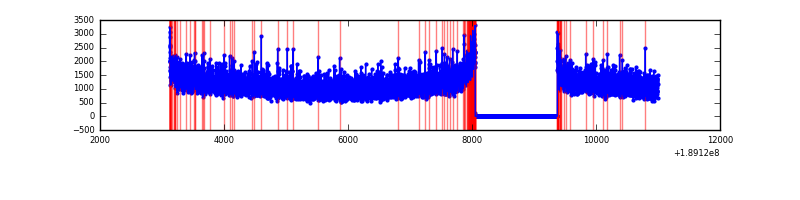 |
| D | 7874 | 6549 | 327 | 327 | 4.15% | 4.99% | 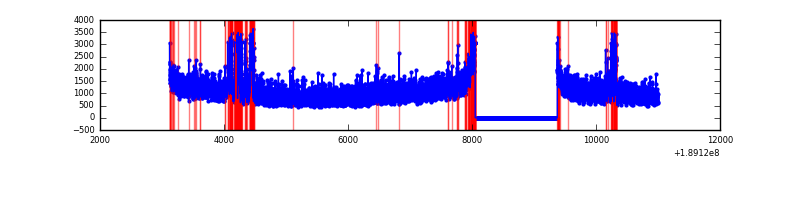 |
Top three noisy pixels from each quadrant. If the there are fewer than three noisy pixels in the level2.evt file, extra rows are filled as -1
| Pixel properties | Quadrant properties | ||||||
|---|---|---|---|---|---|---|---|
| Quadrant | DetID | PixID | Counts | Sigma | Mean | Median | Sigma |
| A | 15 | 127 | 125827 | 266.3 | 1943 | 1955 | 465.2 |
| A | 4 | 32 | 64957 | 135.44 | 1943 | 1955 | 465.2 |
| A | 12 | 243 | 10821 | 19.06 | 1943 | 1955 | 465.2 |
| B | 8 | 4 | 743939 | 1559.1 | 2058 | 2068 | 475.8 |
| B | 6 | 53 | 87528 | 179.6 | 2058 | 2068 | 475.8 |
| B | 12 | 52 | 87059 | 178.61 | 2058 | 2068 | 475.8 |
| C | 15 | 241 | 214856 | 411.34 | 1869 | 1934 | 517.6 |
| C | 3 | 111 | 19302 | 33.55 | 1869 | 1934 | 517.6 |
| C | 7 | 222 | 16999 | 29.1 | 1869 | 1934 | 517.6 |
| D | 13 | 73 | 622528 | 1142.08 | 1752 | 1813 | 543.5 |
| D | 9 | 53 | 98634 | 178.15 | 1752 | 1813 | 543.5 |
| D | 10 | 125 | 43747 | 77.16 | 1752 | 1813 | 543.5 |
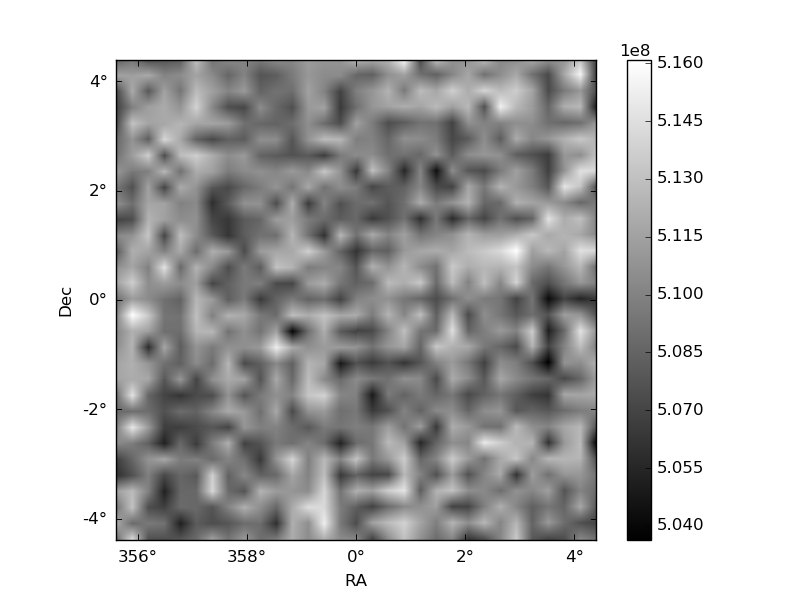
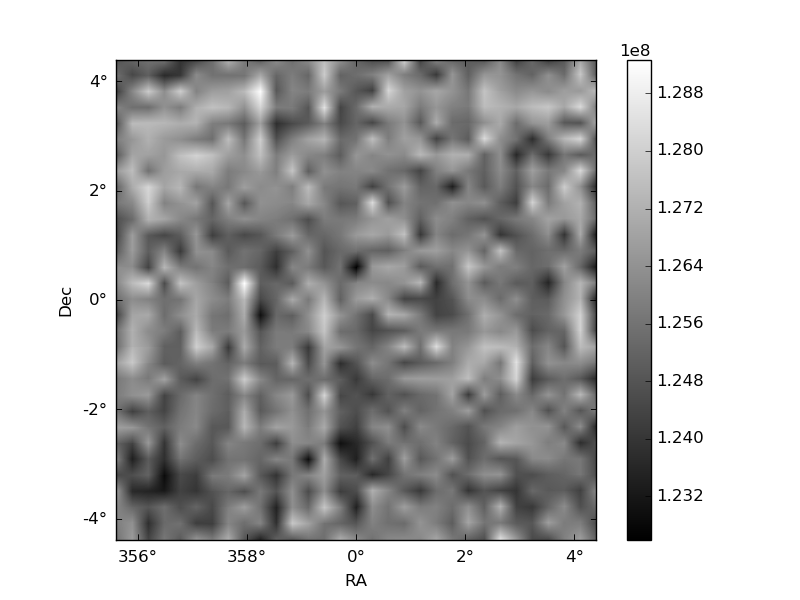
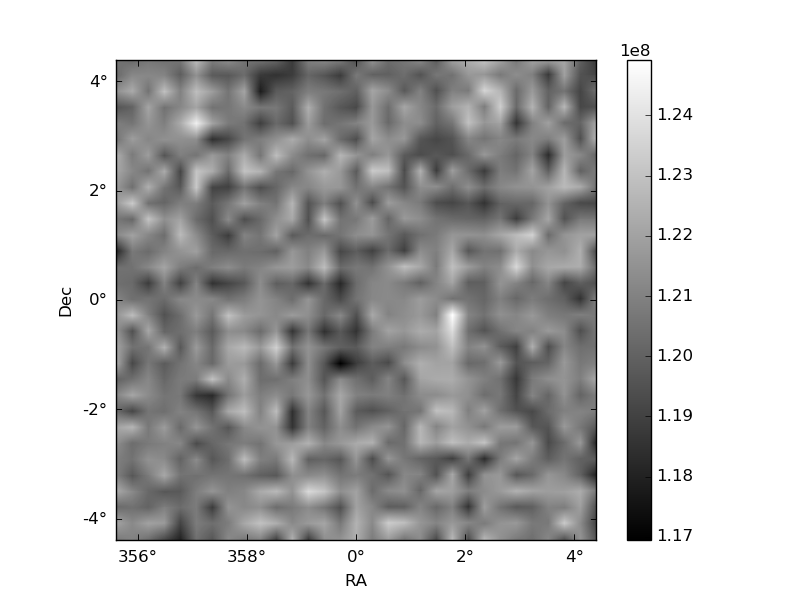
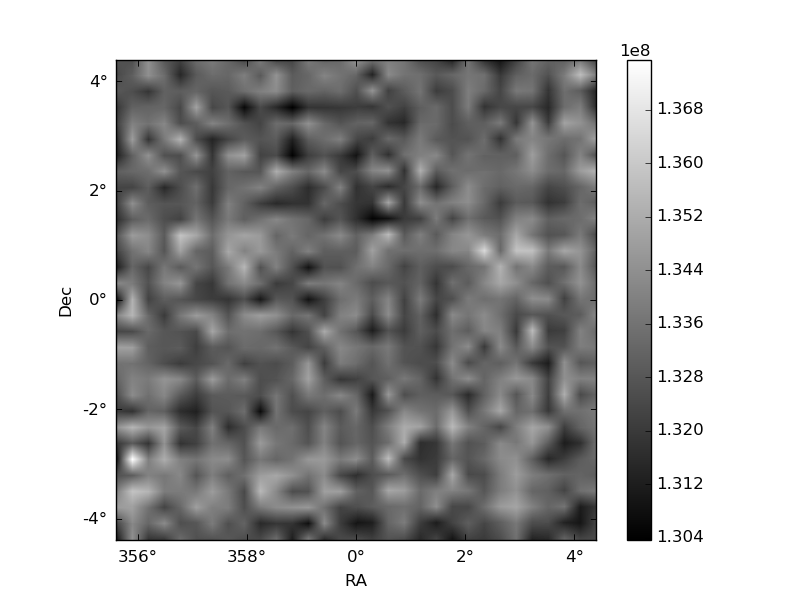
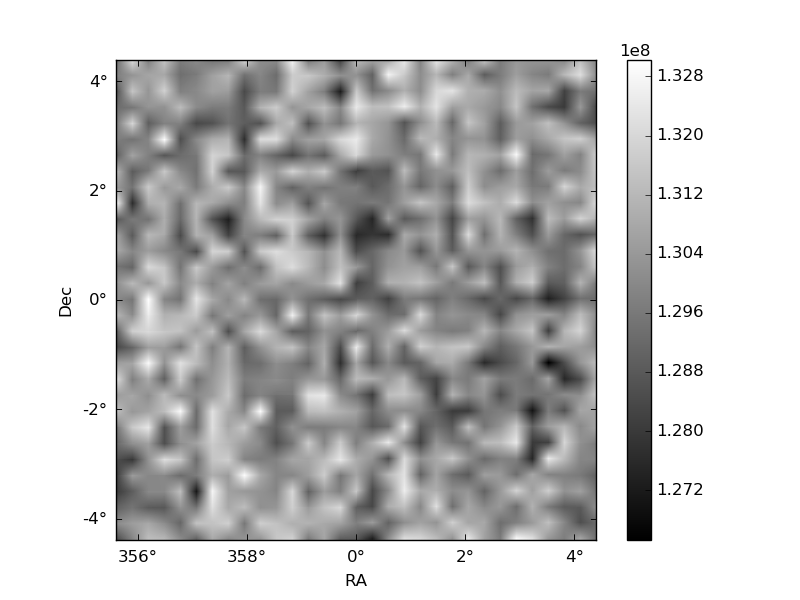
Histogram calculated using DETX and DETY for each event in the final _common_clean file
| Quadrant A | 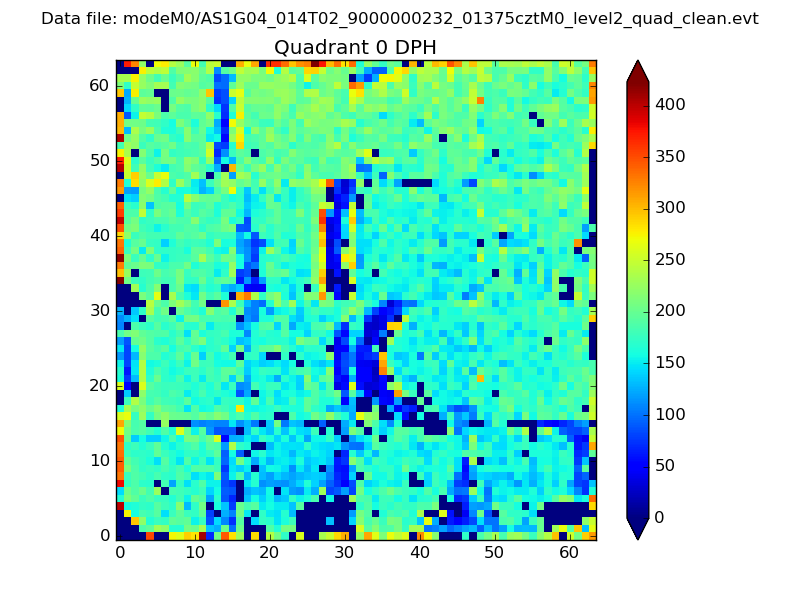 |
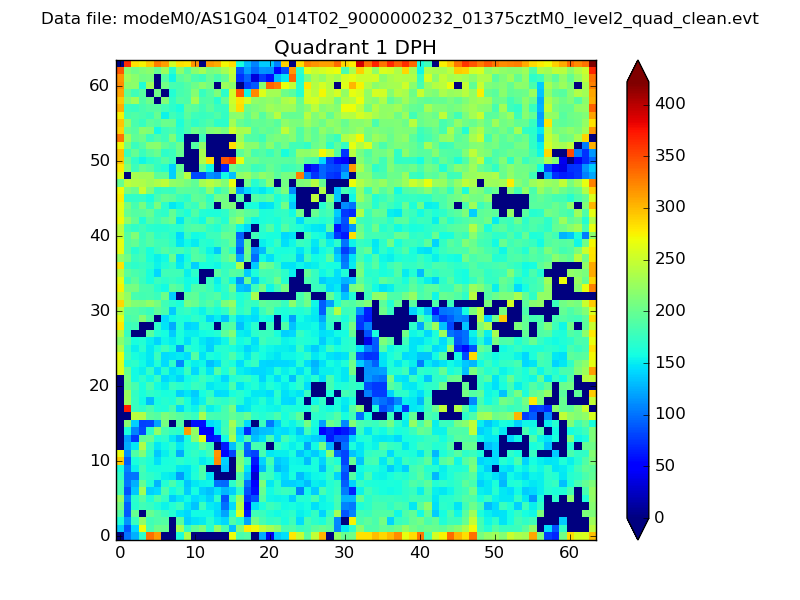 |
Quadrant B |
|---|---|---|---|
| Quadrant D | 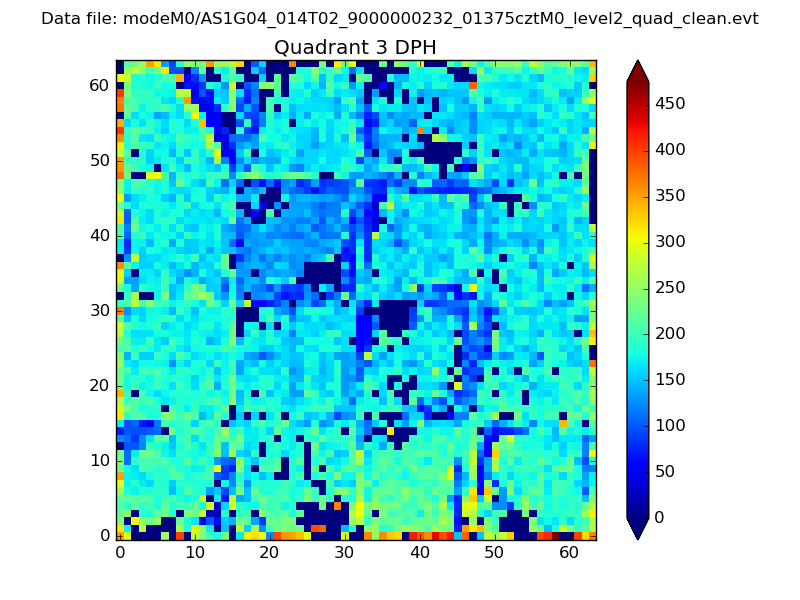 |
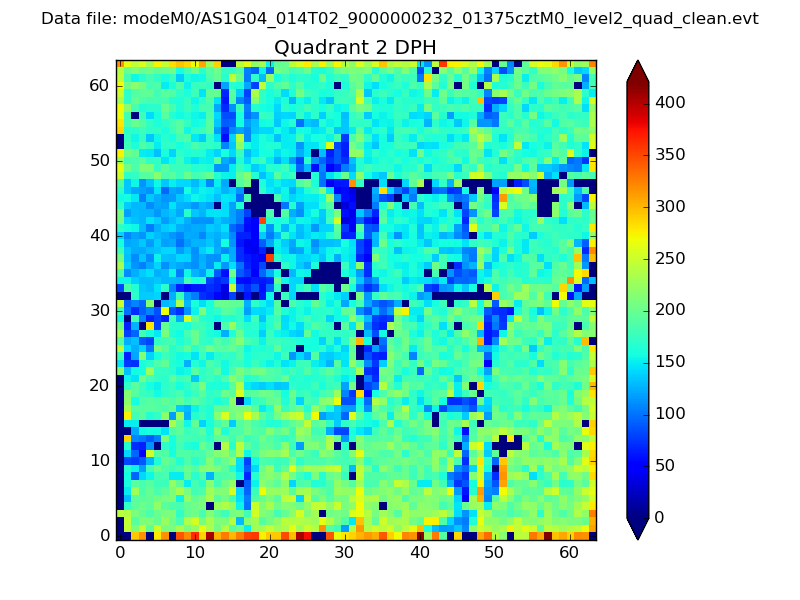 |
Quadrant C |
| Plot type | Count rate plots | Images |
|---|---|---|
| Comparison with Poisson distribution Blue bars denote a histogram of data divided into 1 sec bins. Red curve is a Poisson curve with rate = median count rate of data. |
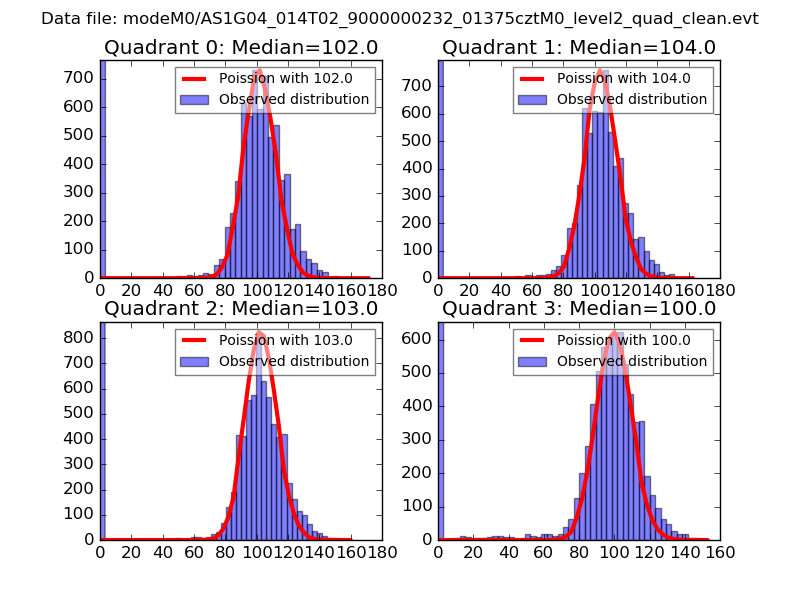 |
 |
| Quadrant-wise count rates Data is divided into 100 sec bins |
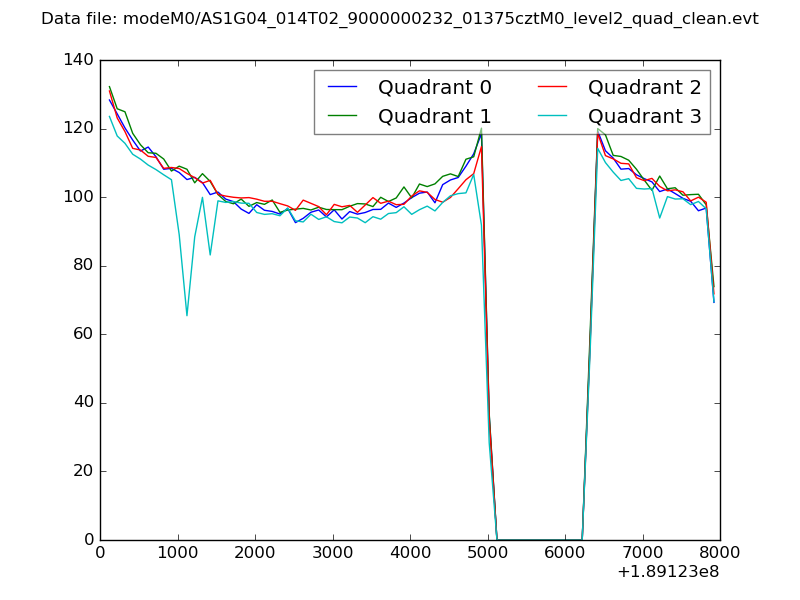 |
|
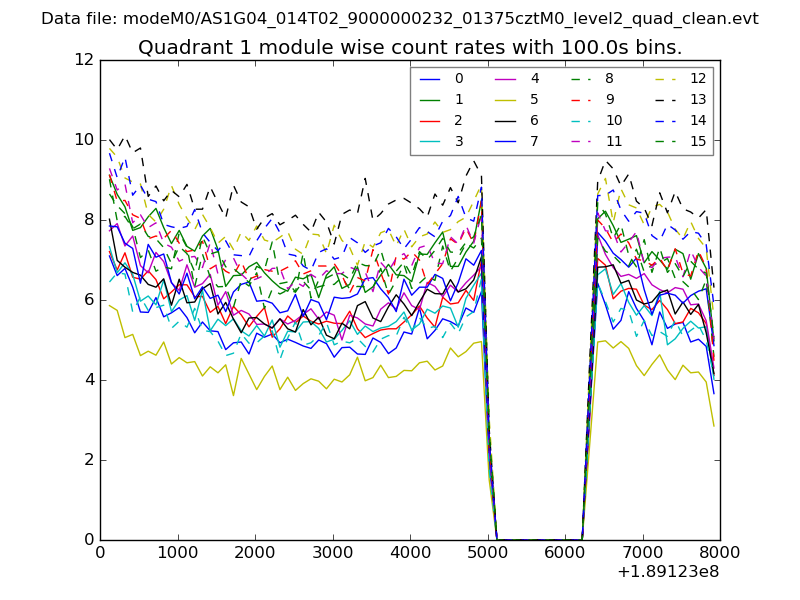
| Module-wise count rates for Quadrant A Data is divided into 100 sec bins |
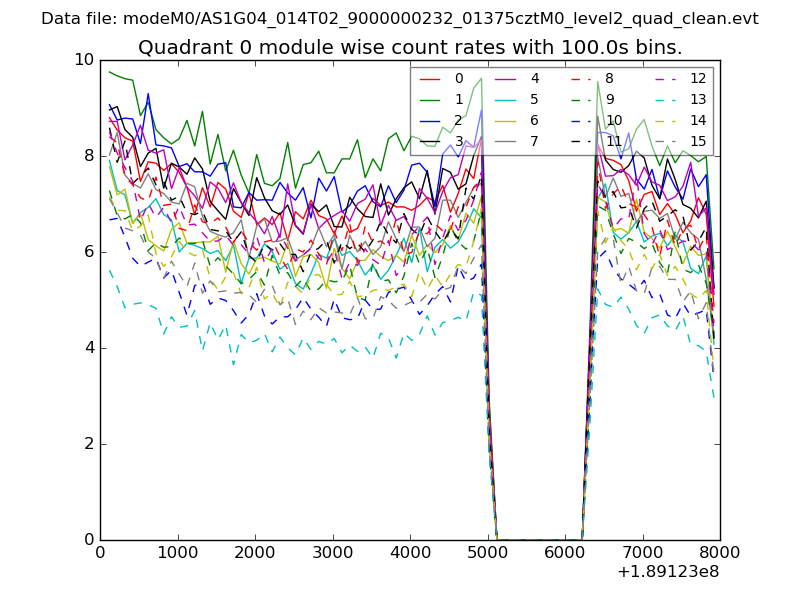 |
 |
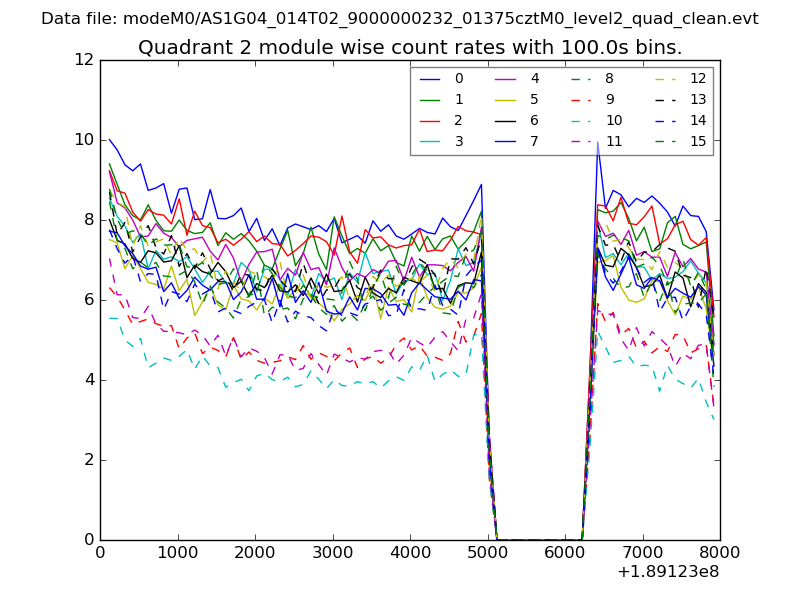
| Module-wise count rates for Quadrant B Data is divided into 100 sec bins |
 |
 |
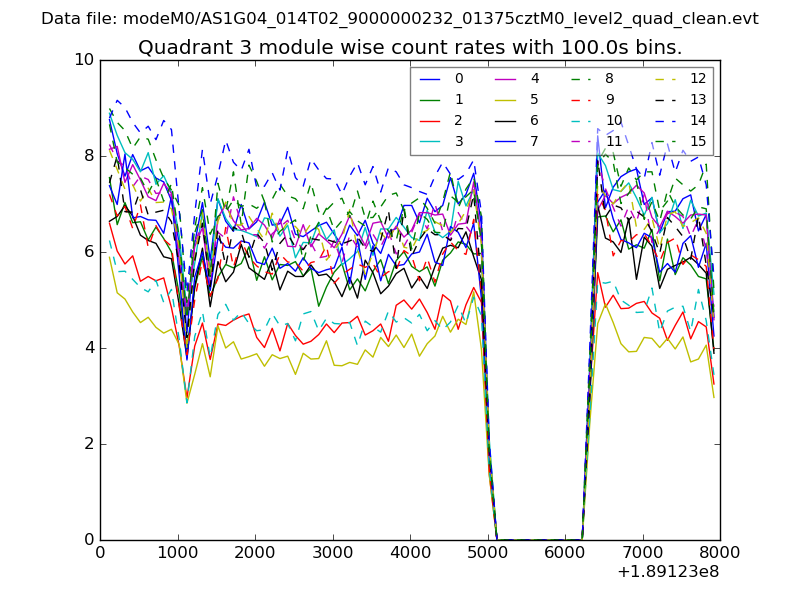
| Module-wise count rates for Quadrant C Data is divided into 100 sec bins |
 |
 |
| Module-wise count rates for Quadrant D Data is divided into 100 sec bins |
 |
 |
| Parameter | Plot |
|---|---|
| CZT HV Monitor | 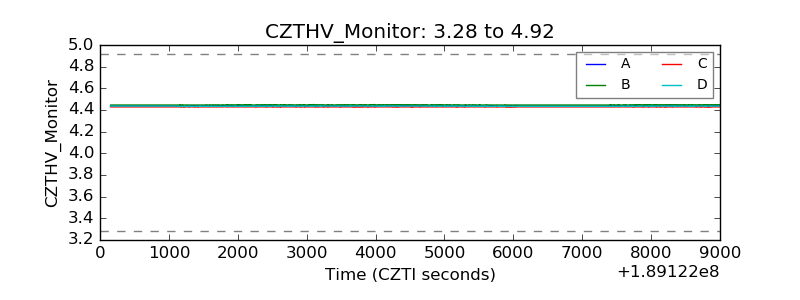 |
| D_VDD | 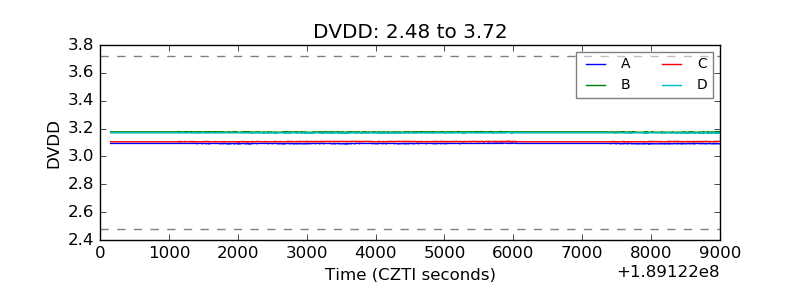 |
| Temperature 1 | 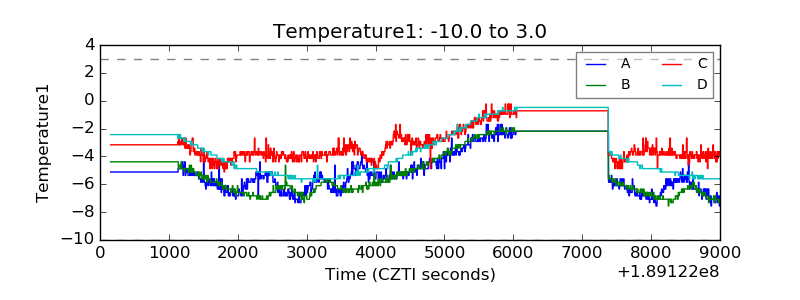 |
| Veto HV Monitor | 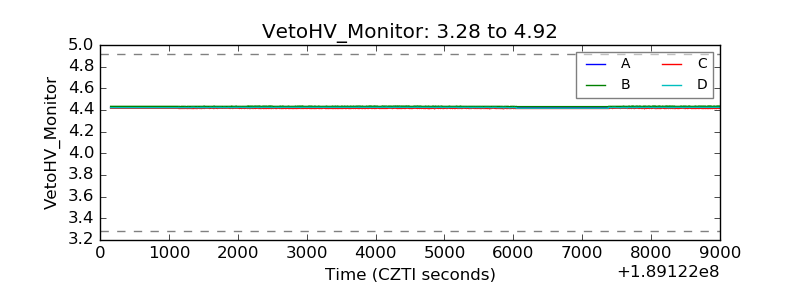 |
| Veto LLD | 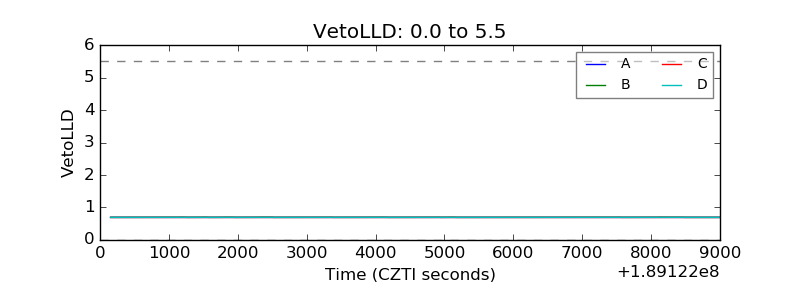 |
| Alpha Counter | 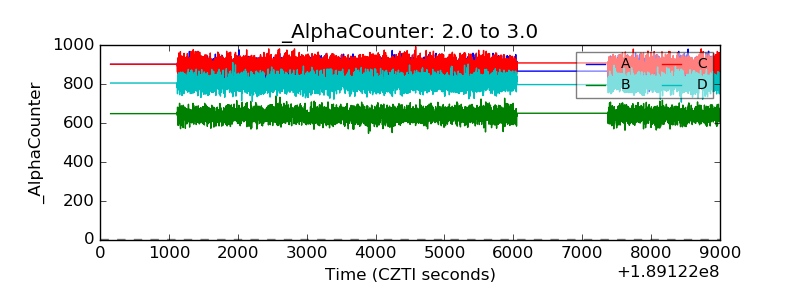 |
| _CPM_Rate | 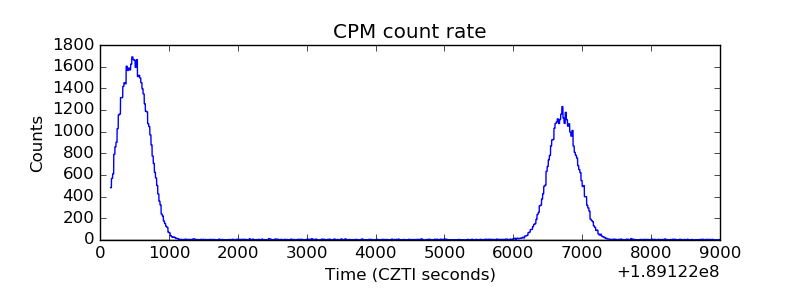 |
| CZT Counter | 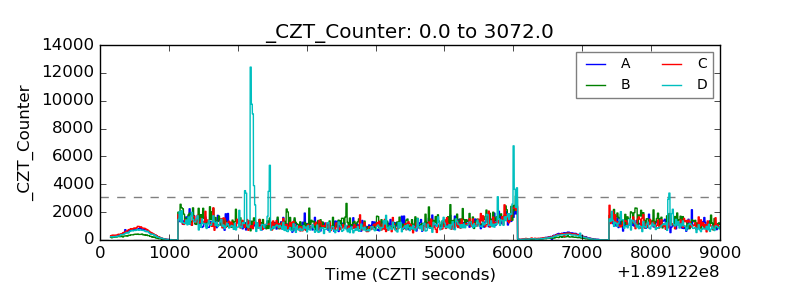 |
| +2.5 Volts monitor |  |
| +5 Volts monitor |  |
| _ROLL_ROT | 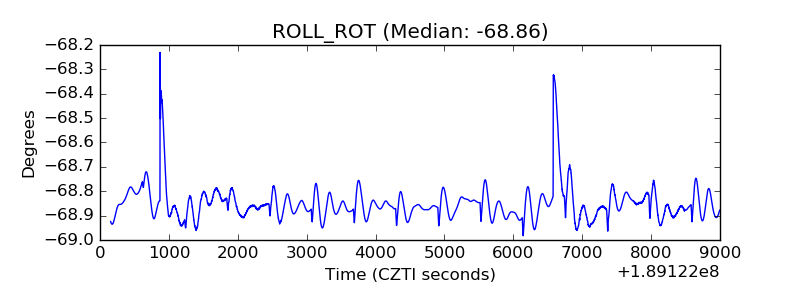 |
| _Roll_DEC | 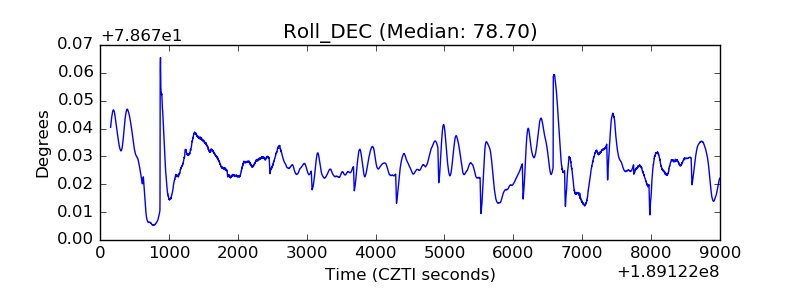 |
| _Roll_RA | 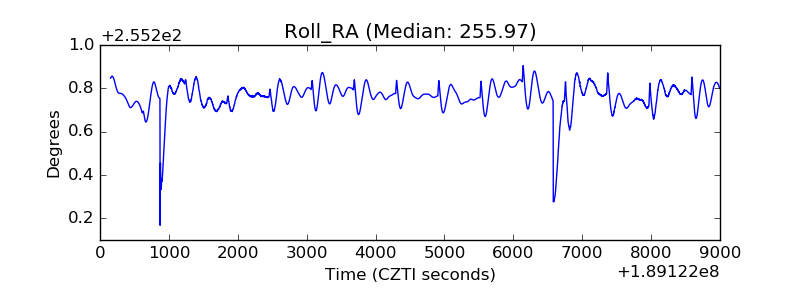 |
| Veto Counter | 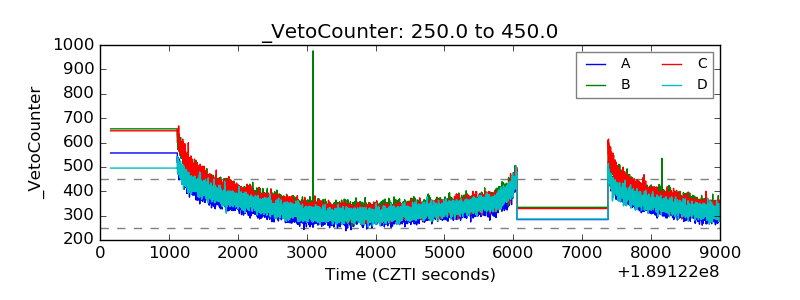 |