| Param | Original file | Final file |
|---|---|---|
| Filename | modeM0/AS1G04_014T02_9000000232_01376cztM0_level2.evt | modeM0/AS1G04_014T02_9000000232_01376cztM0_level2_quad_clean.evt |
| Size (bytes) | 1,047,144,960 | 99,613,440 |
| Size | 998.6 MB | 95.0 MB |
| Events in quadrant A | 7,754,347 | 647,673 |
| Events in quadrant B | 8,653,451 | 658,010 |
| Events in quadrant C | 7,422,640 | 647,474 |
| Events in quadrant D | 7,452,483 | 611,546 |
| Mode SS | |||
|---|---|---|---|
| Quadrant | BADHDUFLAG | Total packets | Discarded packets |
| A | 0 | 130 | 0 |
| B | 0 | 130 | 0 |
| C | 0 | 130 | 0 |
| D | 0 | 130 | 0 |
| Mode M0 | |||
|---|---|---|---|
| Quadrant | BADHDUFLAG | Total packets | Discarded packets |
| A | 0 | 27643 | 2 |
| B | 0 | 30256 | 1 |
| C | 0 | 26680 | 1 |
| D | 0 | 26810 | 5 |
| Mode M9 | |||
|---|---|---|---|
| Quadrant | BADHDUFLAG | Total packets | Discarded packets |
| A | 0 | 12 | 0 |
| B | 0 | 12 | 0 |
| C | 0 | 12 | 0 |
| D | 0 | 12 | 0 |
| Quadrant | Total seconds | Saturated seconds | Saturation percentage |
|---|---|---|---|
| A | 6485 | 23 | 0.354665% |
| B | 6485 | 27 | 0.416345% |
| C | 6485 | 11 | 0.169622% |
| D | 6484 | 323 | 4.981493% |
Noise dominated data is calculated using 1-second bins in cleaned event files. If a bin has >2000 counts, and if more than 50% of those come from <1% of pixels, then it is considered to be noise-dominated and hence unusable.
| Quadrant | # 1 sec bins | Bins with >0 counts | Bins with >2000 counts | High rate bins dominated by noise | Noise dominated (total time) | Noise dominated (detector-on time) | Marked lightcurve |
|---|---|---|---|---|---|---|---|
| A | 7676 | 6487 | 255 | 255 | 3.32% | 3.93% | 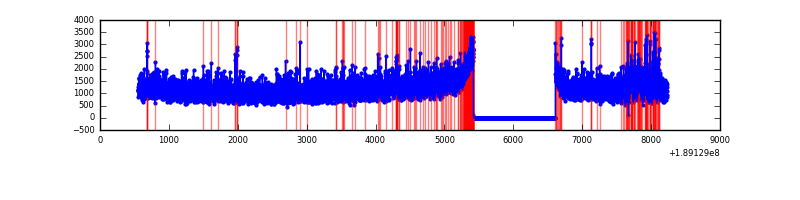 |
| B | 7676 | 6487 | 406 | 406 | 5.29% | 6.26% | 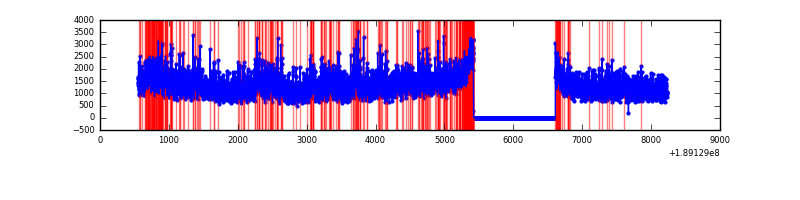 |
| C | 7676 | 6487 | 168 | 168 | 2.19% | 2.59% | 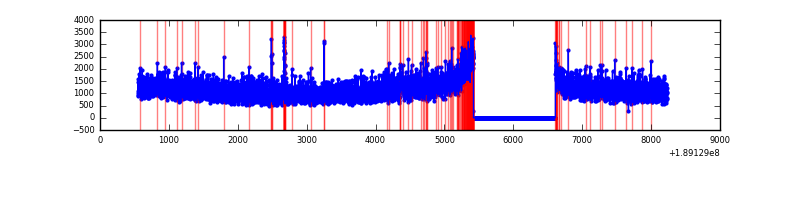 |
| D | 7675 | 6485 | 472 | 472 | 6.15% | 7.28% | 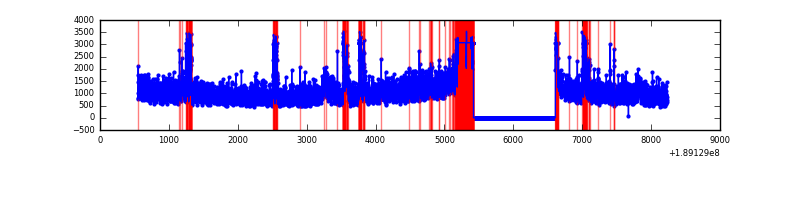 |
Top three noisy pixels from each quadrant. If the there are fewer than three noisy pixels in the level2.evt file, extra rows are filled as -1
| Pixel properties | Quadrant properties | ||||||
|---|---|---|---|---|---|---|---|
| Quadrant | DetID | PixID | Counts | Sigma | Mean | Median | Sigma |
| A | 15 | 127 | 326311 | 702.89 | 1926 | 1940 | 461.5 |
| A | 4 | 32 | 19606 | 38.28 | 1926 | 1940 | 461.5 |
| A | 0 | 253 | 9692 | 16.8 | 1926 | 1940 | 461.5 |
| B | 8 | 4 | 594952 | 1233.66 | 2031 | 2044 | 480.6 |
| B | 12 | 52 | 159597 | 327.82 | 2031 | 2044 | 480.6 |
| B | 6 | 53 | 59083 | 118.68 | 2031 | 2044 | 480.6 |
| C | 15 | 241 | 212784 | 418.57 | 1820 | 1883 | 503.9 |
| C | 7 | 222 | 48390 | 92.3 | 1820 | 1883 | 503.9 |
| C | 9 | 54 | 22572 | 41.06 | 1820 | 1883 | 503.9 |
| D | 13 | 73 | 763896 | 1473.64 | 1669 | 1727 | 517.2 |
| D | 9 | 53 | 405106 | 779.93 | 1669 | 1727 | 517.2 |
| D | 5 | 82 | 23923 | 42.92 | 1669 | 1727 | 517.2 |
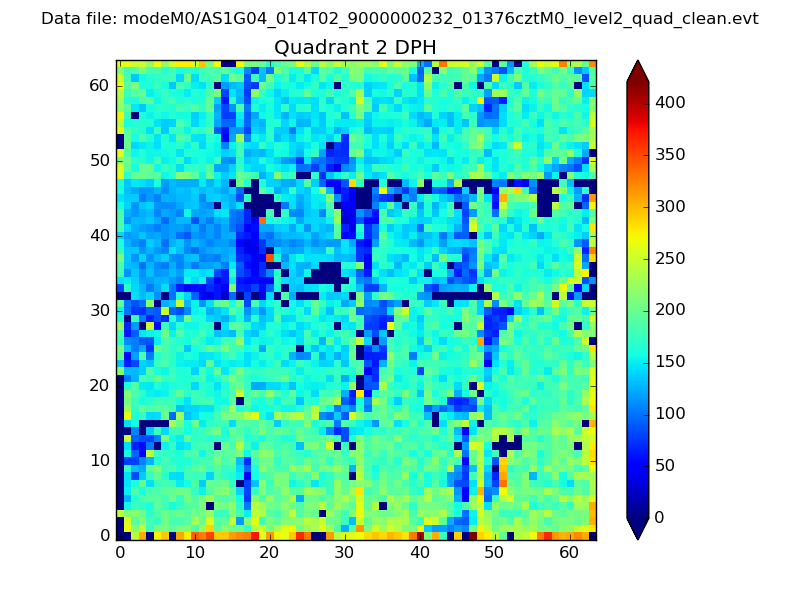
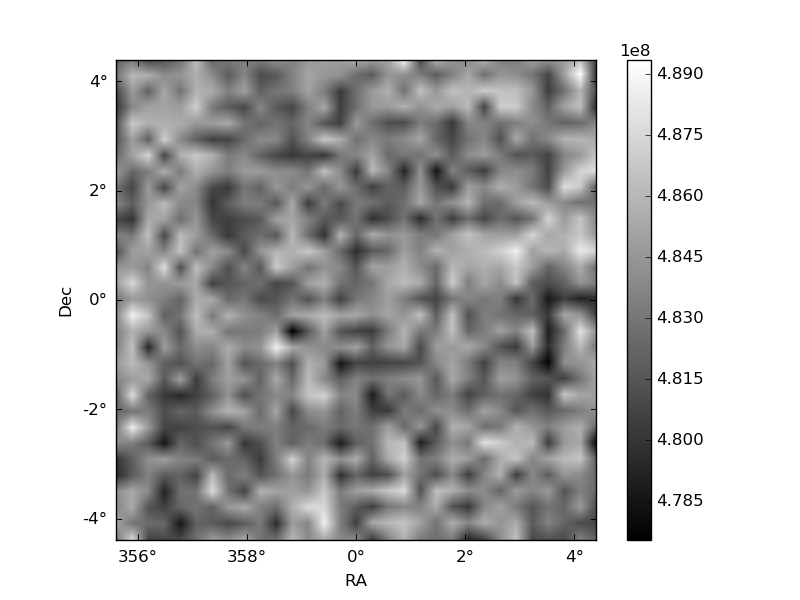
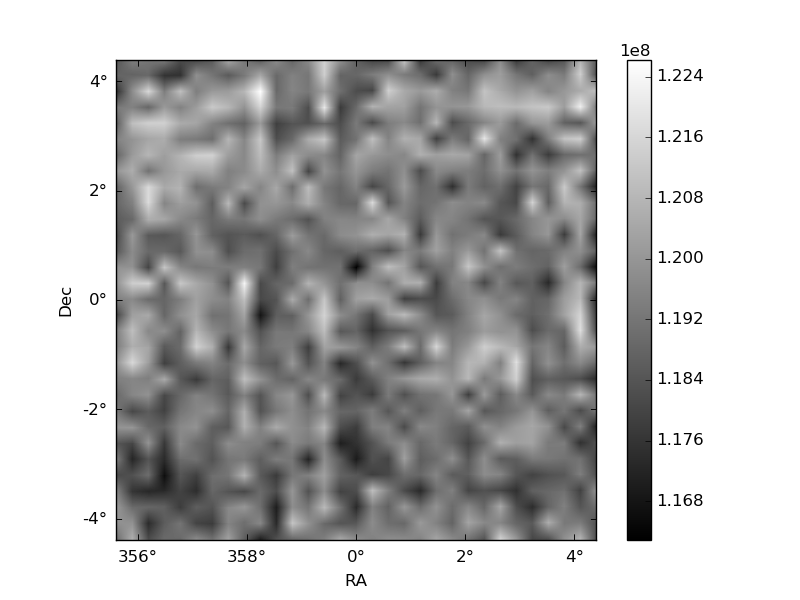
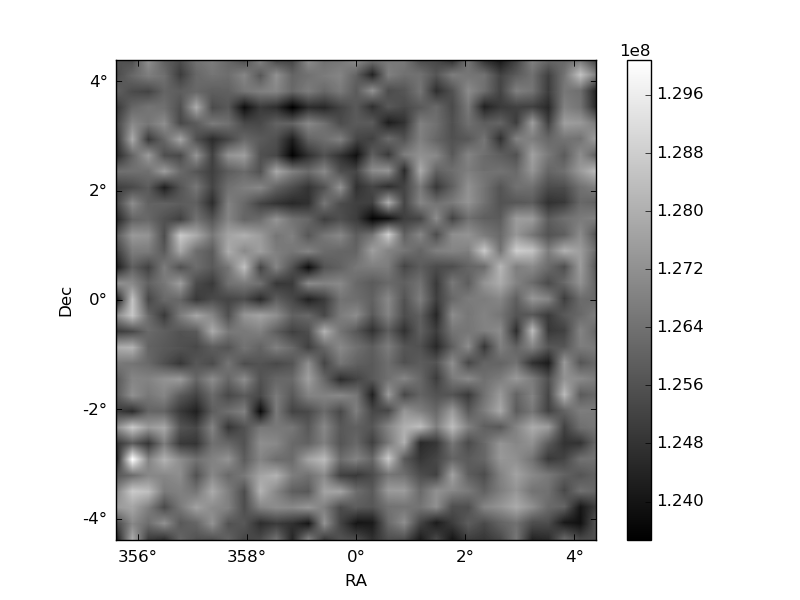
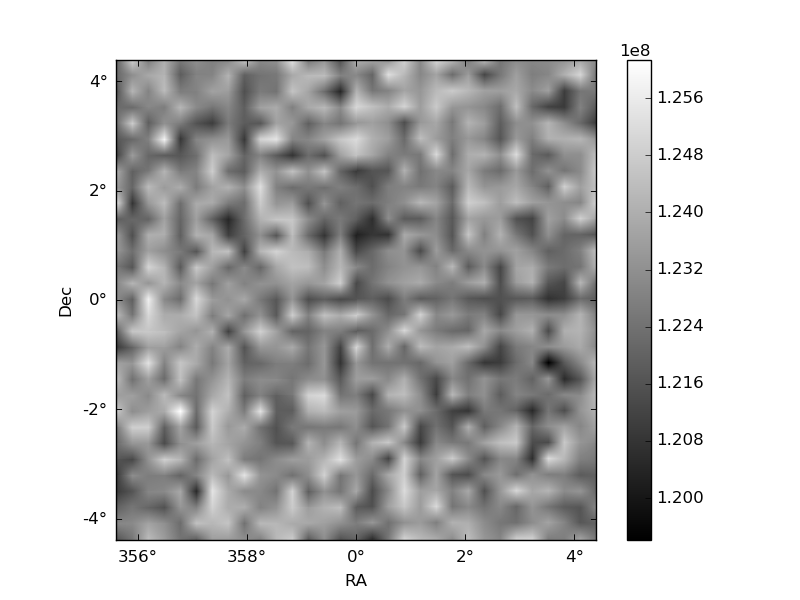
Histogram calculated using DETX and DETY for each event in the final _common_clean file
| Quadrant A | 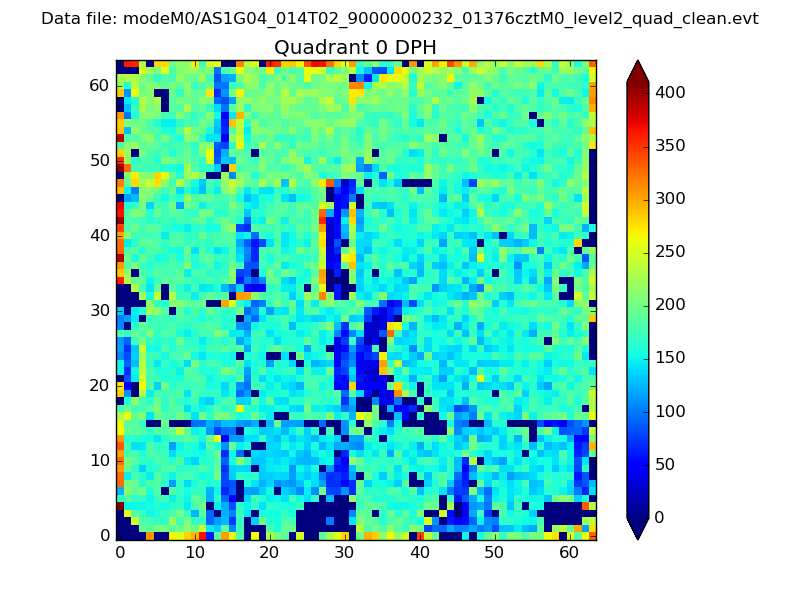 |
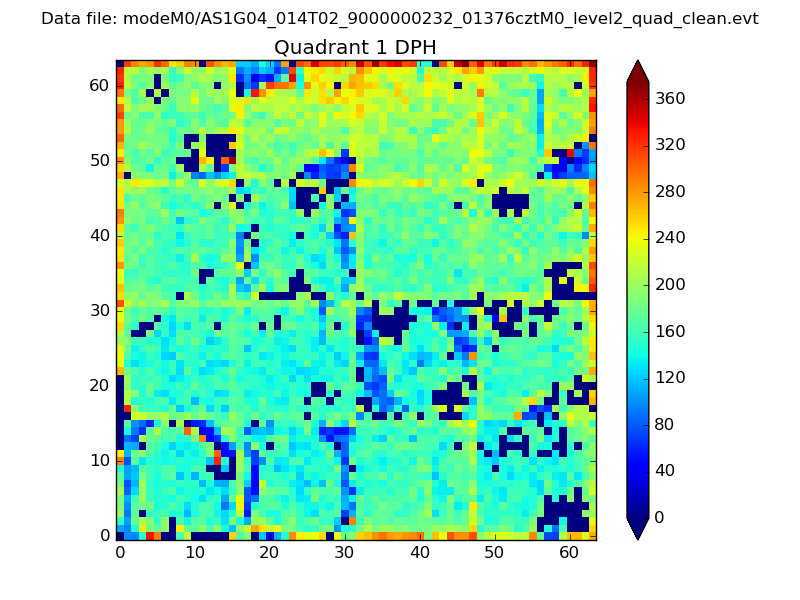 |
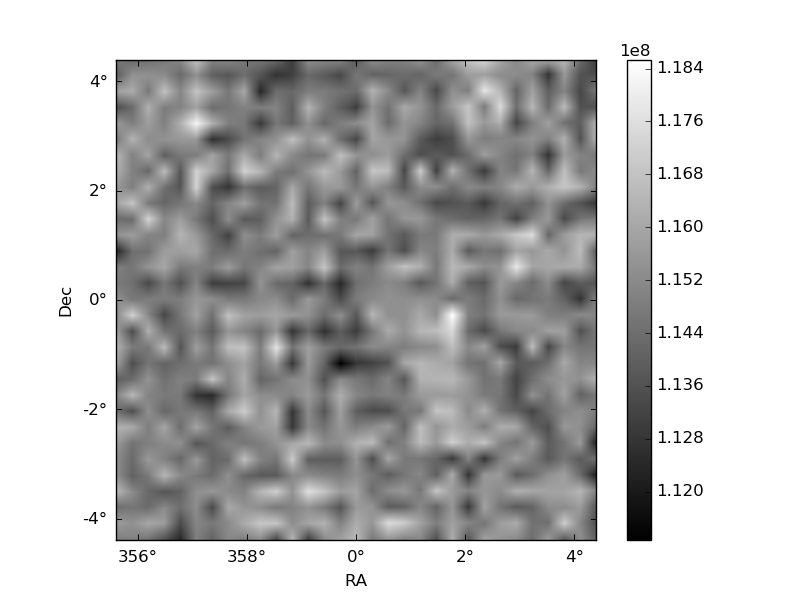
Quadrant B |
|---|---|---|---|
| Quadrant D | 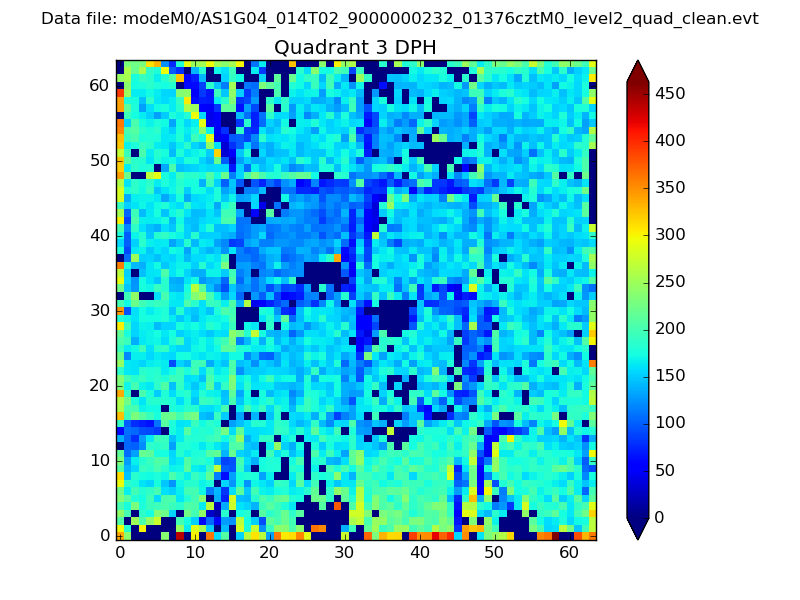 |
 |
Quadrant C |
| Plot type | Count rate plots | Images |
|---|---|---|
| Comparison with Poisson distribution Blue bars denote a histogram of data divided into 1 sec bins. Red curve is a Poisson curve with rate = median count rate of data. |
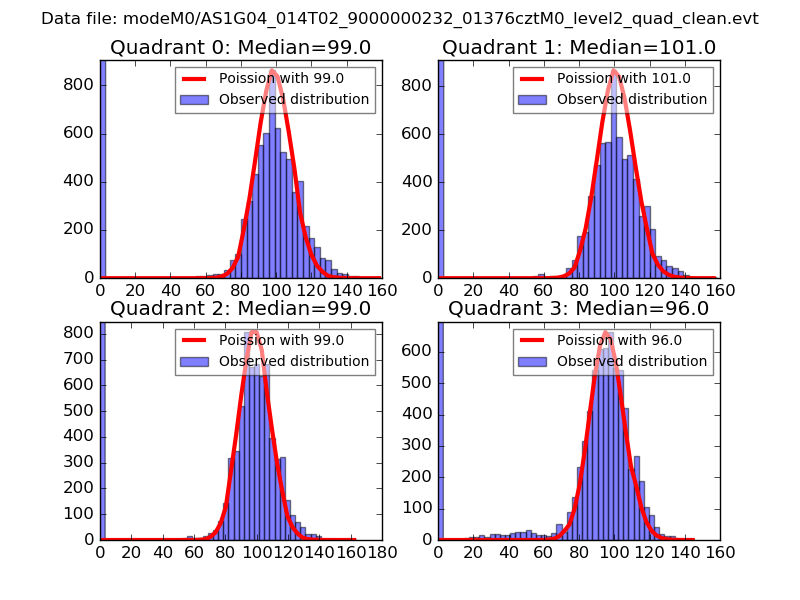 |
 |
| Quadrant-wise count rates Data is divided into 100 sec bins |
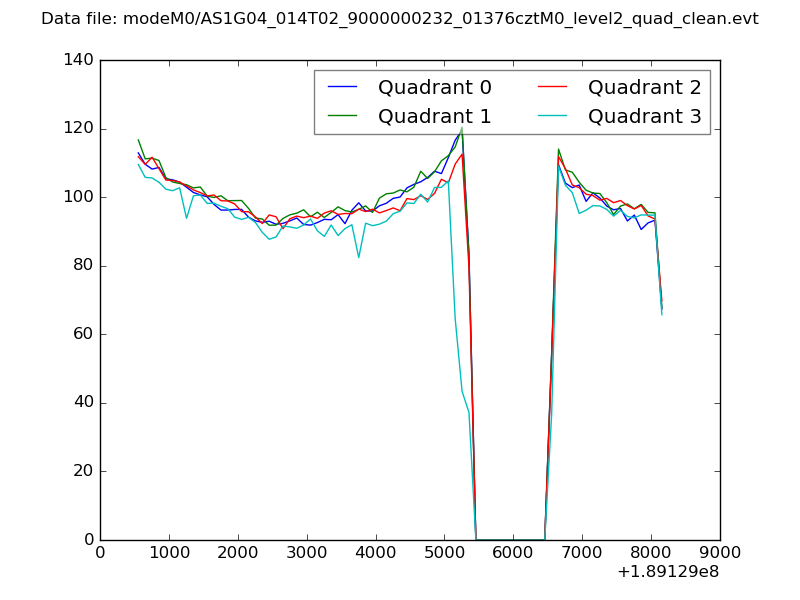 |
|
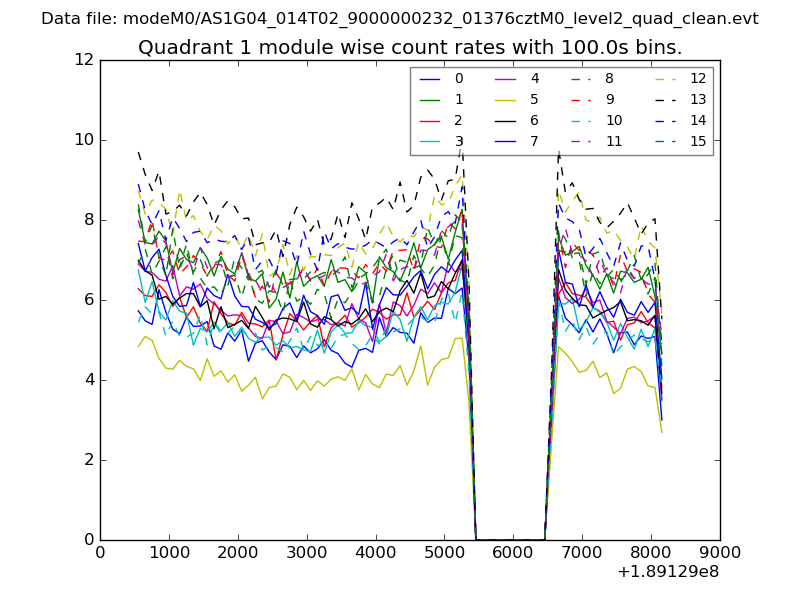
| Module-wise count rates for Quadrant A Data is divided into 100 sec bins |
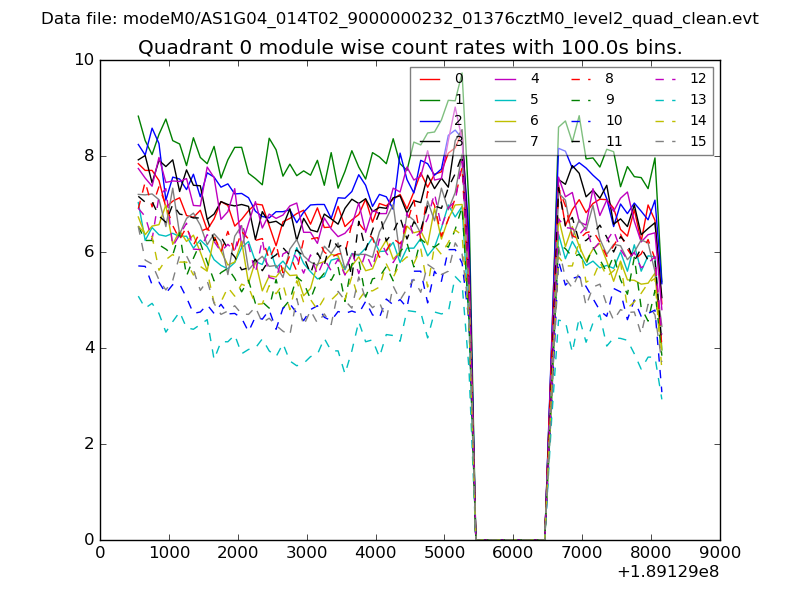 |
 |
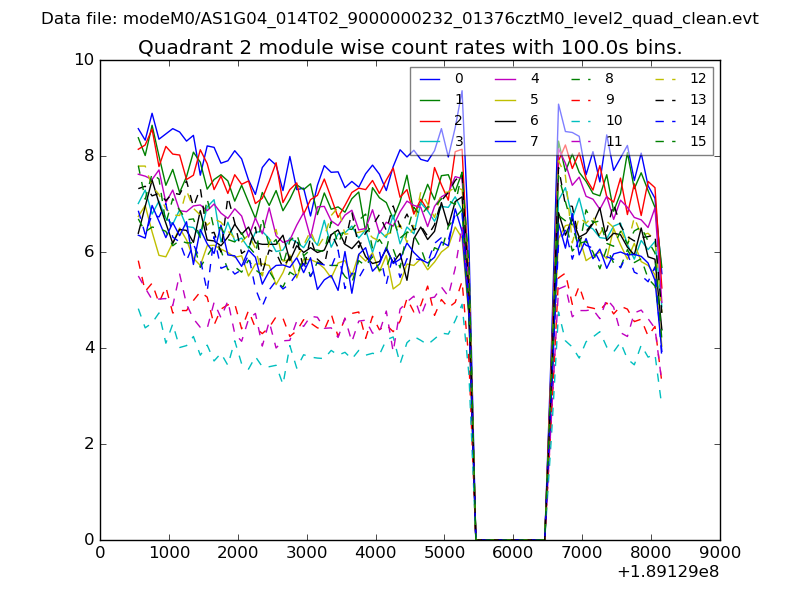
| Module-wise count rates for Quadrant B Data is divided into 100 sec bins |
 |
 |
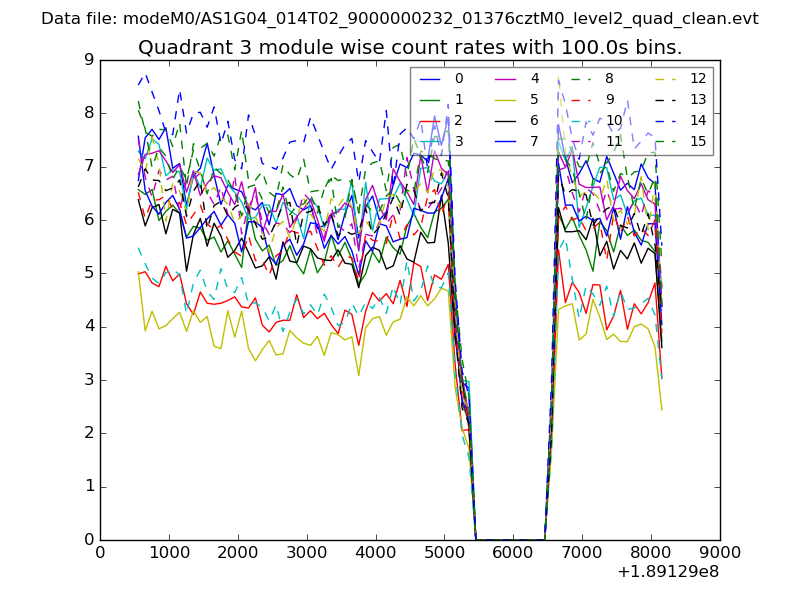
| Module-wise count rates for Quadrant C Data is divided into 100 sec bins |
 |
 |
| Module-wise count rates for Quadrant D Data is divided into 100 sec bins |
 |
 |
| Parameter | Plot |
|---|---|
| CZT HV Monitor | 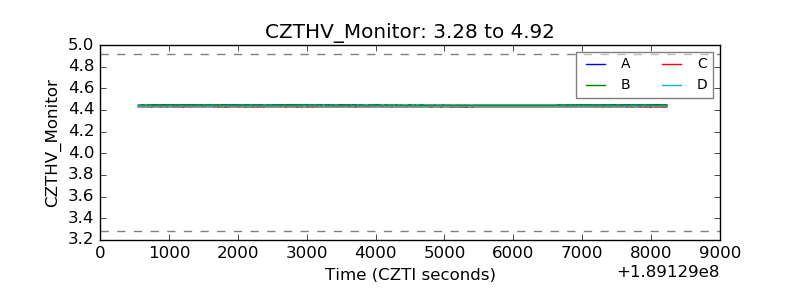 |
| D_VDD | 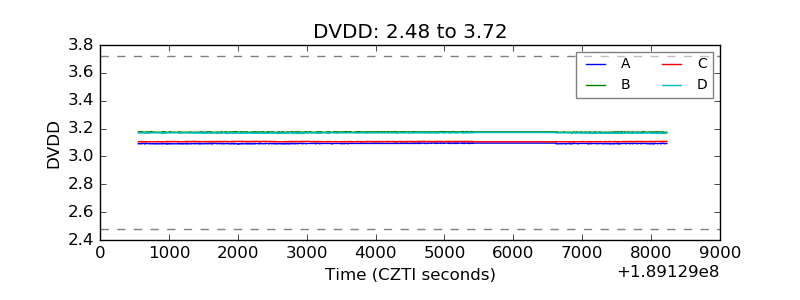 |
| Temperature 1 | 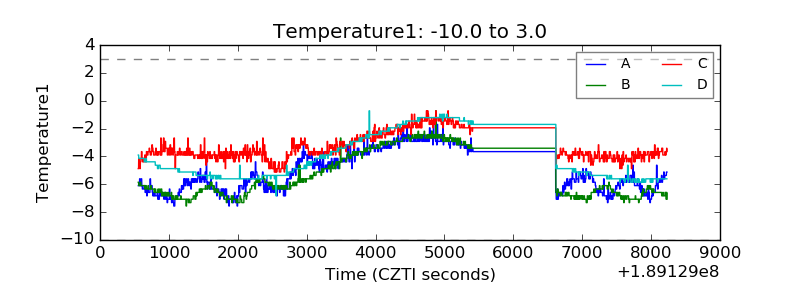 |
| Veto HV Monitor | 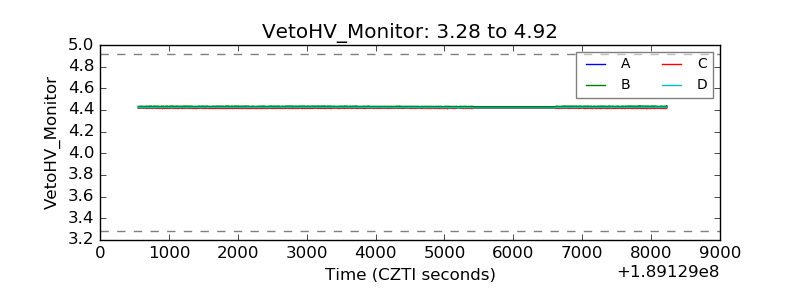 |
| Veto LLD | 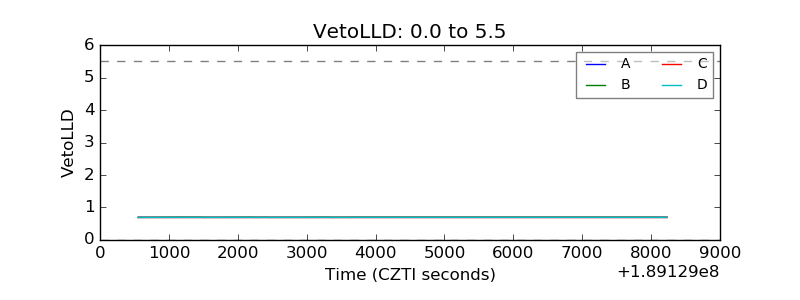 |
| Alpha Counter | 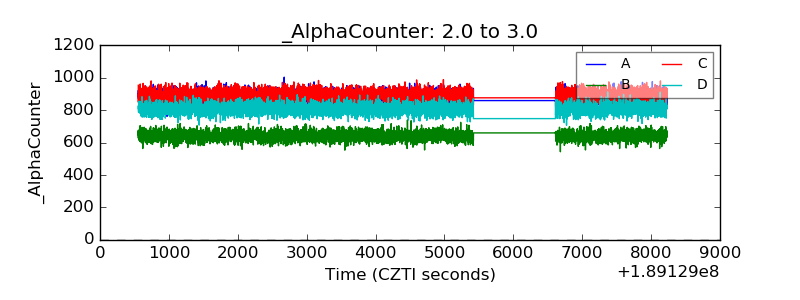 |
| _CPM_Rate | 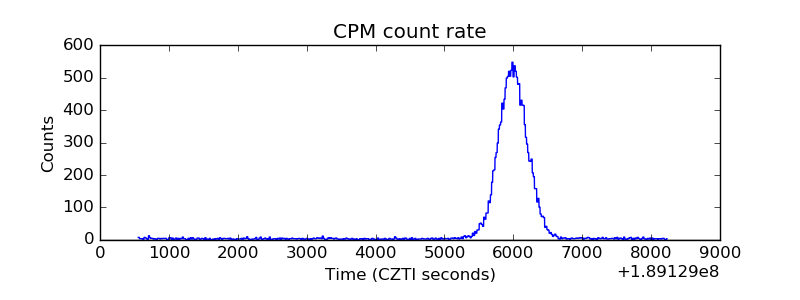 |
| CZT Counter | 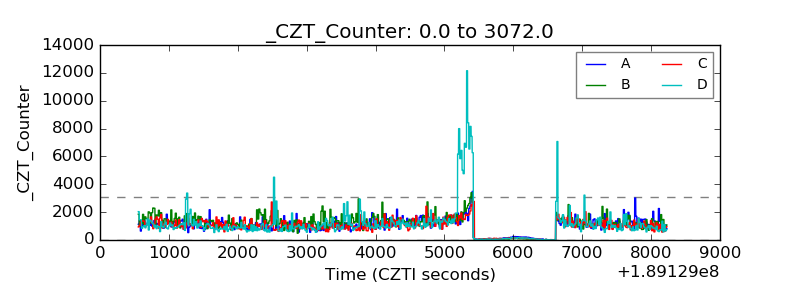 |
| +2.5 Volts monitor |  |
| +5 Volts monitor | 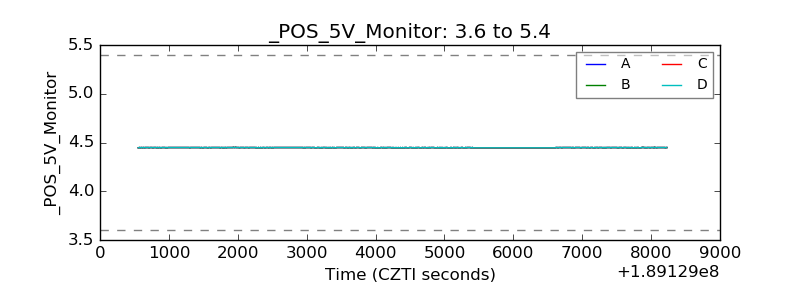 |
| _ROLL_ROT | 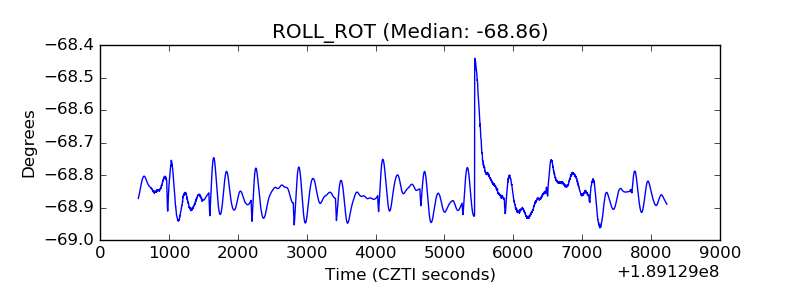 |
| _Roll_DEC | 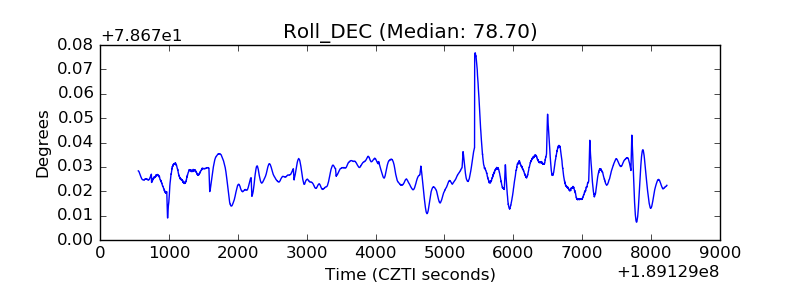 |
| _Roll_RA | 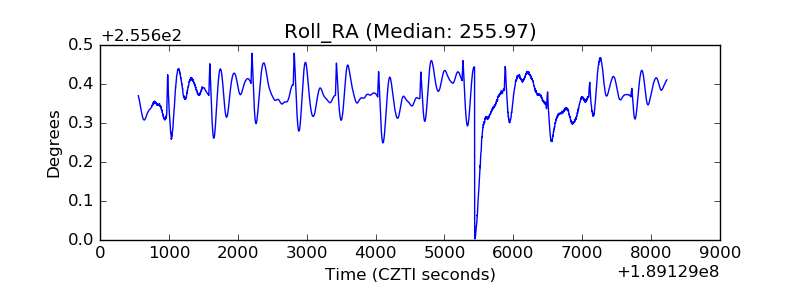 |
| Veto Counter | 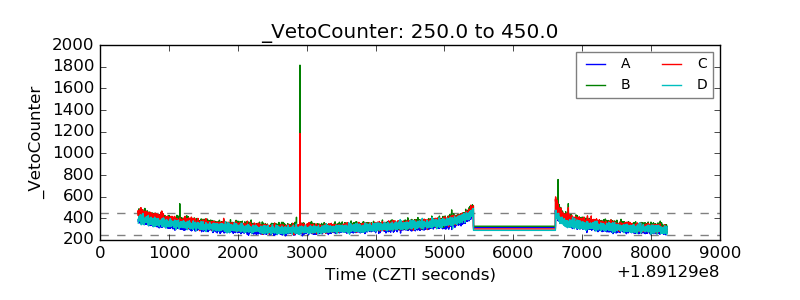 |