| Param | Original file | Final file |
|---|---|---|
| Filename | modeM0/AS1G04_014T02_9000000232_01379cztM0_level2.evt | modeM0/AS1G04_014T02_9000000232_01379cztM0_level2_quad_clean.evt |
| Size (bytes) | 1,340,061,120 | 102,761,280 |
| Size | 1.2 GB | 98.0 MB |
| Events in quadrant A | 10,908,163 | 662,227 |
| Events in quadrant B | 9,654,266 | 697,655 |
| Events in quadrant C | 8,558,596 | 680,907 |
| Events in quadrant D | 10,990,296 | 572,142 |
| Mode SS | |||
|---|---|---|---|
| Quadrant | BADHDUFLAG | Total packets | Discarded packets |
| A | 0 | 142 | 0 |
| B | 0 | 142 | 0 |
| C | 0 | 142 | 0 |
| D | 0 | 142 | 0 |
| Mode M0 | |||
|---|---|---|---|
| Quadrant | BADHDUFLAG | Total packets | Discarded packets |
| A | 0 | 37520 | 1 |
| B | 0 | 33744 | 0 |
| C | 0 | 30466 | 0 |
| D | 0 | 38025 | 0 |
| Quadrant | Total seconds | Saturated seconds | Saturation percentage |
|---|---|---|---|
| A | 7160 | 569 | 7.946927% |
| B | 7160 | 35 | 0.488827% |
| C | 7160 | 3 | 0.041899% |
| D | 7160 | 1448 | 20.223464% |
Noise dominated data is calculated using 1-second bins in cleaned event files. If a bin has >2000 counts, and if more than 50% of those come from <1% of pixels, then it is considered to be noise-dominated and hence unusable.
| Quadrant | # 1 sec bins | Bins with >0 counts | Bins with >2000 counts | High rate bins dominated by noise | Noise dominated (total time) | Noise dominated (detector-on time) | Marked lightcurve |
|---|---|---|---|---|---|---|---|
| A | 7160 | 7160 | 1302 | 1302 | 18.18% | 18.18% |  |
| B | 7160 | 7160 | 632 | 632 | 8.83% | 8.83% | 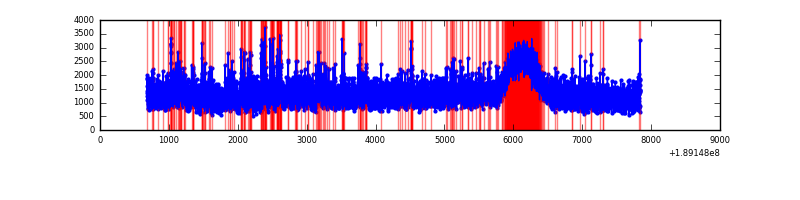 |
| C | 7160 | 7160 | 366 | 366 | 5.11% | 5.11% | 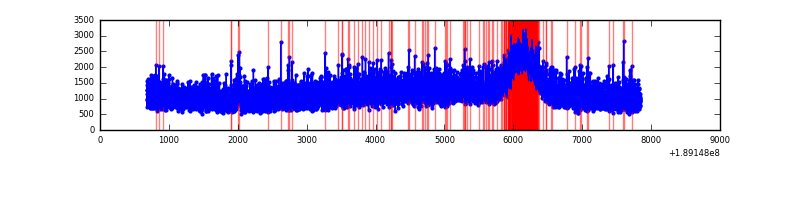 |
| D | 7160 | 7160 | 1927 | 1927 | 26.91% | 26.91% | 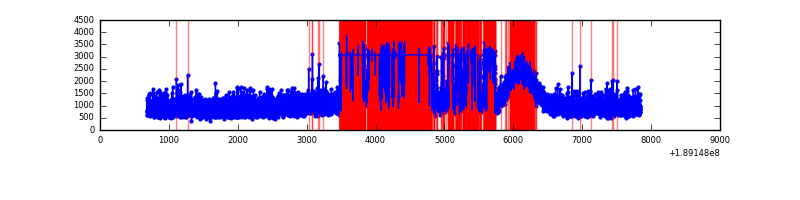 |
Top three noisy pixels from each quadrant. If the there are fewer than three noisy pixels in the level2.evt file, extra rows are filled as -1
| Pixel properties | Quadrant properties | ||||||
|---|---|---|---|---|---|---|---|
| Quadrant | DetID | PixID | Counts | Sigma | Mean | Median | Sigma |
| A | 15 | 127 | 2114271 | 3931.76 | 2214 | 2228 | 537.2 |
| A | 4 | 32 | 147835 | 271.06 | 2214 | 2228 | 537.2 |
| A | 15 | 233 | 141375 | 259.03 | 2214 | 2228 | 537.2 |
| B | 8 | 4 | 346535 | 607.86 | 2361 | 2379 | 566.2 |
| B | 12 | 52 | 114229 | 197.55 | 2361 | 2379 | 566.2 |
| B | 6 | 53 | 99992 | 172.41 | 2361 | 2379 | 566.2 |
| C | 15 | 241 | 245422 | 412.71 | 2105 | 2176 | 589.4 |
| C | 3 | 79 | 28203 | 44.16 | 2105 | 2176 | 589.4 |
| C | 12 | 4 | 27696 | 43.3 | 2105 | 2176 | 589.4 |
| D | 13 | 73 | 4130405 | 7218.58 | 1821 | 1888 | 571.9 |
| D | 9 | 53 | 44389 | 74.31 | 1821 | 1888 | 571.9 |
| D | 2 | 170 | 12707 | 18.92 | 1821 | 1888 | 571.9 |
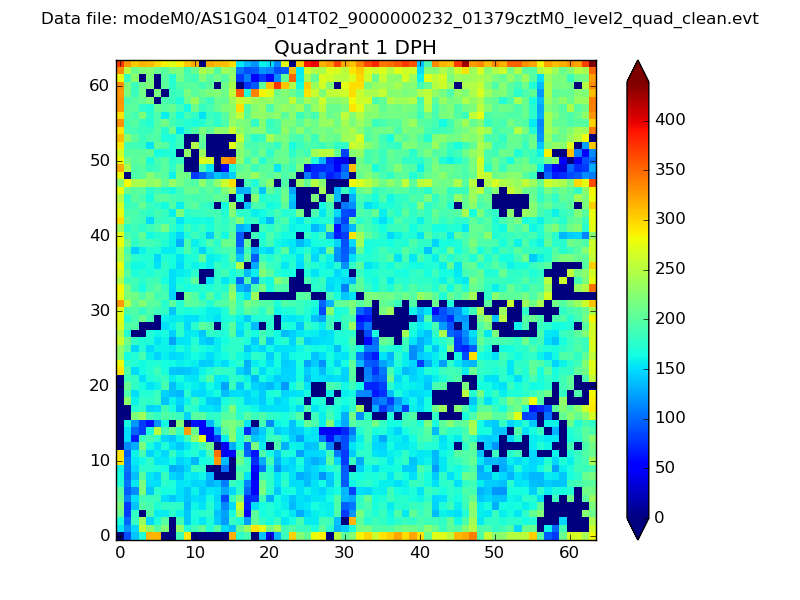
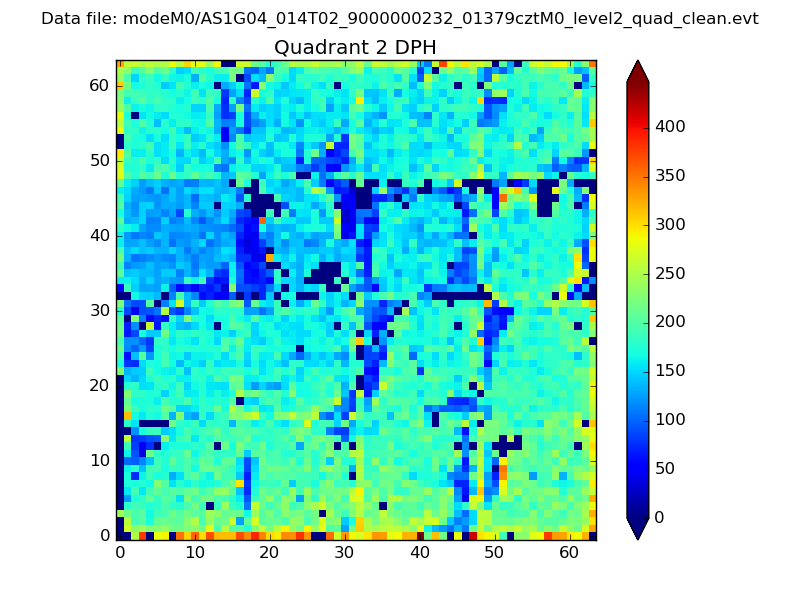
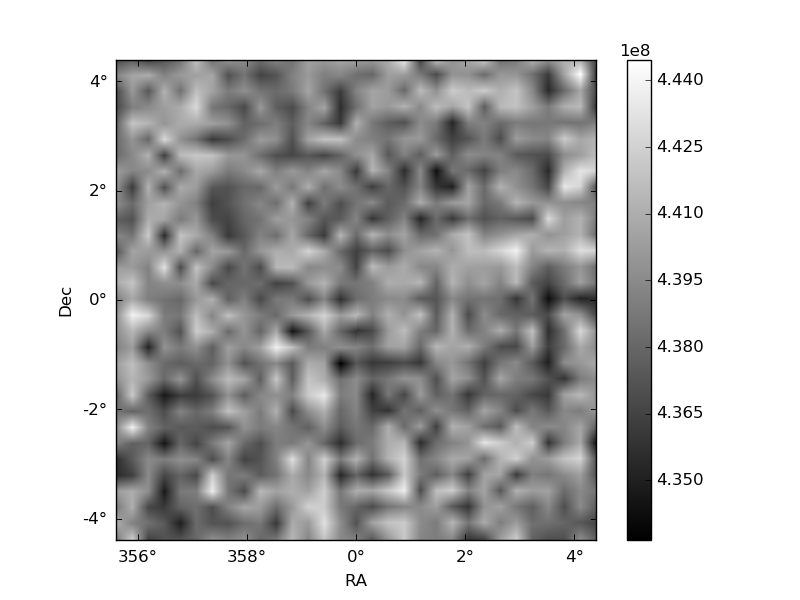
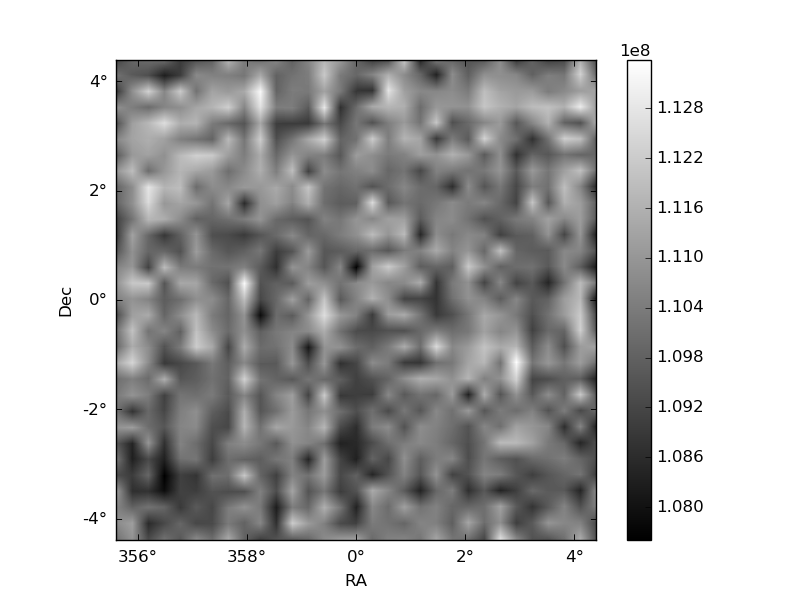
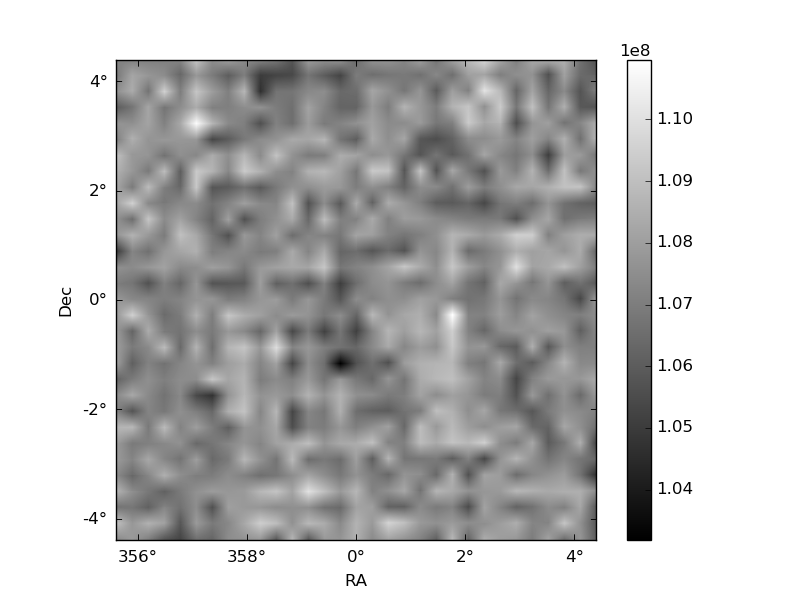
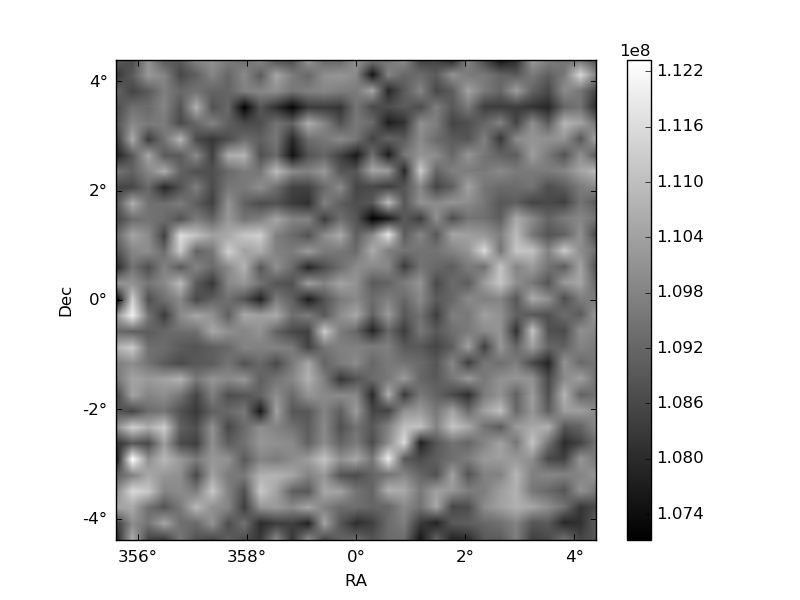
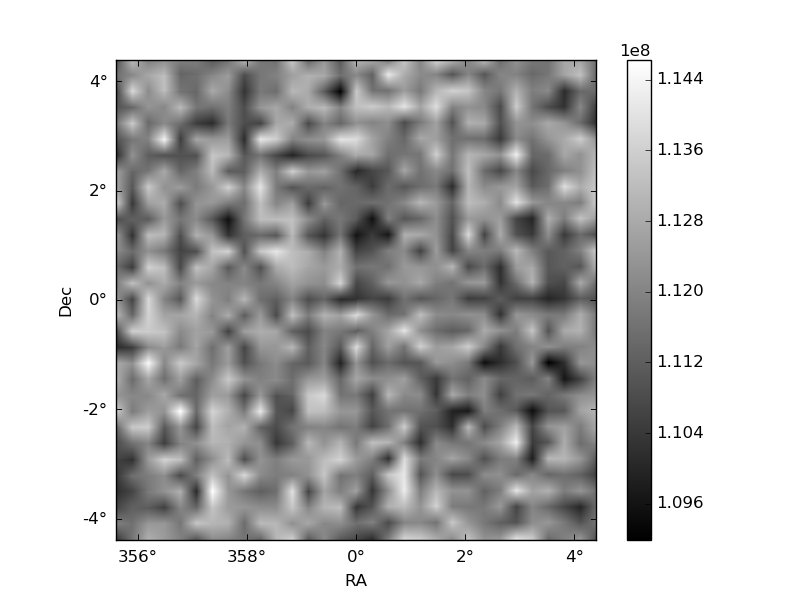
Histogram calculated using DETX and DETY for each event in the final _common_clean file
| Quadrant A | 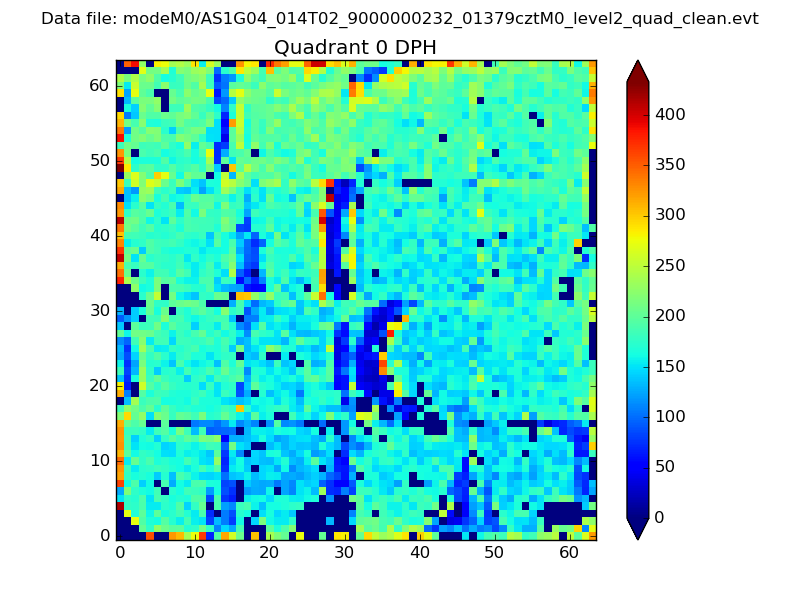 |
 |
Quadrant B |
|---|---|---|---|
| Quadrant D | 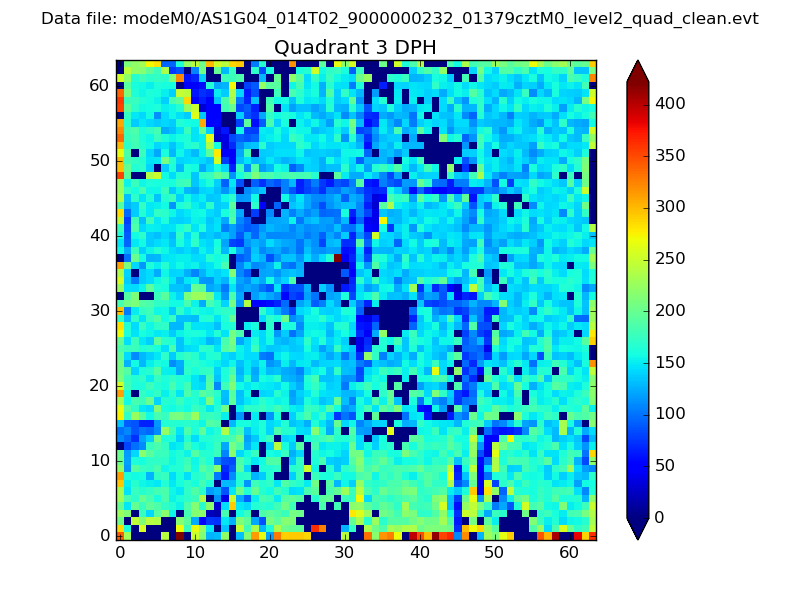 |
 |
Quadrant C |
| Plot type | Count rate plots | Images |
|---|---|---|
| Comparison with Poisson distribution Blue bars denote a histogram of data divided into 1 sec bins. Red curve is a Poisson curve with rate = median count rate of data. |
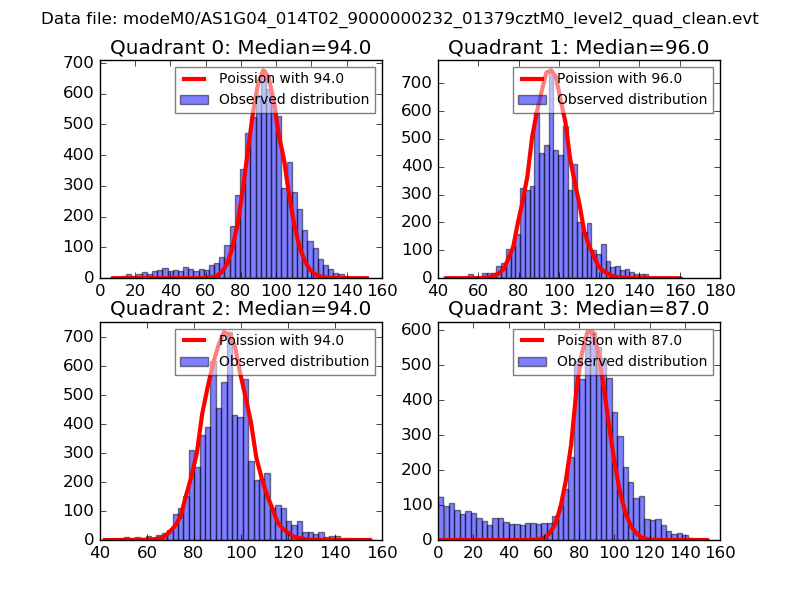 |
 |
| Quadrant-wise count rates Data is divided into 100 sec bins |
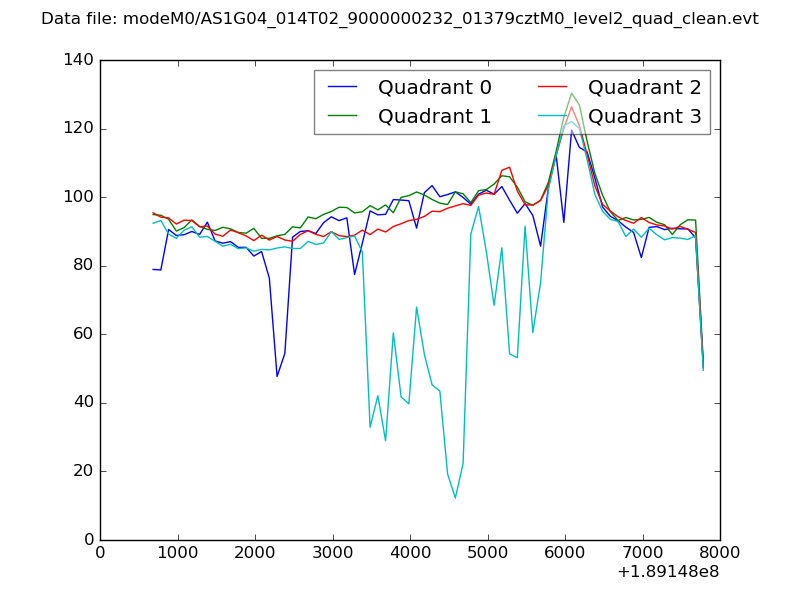 |
|
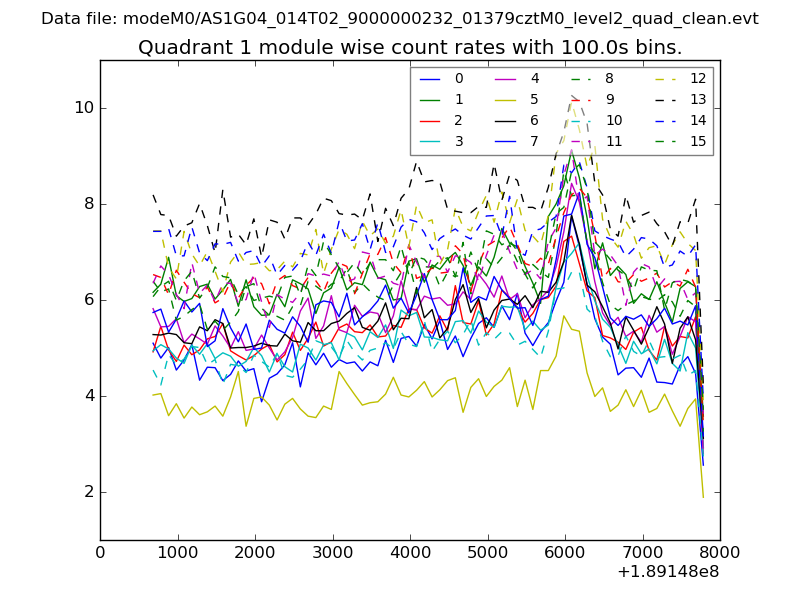
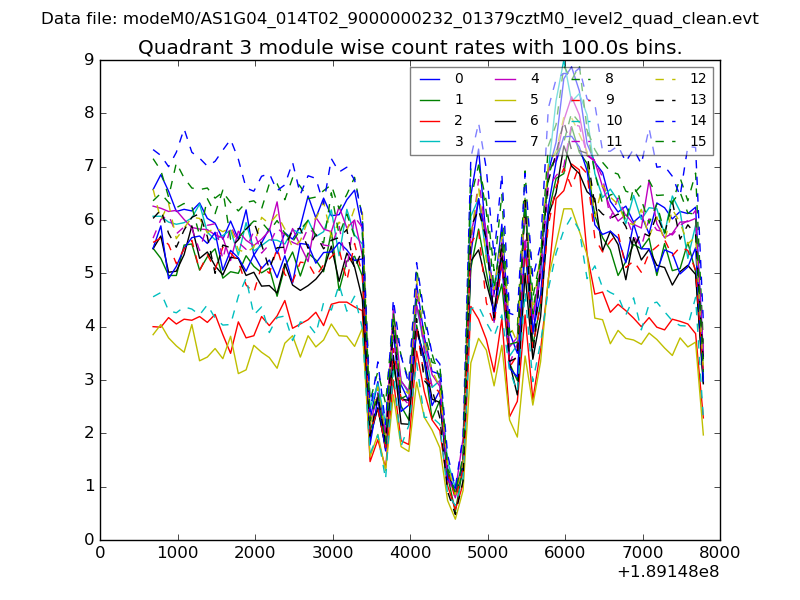
| Module-wise count rates for Quadrant A Data is divided into 100 sec bins |
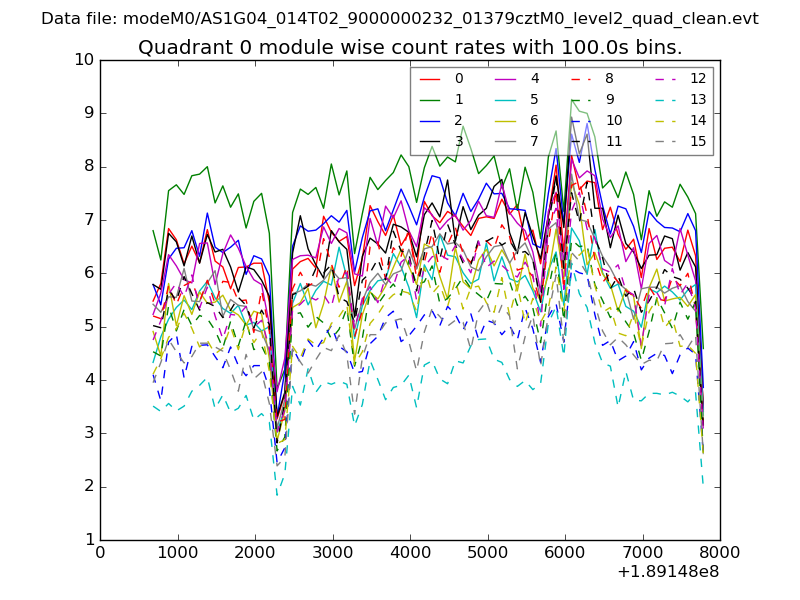 |
 |
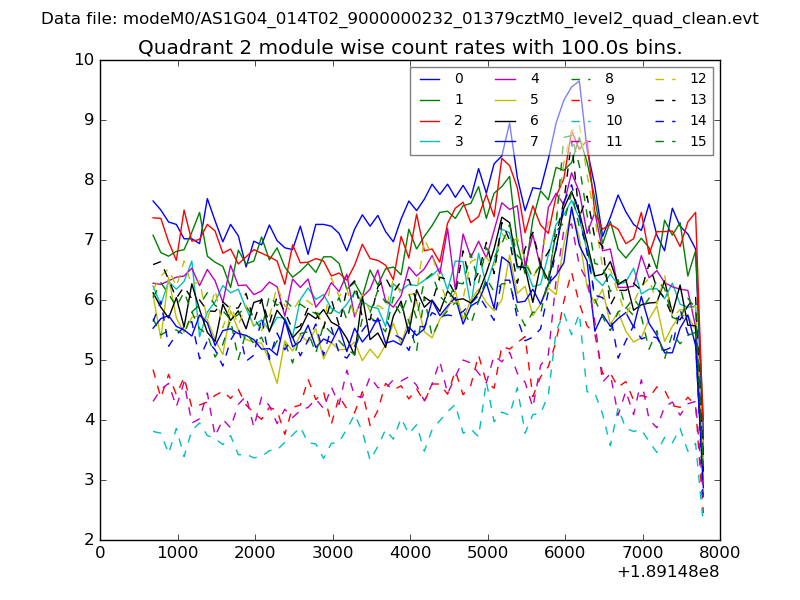
| Module-wise count rates for Quadrant B Data is divided into 100 sec bins |
 |
 |
| Module-wise count rates for Quadrant C Data is divided into 100 sec bins |
 |
 |
| Module-wise count rates for Quadrant D Data is divided into 100 sec bins |
 |
 |
| Parameter | Plot |
|---|---|
| CZT HV Monitor | 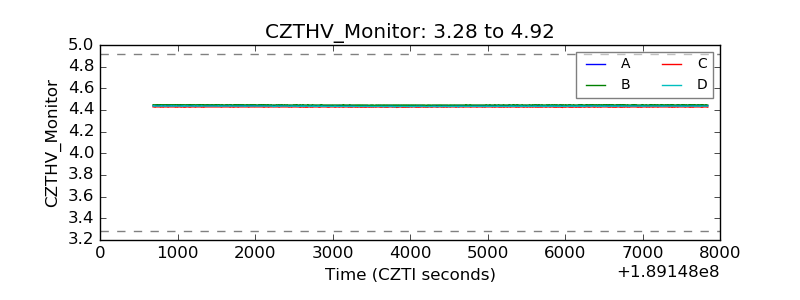 |
| D_VDD | 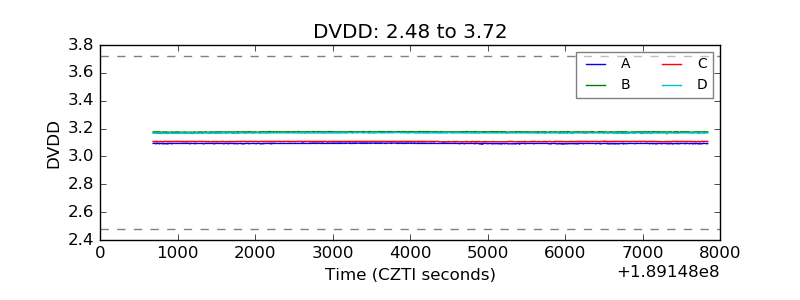 |
| Temperature 1 | 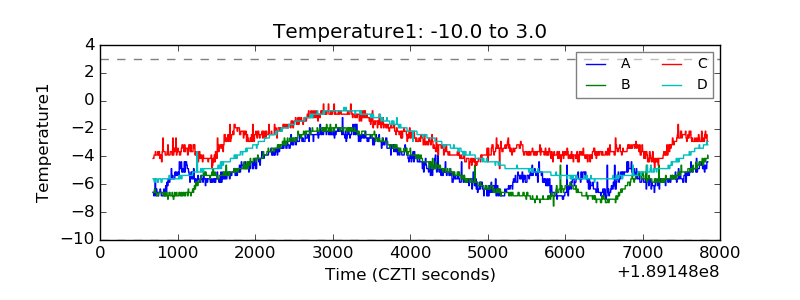 |
| Veto HV Monitor | 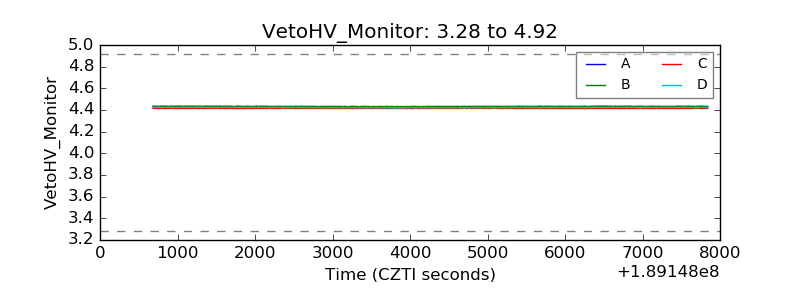 |
| Veto LLD | 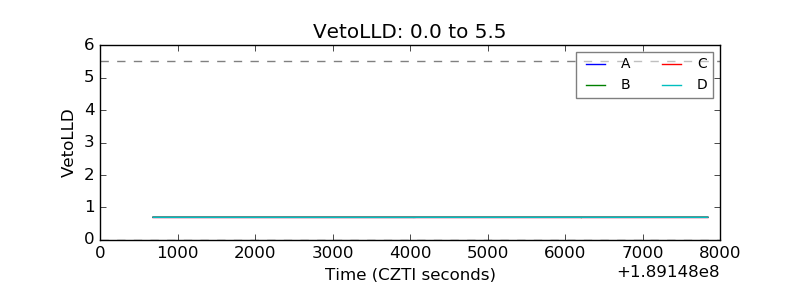 |
| Alpha Counter | 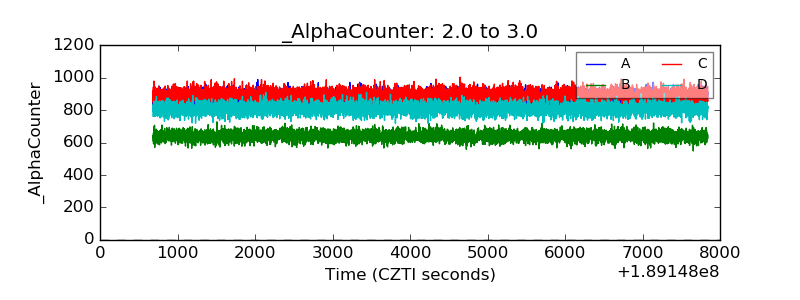 |
| _CPM_Rate | 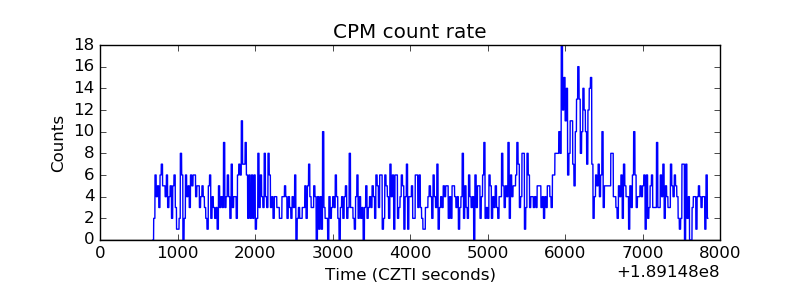 |
| CZT Counter | 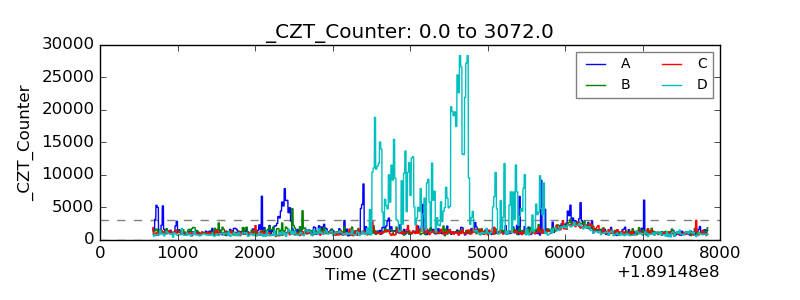 |
| +2.5 Volts monitor | 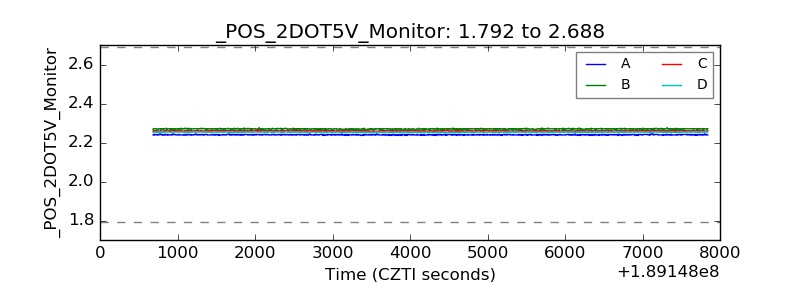 |
| +5 Volts monitor | 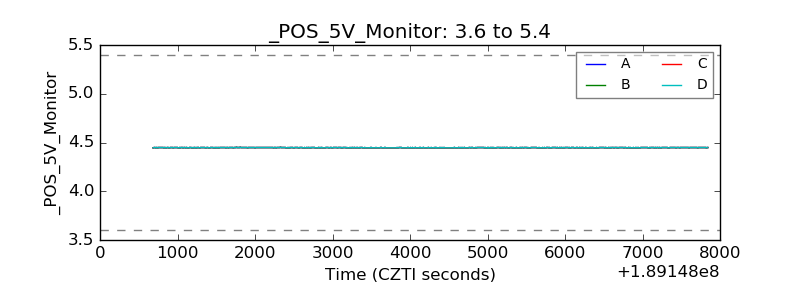 |
| _ROLL_ROT | 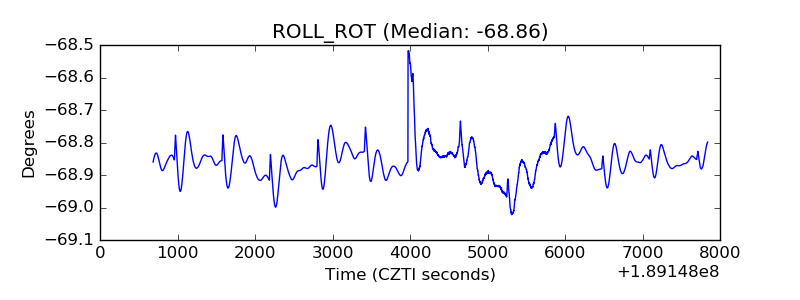 |
| _Roll_DEC | 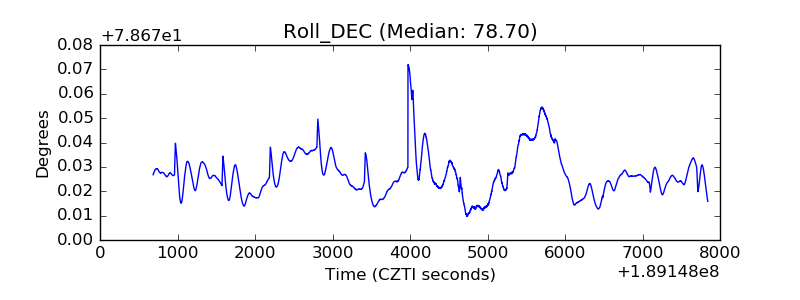 |
| _Roll_RA | 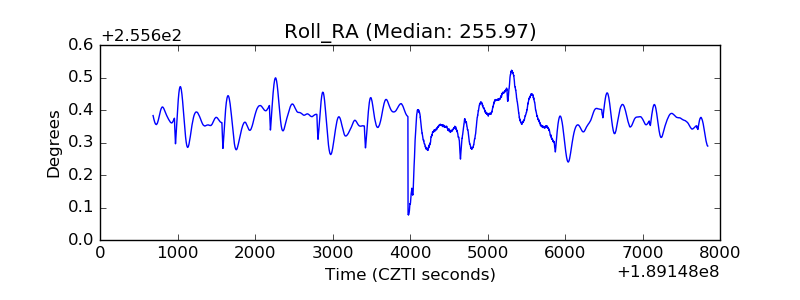 |
| Veto Counter | 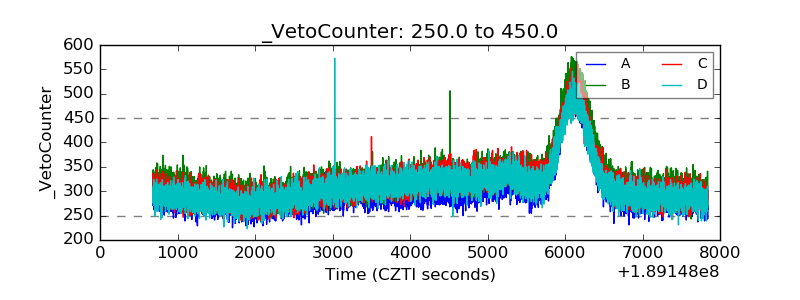 |