| Param | Original file | Final file |
|---|---|---|
| Filename | modeM0/AS1G04_014T02_9000000232_01380cztM0_level2.evt | modeM0/AS1G04_014T02_9000000232_01380cztM0_level2_quad_clean.evt |
| Size (bytes) | 1,334,134,080 | 110,232,000 |
| Size | 1.2 GB | 105.1 MB |
| Events in quadrant A | 11,151,975 | 699,961 |
| Events in quadrant B | 10,449,727 | 728,864 |
| Events in quadrant C | 9,000,466 | 710,606 |
| Events in quadrant D | 9,304,875 | 674,844 |
| Mode SS | |||
|---|---|---|---|
| Quadrant | BADHDUFLAG | Total packets | Discarded packets |
| A | 0 | 150 | 0 |
| B | 0 | 150 | 0 |
| C | 0 | 150 | 0 |
| D | 0 | 150 | 0 |
| Mode M0 | |||
|---|---|---|---|
| Quadrant | BADHDUFLAG | Total packets | Discarded packets |
| A | 0 | 38492 | 1 |
| B | 0 | 36382 | 0 |
| C | 0 | 32079 | 0 |
| D | 0 | 33093 | 0 |
| Quadrant | Total seconds | Saturated seconds | Saturation percentage |
|---|---|---|---|
| A | 7532 | 468 | 6.213489% |
| B | 7532 | 92 | 1.221455% |
| C | 7532 | 13 | 0.172597% |
| D | 7532 | 381 | 5.058417% |
Noise dominated data is calculated using 1-second bins in cleaned event files. If a bin has >2000 counts, and if more than 50% of those come from <1% of pixels, then it is considered to be noise-dominated and hence unusable.
| Quadrant | # 1 sec bins | Bins with >0 counts | Bins with >2000 counts | High rate bins dominated by noise | Noise dominated (total time) | Noise dominated (detector-on time) | Marked lightcurve |
|---|---|---|---|---|---|---|---|
| A | 7532 | 7532 | 1191 | 1191 | 15.81% | 15.81% | 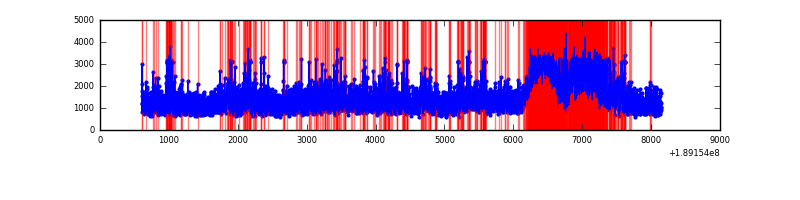 |
| B | 7532 | 7532 | 773 | 773 | 10.26% | 10.26% | 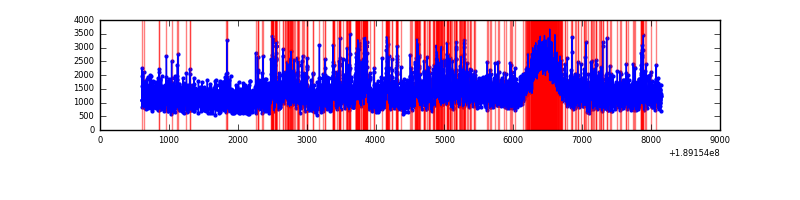 |
| C | 7532 | 7532 | 377 | 377 | 5.01% | 5.01% | 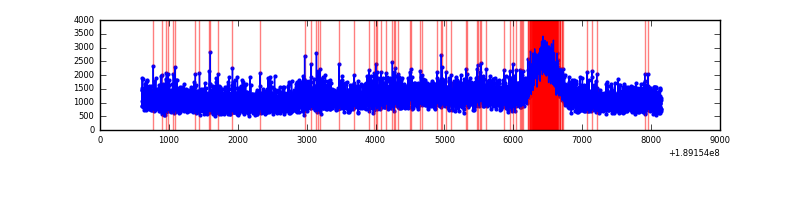 |
| D | 7532 | 7532 | 802 | 802 | 10.65% | 10.65% | 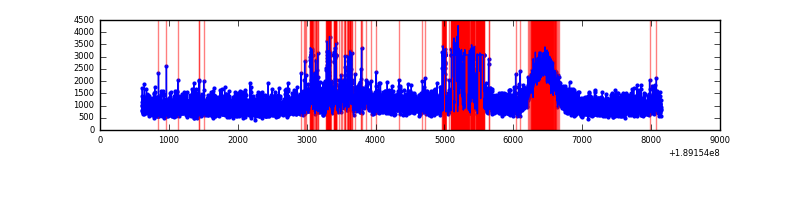 |
Top three noisy pixels from each quadrant. If the there are fewer than three noisy pixels in the level2.evt file, extra rows are filled as -1
| Pixel properties | Quadrant properties | ||||||
|---|---|---|---|---|---|---|---|
| Quadrant | DetID | PixID | Counts | Sigma | Mean | Median | Sigma |
| A | 15 | 127 | 2088665 | 3650.91 | 2358 | 2372 | 571.4 |
| A | 11 | 79 | 9297 | 12.12 | 2358 | 2372 | 571.4 |
| A | 13 | 9 | 8455 | 10.64 | 2358 | 2372 | 571.4 |
| B | 8 | 4 | 792054 | 1335.68 | 2475 | 2494 | 591.1 |
| B | 12 | 52 | 100649 | 166.05 | 2475 | 2494 | 591.1 |
| B | 5 | 249 | 54332 | 87.69 | 2475 | 2494 | 591.1 |
| C | 15 | 241 | 269387 | 429.87 | 2217 | 2286 | 621.4 |
| C | 3 | 79 | 34937 | 52.55 | 2217 | 2286 | 621.4 |
| C | 3 | 111 | 29723 | 44.16 | 2217 | 2286 | 621.4 |
| D | 13 | 73 | 1163556 | 1742.68 | 2119 | 2192 | 666.4 |
| D | 9 | 53 | 185392 | 274.9 | 2119 | 2192 | 666.4 |
| D | 5 | 234 | 16735 | 21.82 | 2119 | 2192 | 666.4 |
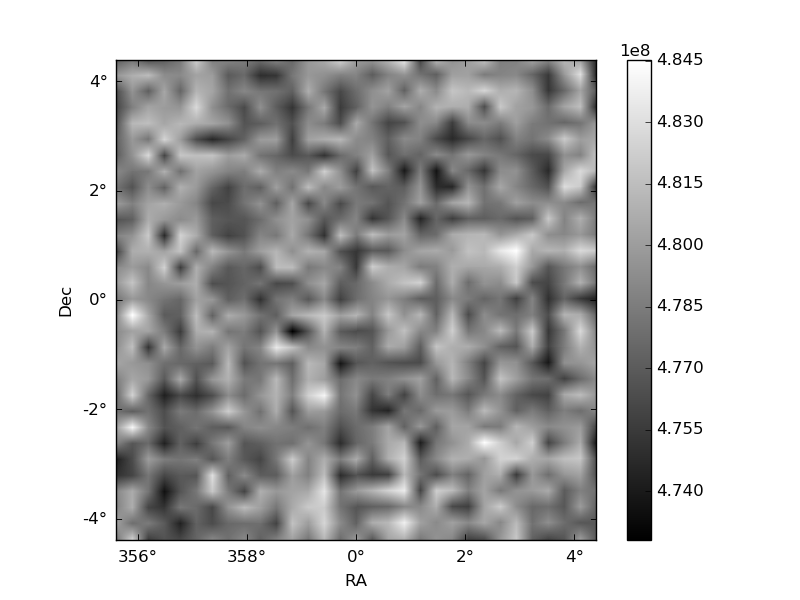
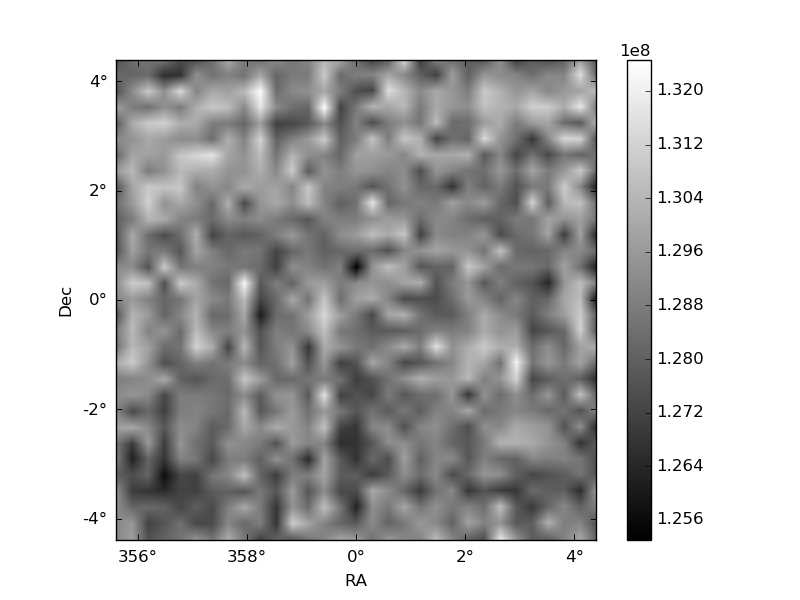
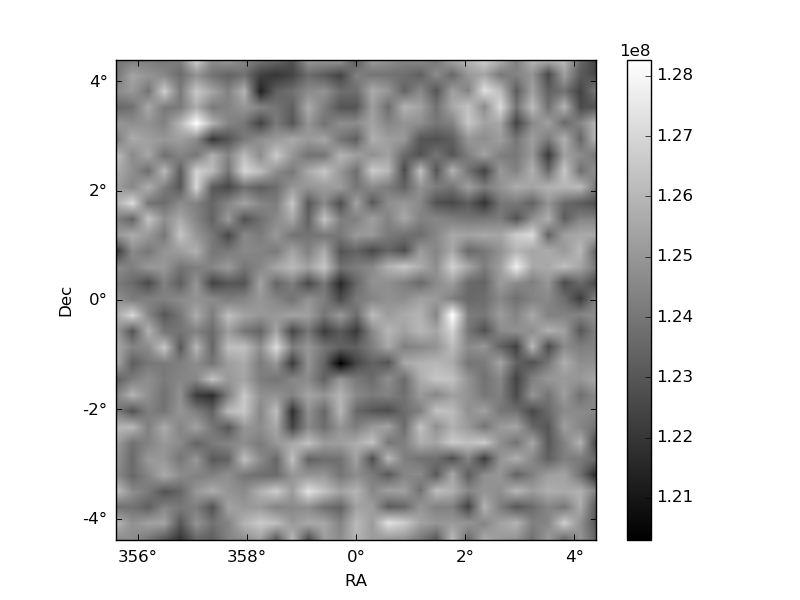
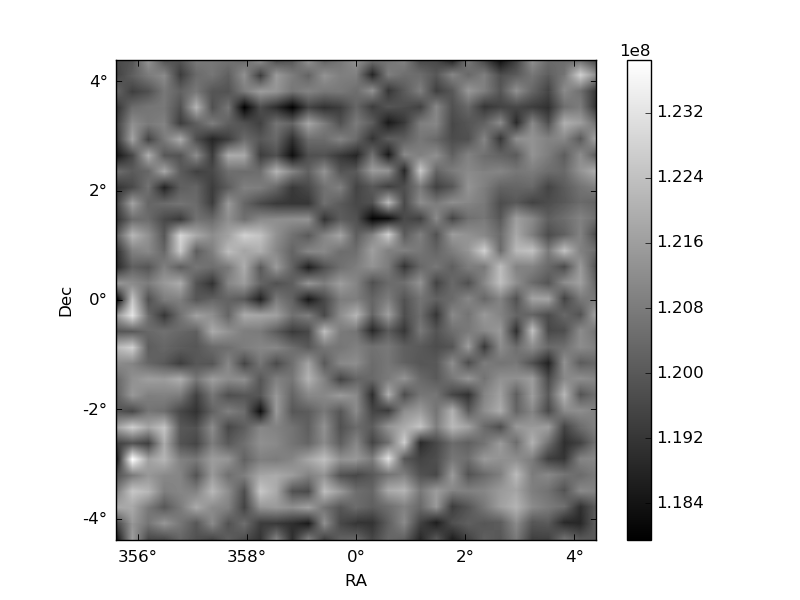
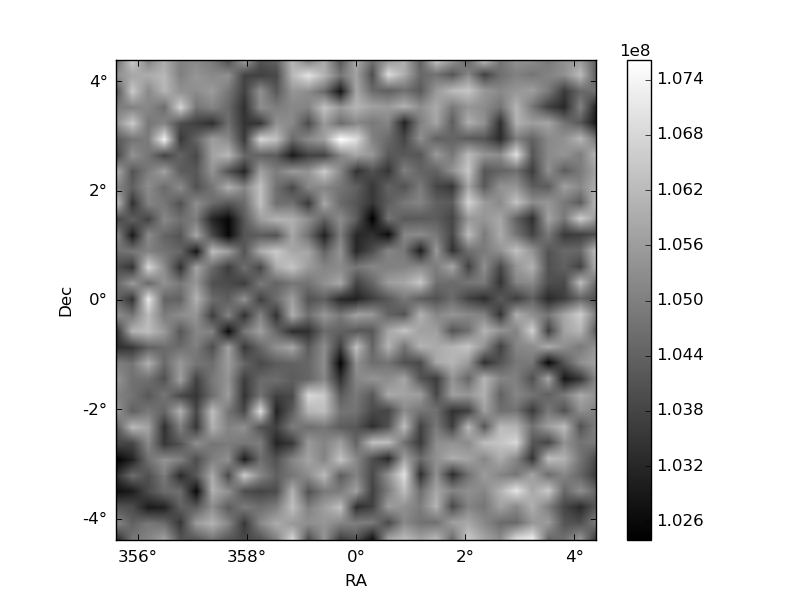
Histogram calculated using DETX and DETY for each event in the final _common_clean file
| Quadrant A | 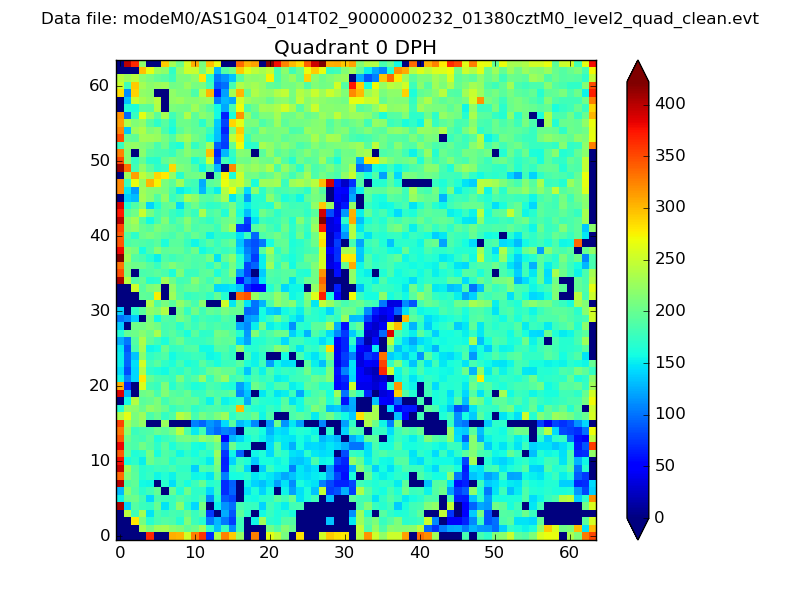 |
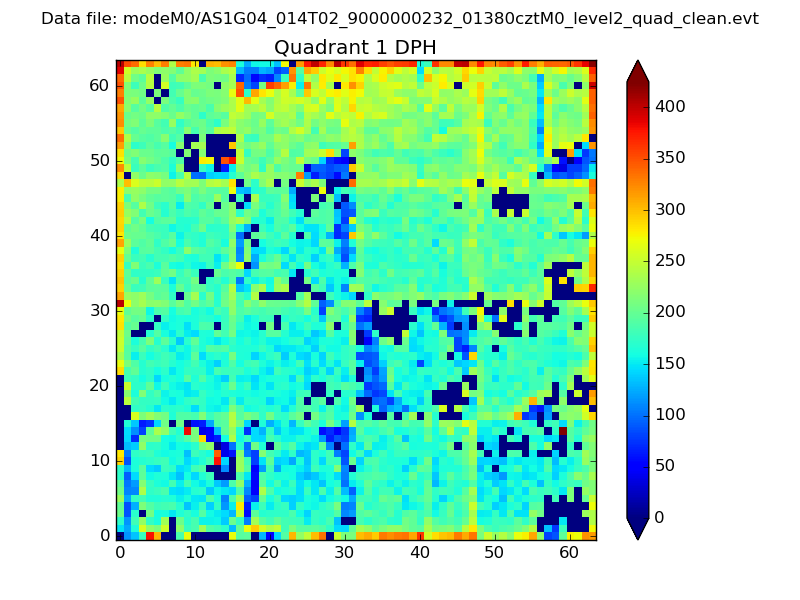 |
Quadrant B |
|---|---|---|---|
| Quadrant D | 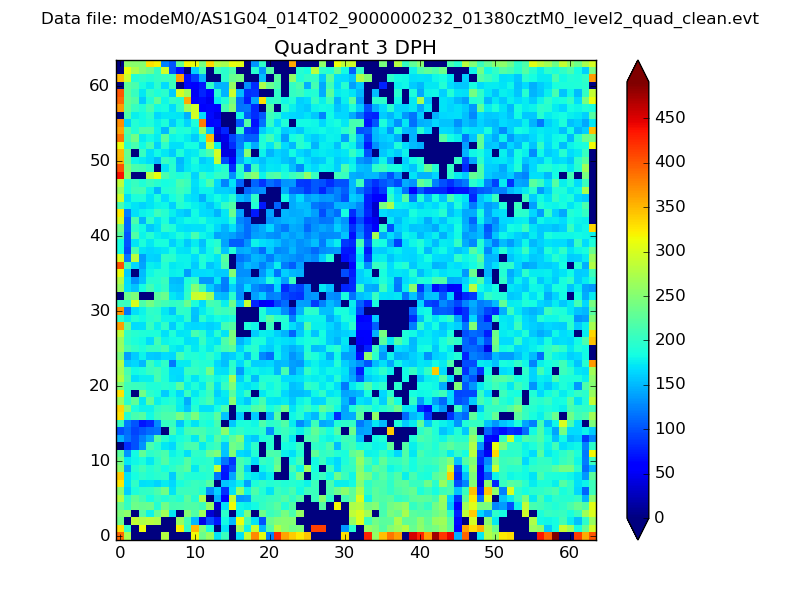 |
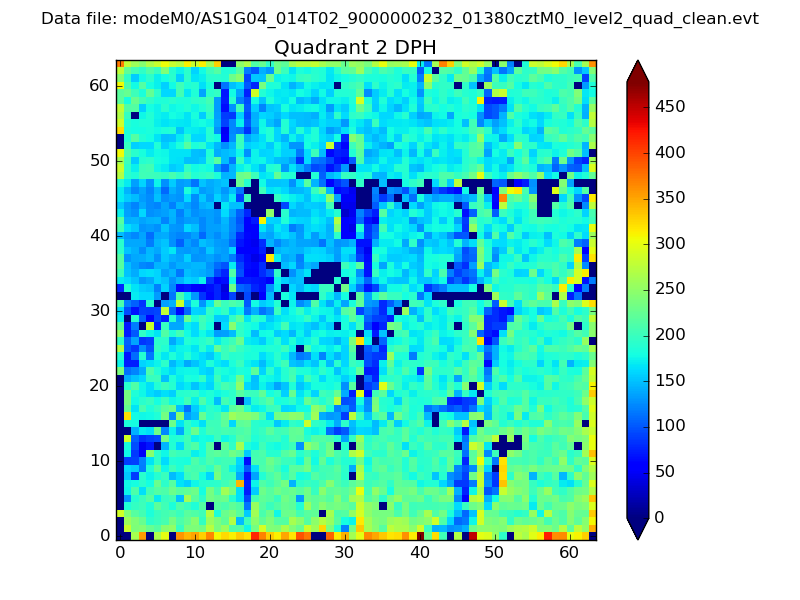 |
Quadrant C |
| Plot type | Count rate plots | Images |
|---|---|---|
| Comparison with Poisson distribution Blue bars denote a histogram of data divided into 1 sec bins. Red curve is a Poisson curve with rate = median count rate of data. |
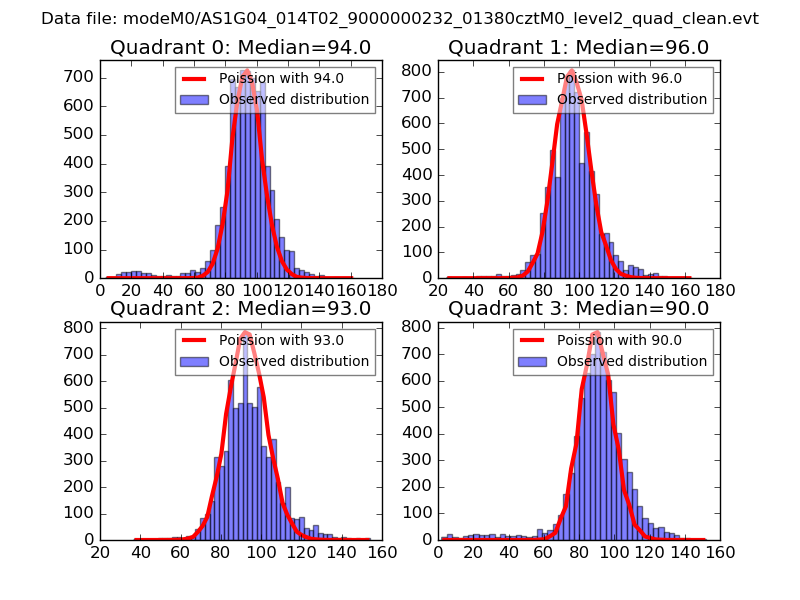 |
 |
| Quadrant-wise count rates Data is divided into 100 sec bins |
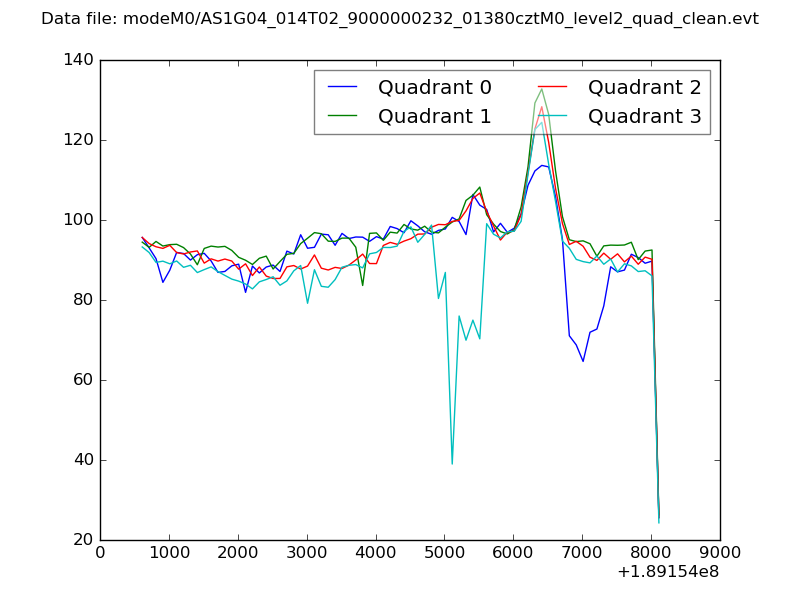 |
|
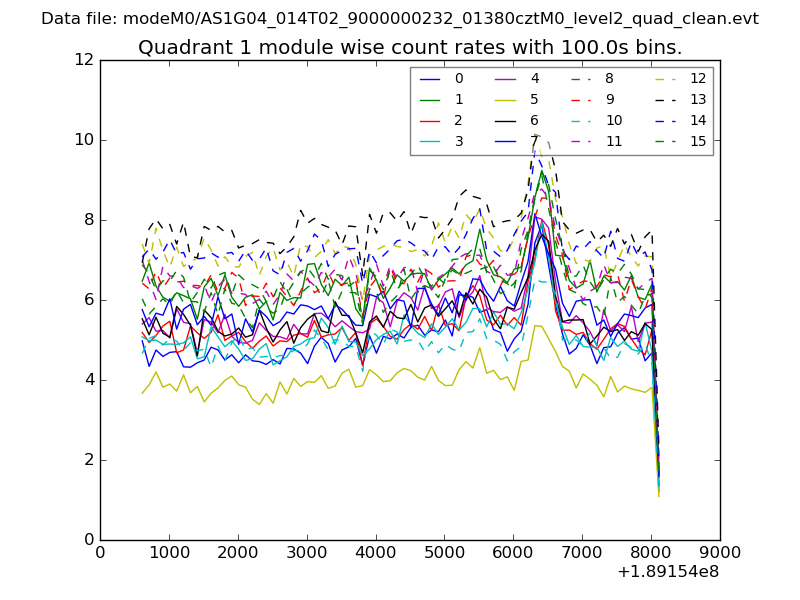
| Module-wise count rates for Quadrant A Data is divided into 100 sec bins |
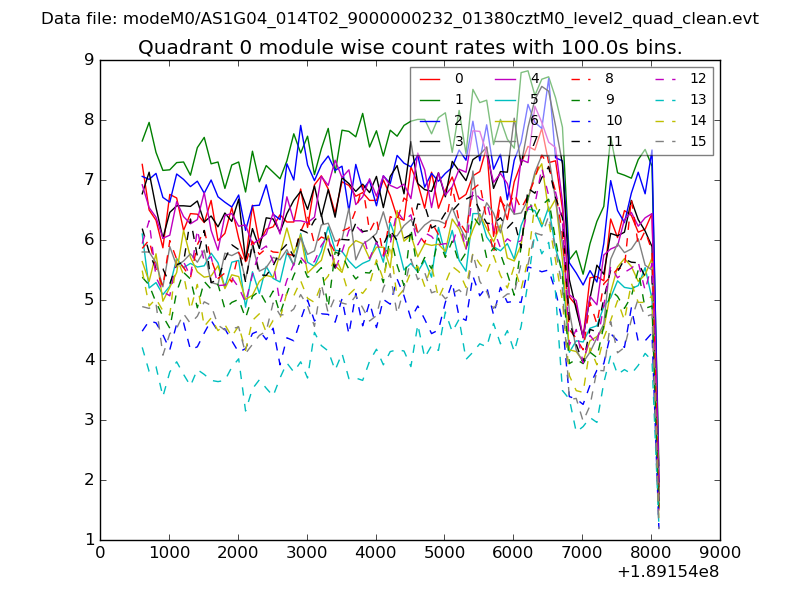 |
 |
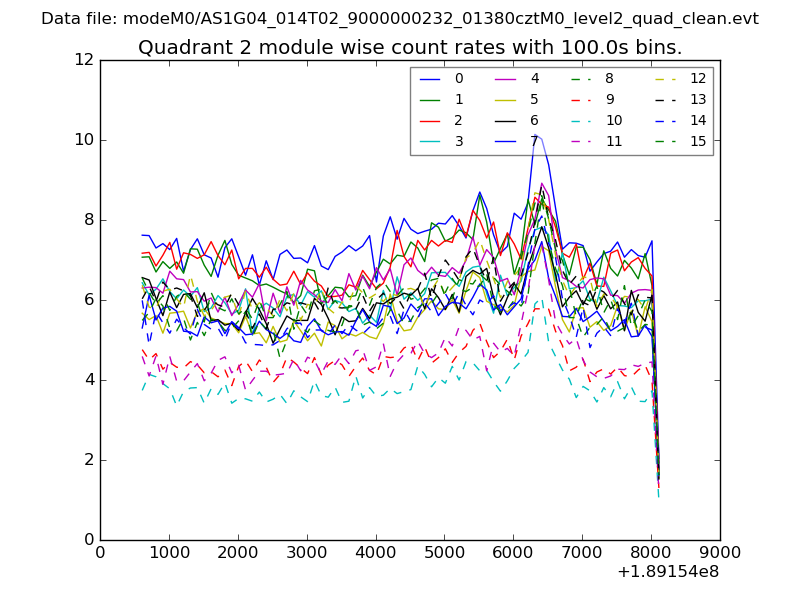
| Module-wise count rates for Quadrant B Data is divided into 100 sec bins |
 |
 |
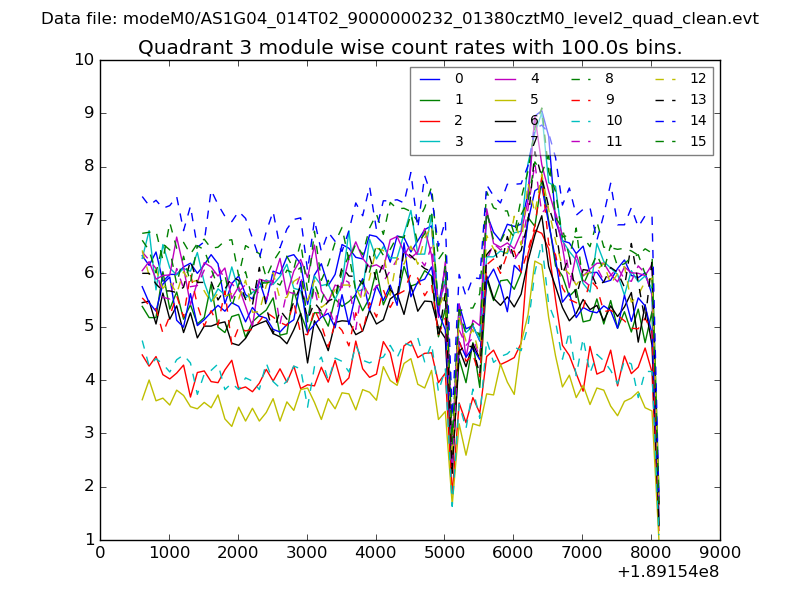
| Module-wise count rates for Quadrant C Data is divided into 100 sec bins |
 |
 |
| Module-wise count rates for Quadrant D Data is divided into 100 sec bins |
 |
 |
| Parameter | Plot |
|---|---|
| CZT HV Monitor | 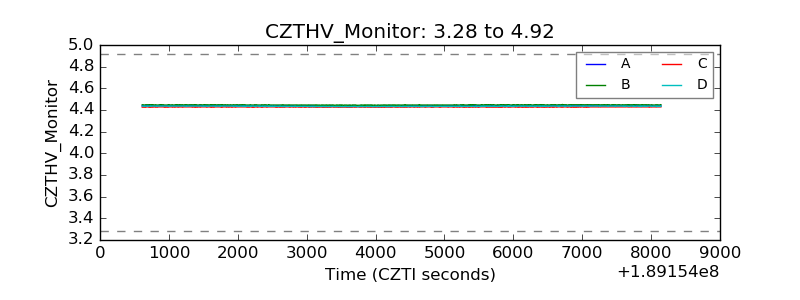 |
| D_VDD | 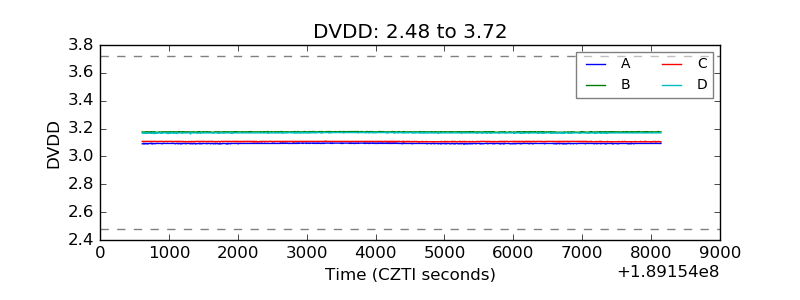 |
| Temperature 1 | 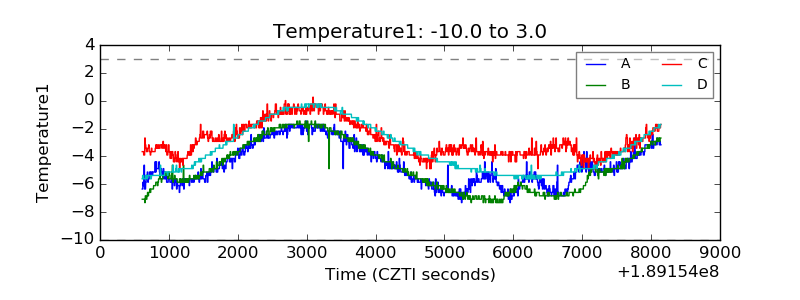 |
| Veto HV Monitor | 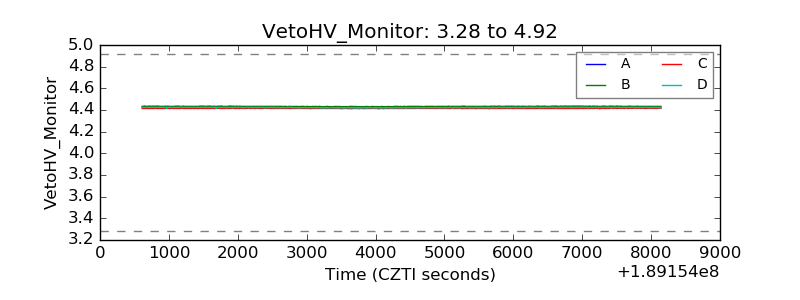 |
| Veto LLD | 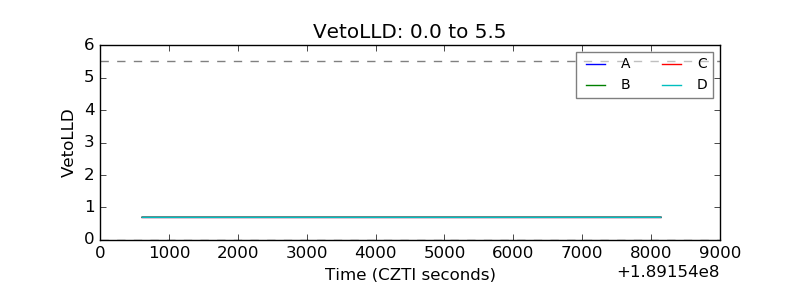 |
| Alpha Counter | 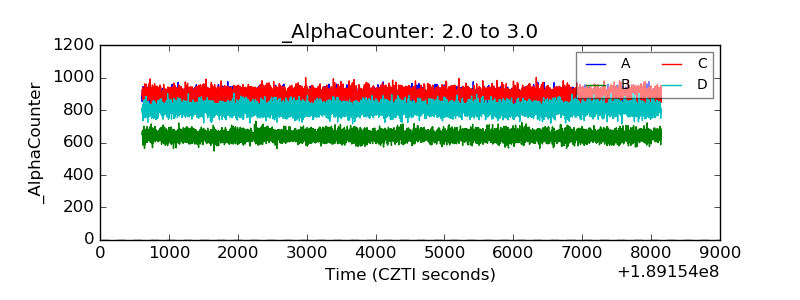 |
| _CPM_Rate | 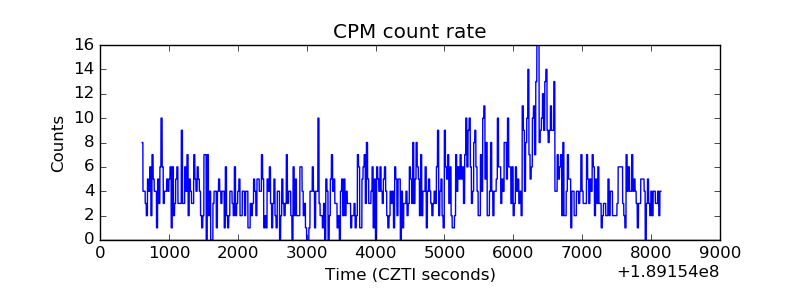 |
| CZT Counter | 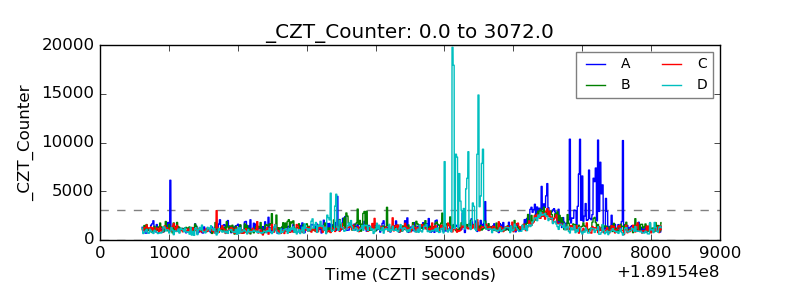 |
| +2.5 Volts monitor |  |
| +5 Volts monitor |  |
| _ROLL_ROT | 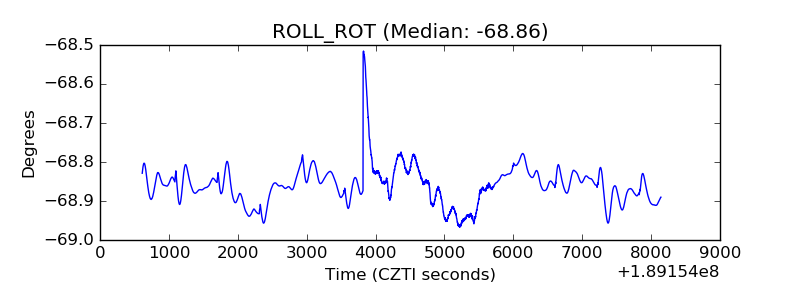 |
| _Roll_DEC | 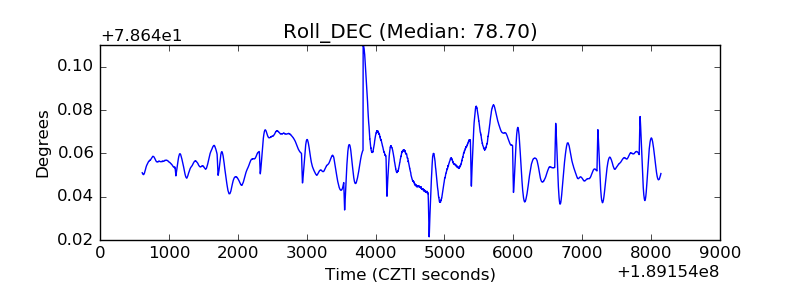 |
| _Roll_RA | 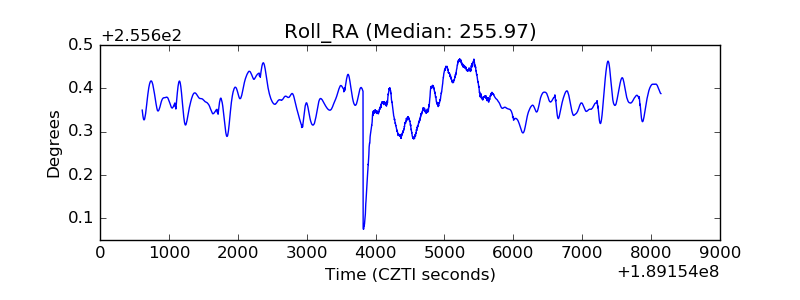 |
| Veto Counter | 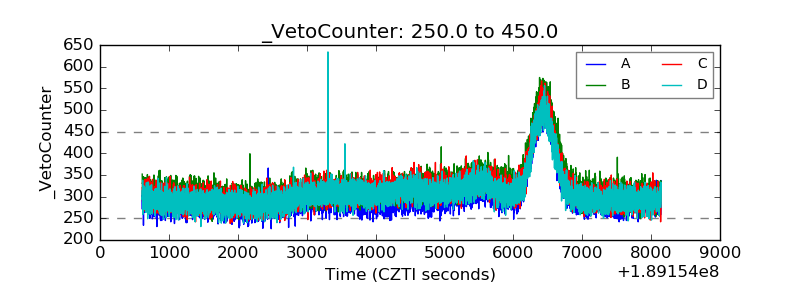 |