| Param | Original file | Final file |
|---|---|---|
| Filename | modeM0/AS1G04_014T02_9000000232_01381cztM0_level2.evt | modeM0/AS1G04_014T02_9000000232_01381cztM0_level2_quad_clean.evt |
| Size (bytes) | 1,214,170,560 | 99,544,320 |
| Size | 1.1 GB | 94.9 MB |
| Events in quadrant A | 9,447,005 | 643,127 |
| Events in quadrant B | 10,304,098 | 653,524 |
| Events in quadrant C | 8,113,395 | 640,860 |
| Events in quadrant D | 8,453,458 | 598,628 |
| Mode SS | |||
|---|---|---|---|
| Quadrant | BADHDUFLAG | Total packets | Discarded packets |
| A | 0 | 140 | 0 |
| B | 0 | 140 | 0 |
| C | 0 | 140 | 0 |
| D | 0 | 140 | 0 |
| Mode M0 | |||
|---|---|---|---|
| Quadrant | BADHDUFLAG | Total packets | Discarded packets |
| A | 0 | 32979 | 2 |
| B | 0 | 35480 | 1 |
| C | 0 | 28928 | 1 |
| D | 0 | 30049 | 1 |
| Mode M9 | |||
|---|---|---|---|
| Quadrant | BADHDUFLAG | Total packets | Discarded packets |
| A | 0 | 3 | 0 |
| B | 0 | 3 | 0 |
| C | 0 | 3 | 0 |
| D | 0 | 3 | 0 |
| Quadrant | Total seconds | Saturated seconds | Saturation percentage |
|---|---|---|---|
| A | 6860 | 231 | 3.367347% |
| B | 6860 | 91 | 1.326531% |
| C | 6860 | 28 | 0.408163% |
| D | 6860 | 445 | 6.486880% |
Noise dominated data is calculated using 1-second bins in cleaned event files. If a bin has >2000 counts, and if more than 50% of those come from <1% of pixels, then it is considered to be noise-dominated and hence unusable.
| Quadrant | # 1 sec bins | Bins with >0 counts | Bins with >2000 counts | High rate bins dominated by noise | Noise dominated (total time) | Noise dominated (detector-on time) | Marked lightcurve |
|---|---|---|---|---|---|---|---|
| A | 7190 | 6860 | 729 | 729 | 10.14% | 10.63% | 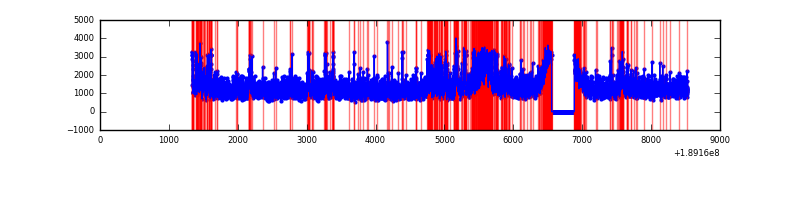 |
| B | 7190 | 6861 | 848 | 848 | 11.79% | 12.36% |  |
| C | 7190 | 6860 | 217 | 217 | 3.02% | 3.16% | 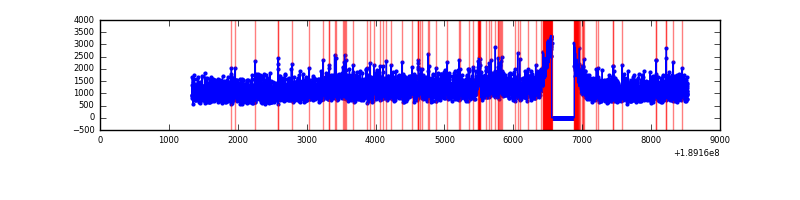 |
| D | 7190 | 6860 | 612 | 612 | 8.51% | 8.92% | 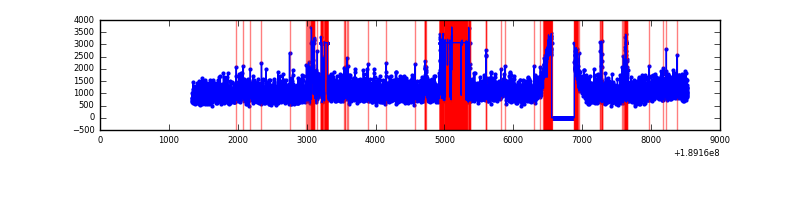 |
Top three noisy pixels from each quadrant. If the there are fewer than three noisy pixels in the level2.evt file, extra rows are filled as -1
| Pixel properties | Quadrant properties | ||||||
|---|---|---|---|---|---|---|---|
| Quadrant | DetID | PixID | Counts | Sigma | Mean | Median | Sigma |
| A | 15 | 127 | 1188107 | 2285.81 | 2124 | 2137 | 518.8 |
| A | 4 | 32 | 88505 | 166.46 | 2124 | 2137 | 518.8 |
| A | 12 | 243 | 22425 | 39.1 | 2124 | 2137 | 518.8 |
| B | 8 | 4 | 1394206 | 2660.49 | 2195 | 2208 | 523.2 |
| B | 12 | 52 | 346244 | 657.55 | 2195 | 2208 | 523.2 |
| B | 15 | 22 | 139592 | 262.58 | 2195 | 2208 | 523.2 |
| C | 15 | 241 | 248416 | 442.41 | 1984 | 2053 | 556.9 |
| C | 7 | 222 | 39422 | 67.11 | 1984 | 2053 | 556.9 |
| C | 3 | 79 | 27885 | 46.39 | 1984 | 2053 | 556.9 |
| D | 13 | 73 | 1176456 | 2007.71 | 1872 | 1943 | 585.0 |
| D | 13 | 252 | 110357 | 185.32 | 1872 | 1943 | 585.0 |
| D | 9 | 64 | 53151 | 87.53 | 1872 | 1943 | 585.0 |
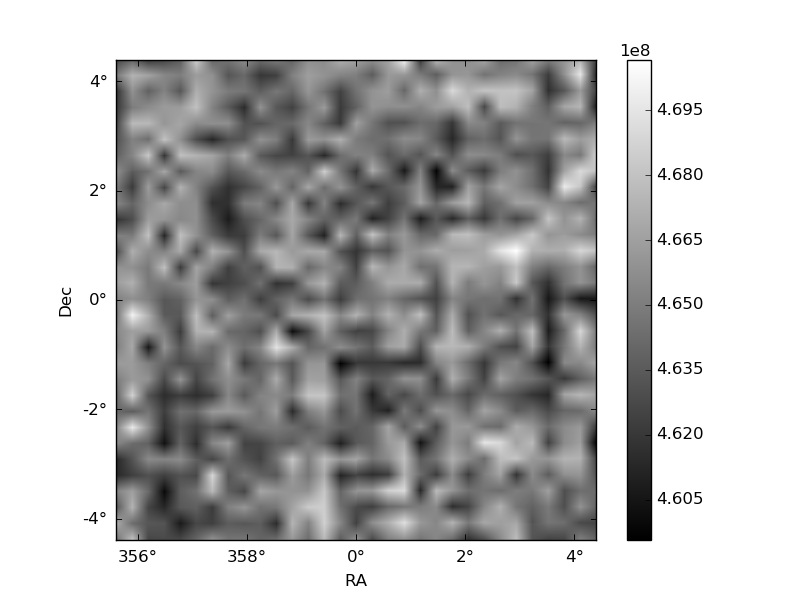
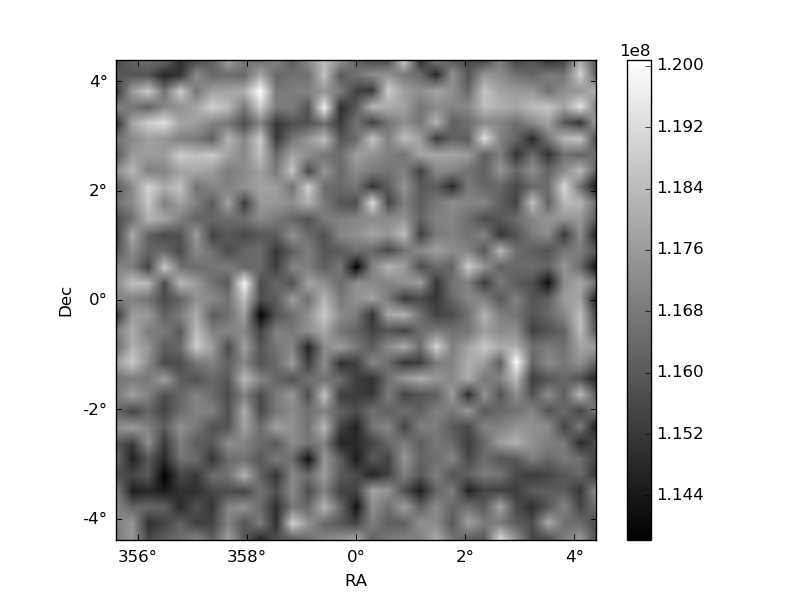
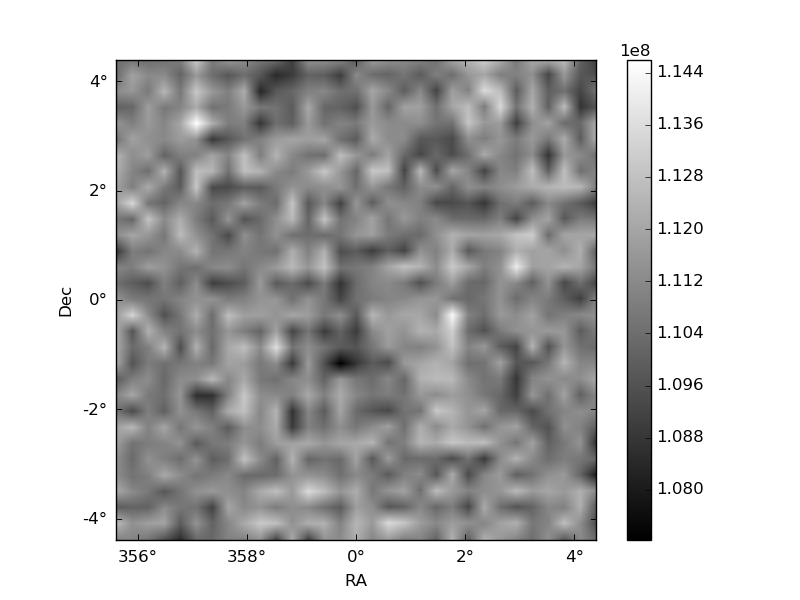
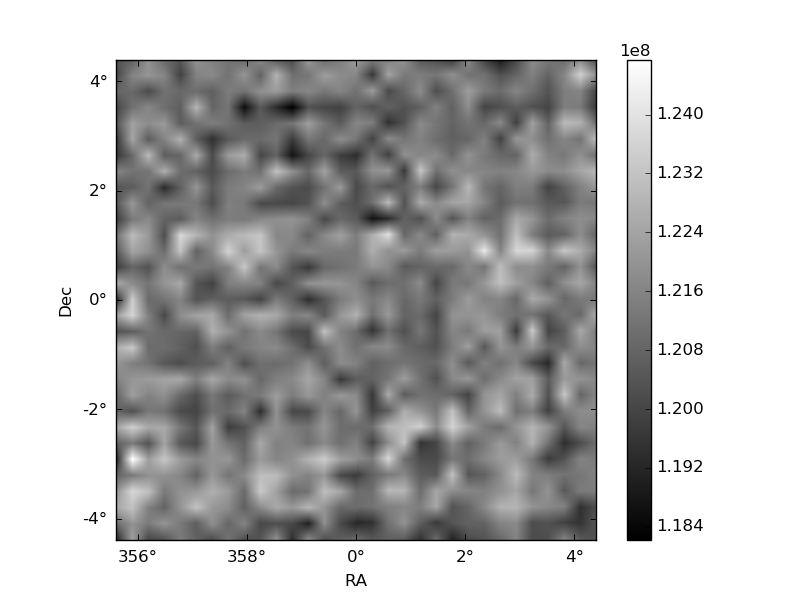
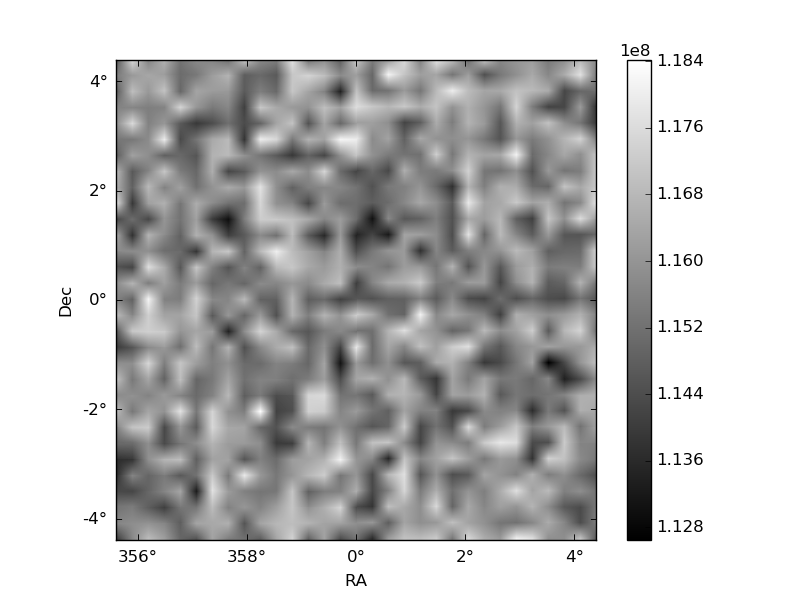
Histogram calculated using DETX and DETY for each event in the final _common_clean file
| Quadrant A | 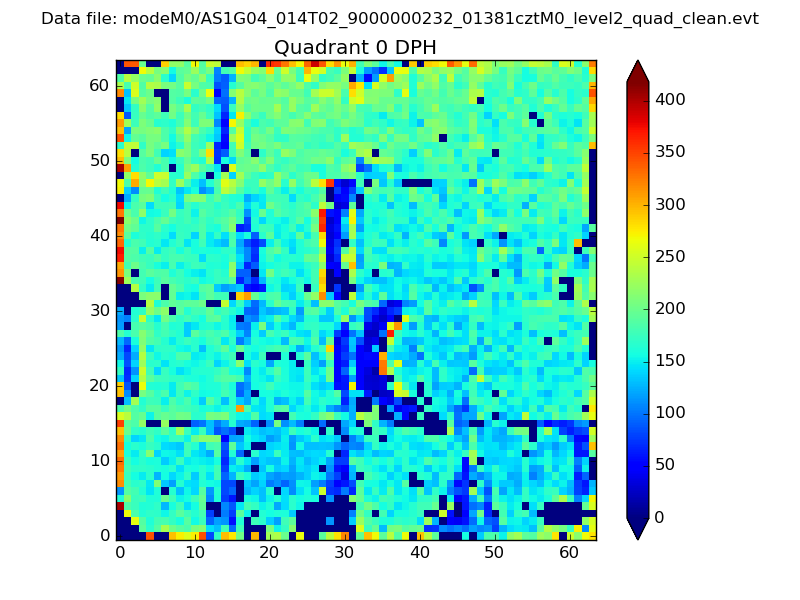 |
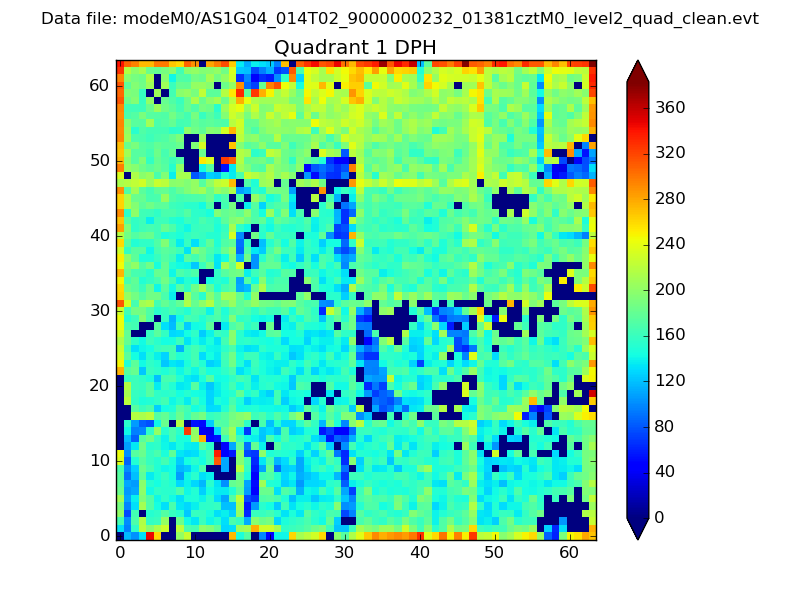 |
Quadrant B |
|---|---|---|---|
| Quadrant D | 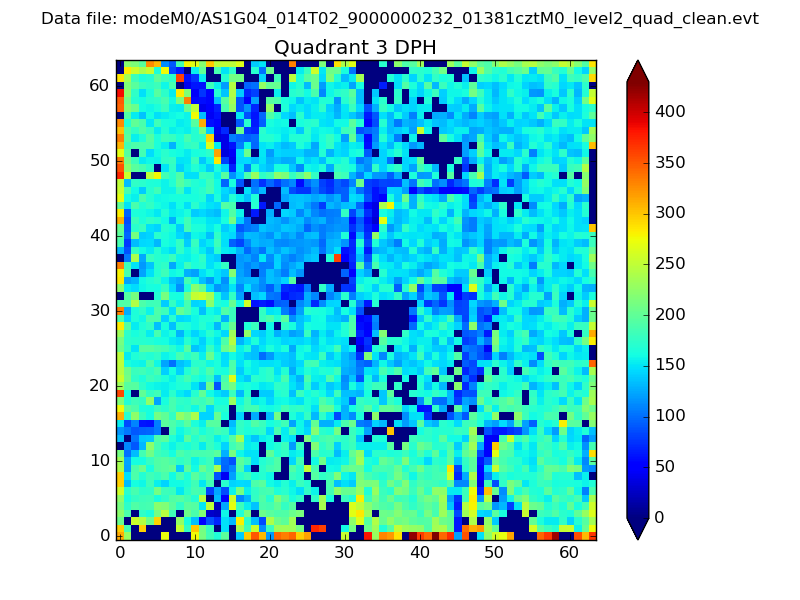 |
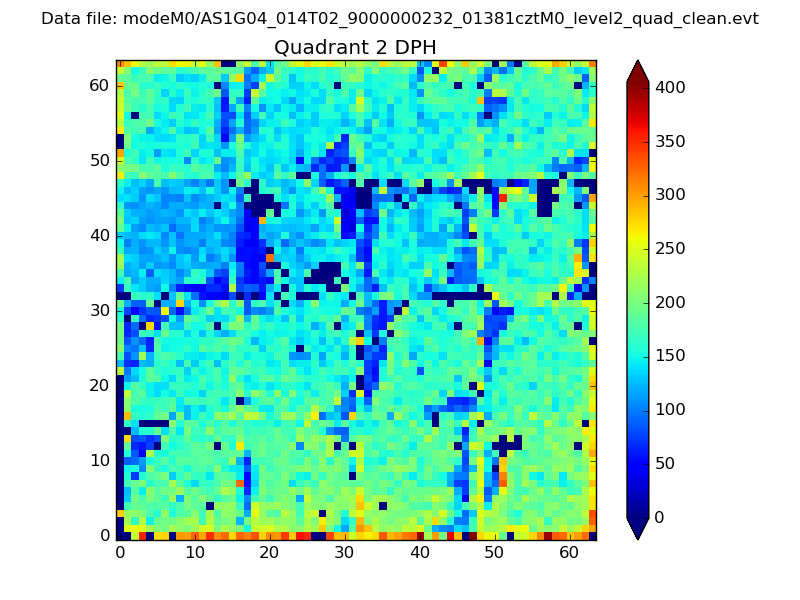 |
Quadrant C |
| Plot type | Count rate plots | Images |
|---|---|---|
| Comparison with Poisson distribution Blue bars denote a histogram of data divided into 1 sec bins. Red curve is a Poisson curve with rate = median count rate of data. |
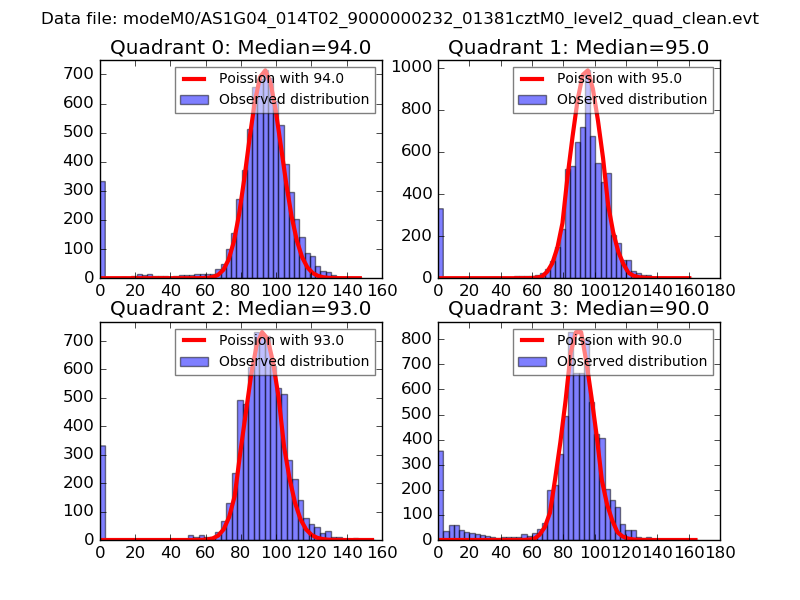 |
 |
| Quadrant-wise count rates Data is divided into 100 sec bins |
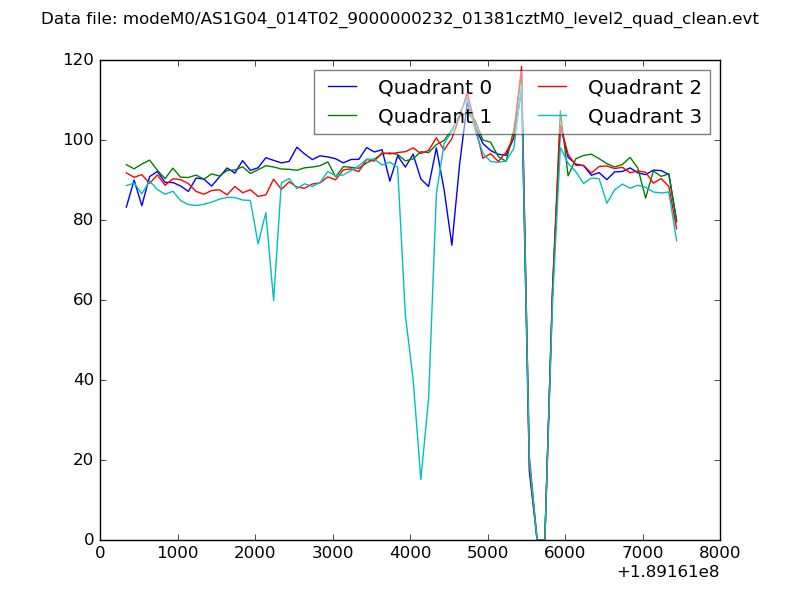 |
|
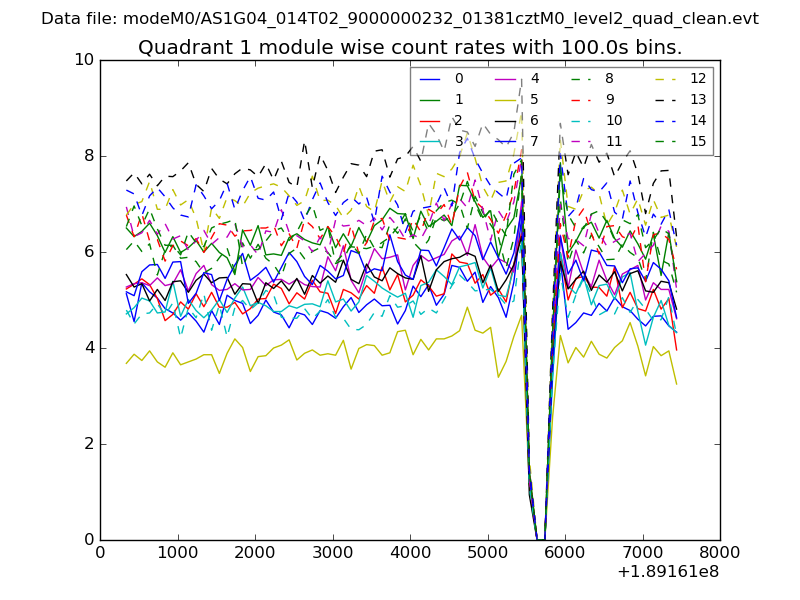
| Module-wise count rates for Quadrant A Data is divided into 100 sec bins |
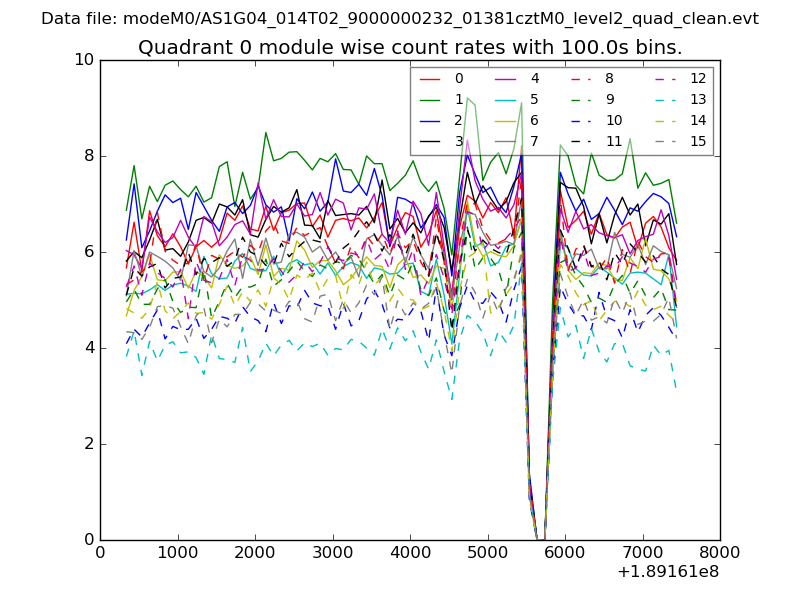 |
 |
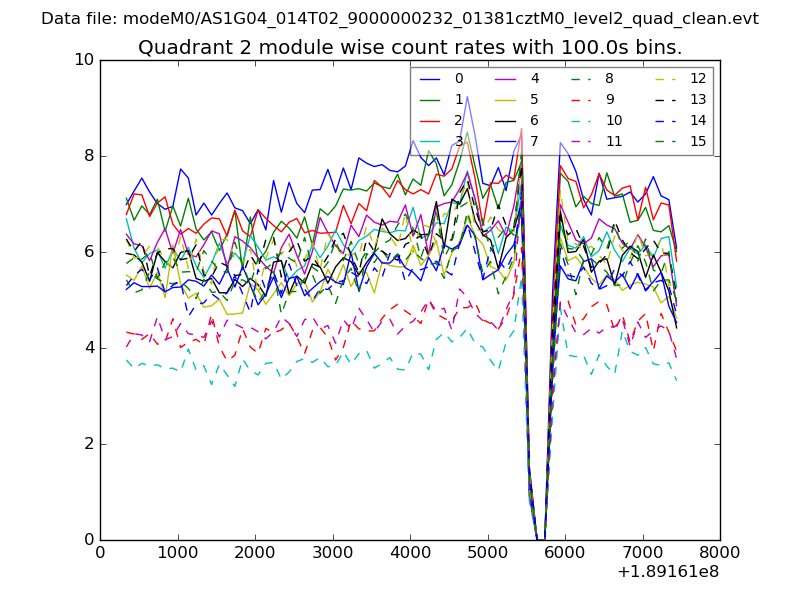
| Module-wise count rates for Quadrant B Data is divided into 100 sec bins |
 |
 |
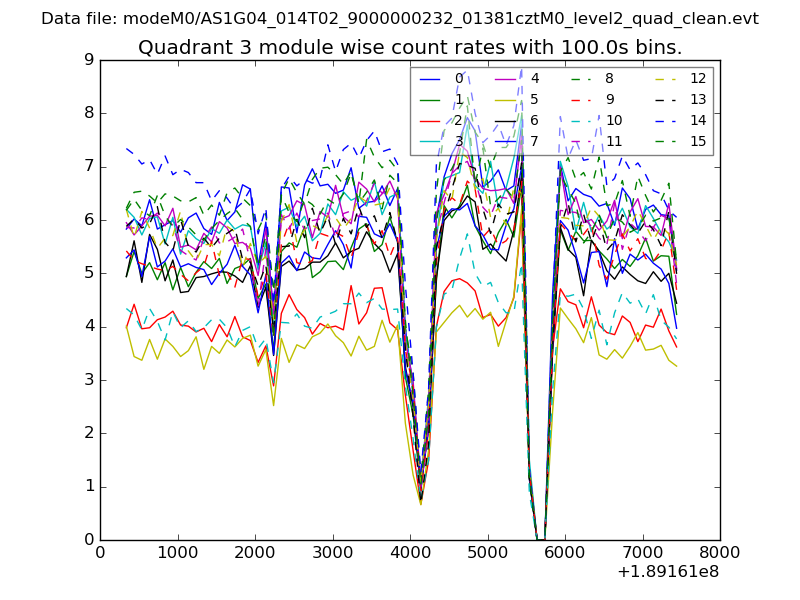
| Module-wise count rates for Quadrant C Data is divided into 100 sec bins |
 |
 |
| Module-wise count rates for Quadrant D Data is divided into 100 sec bins |
 |
 |
| Parameter | Plot |
|---|---|
| CZT HV Monitor | 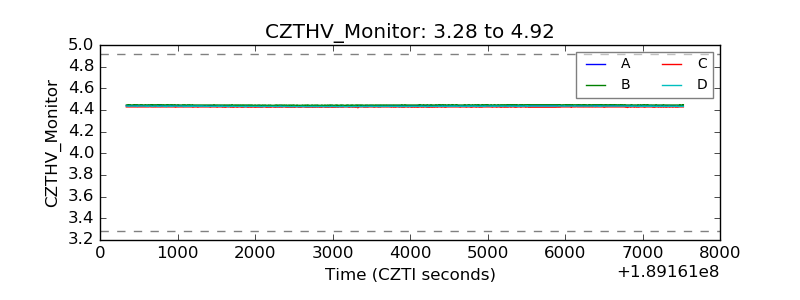 |
| D_VDD | 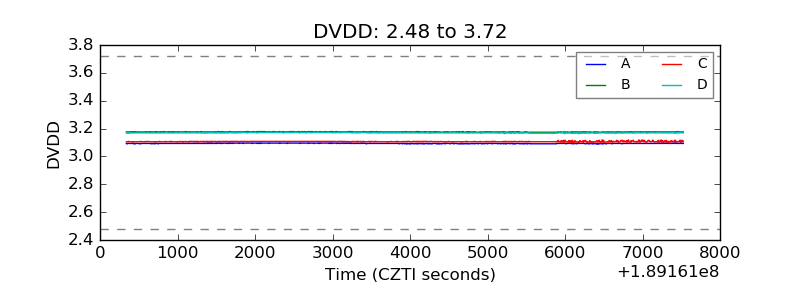 |
| Temperature 1 | 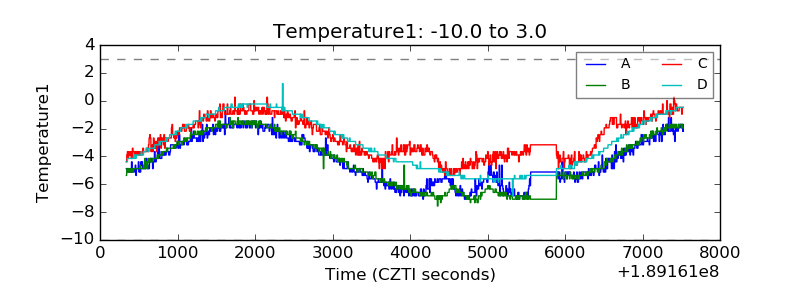 |
| Veto HV Monitor | 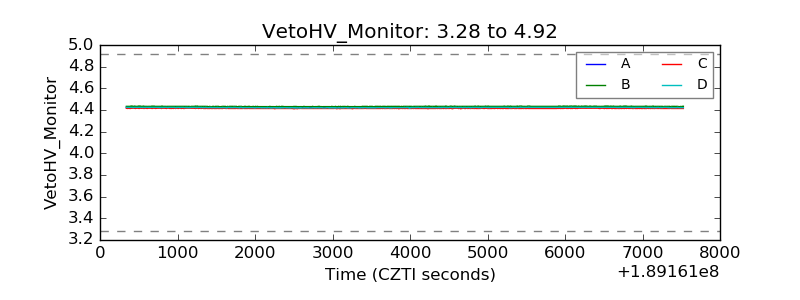 |
| Veto LLD | 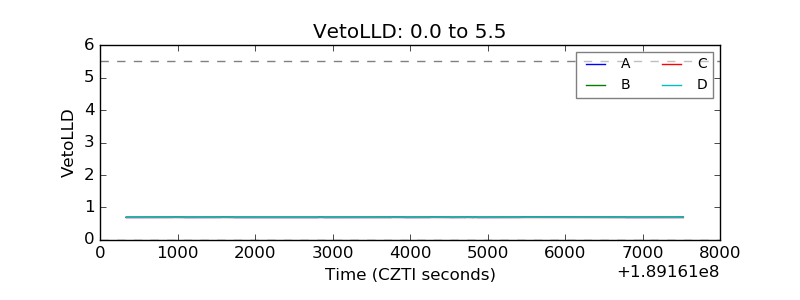 |
| Alpha Counter | 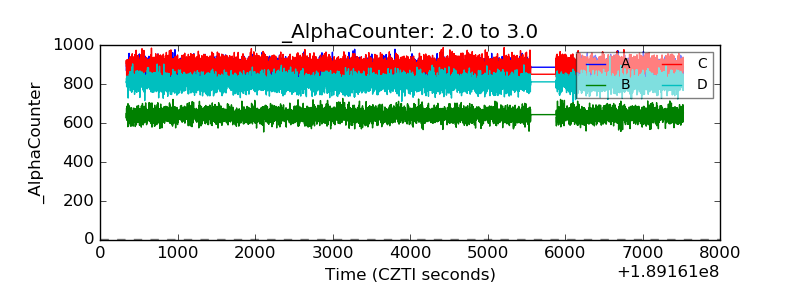 |
| _CPM_Rate | 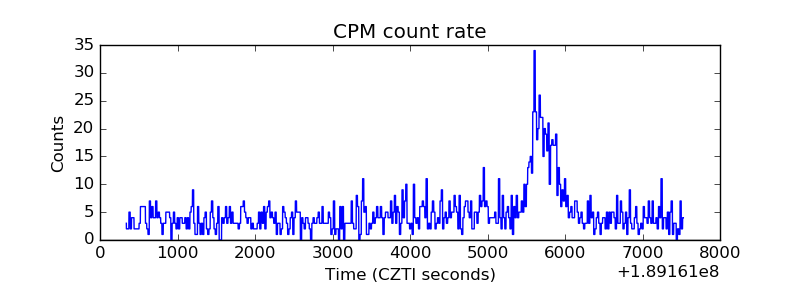 |
| CZT Counter | 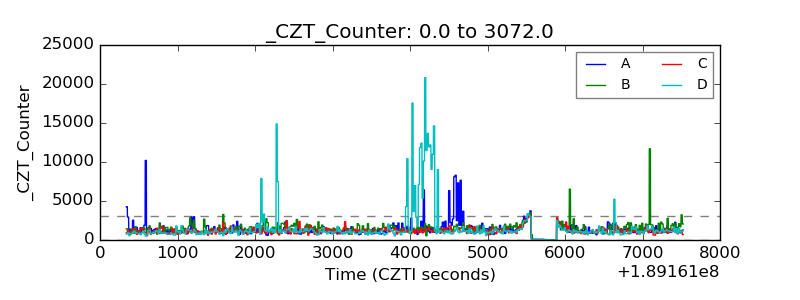 |
| +2.5 Volts monitor |  |
| +5 Volts monitor |  |
| _ROLL_ROT | 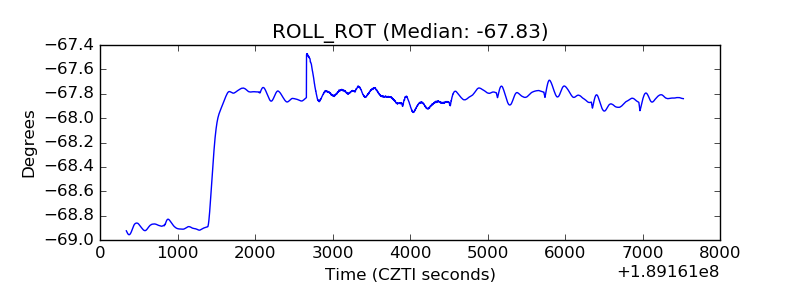 |
| _Roll_DEC | 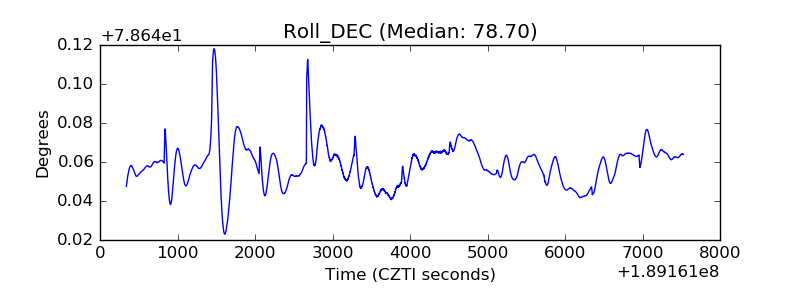 |
| _Roll_RA | 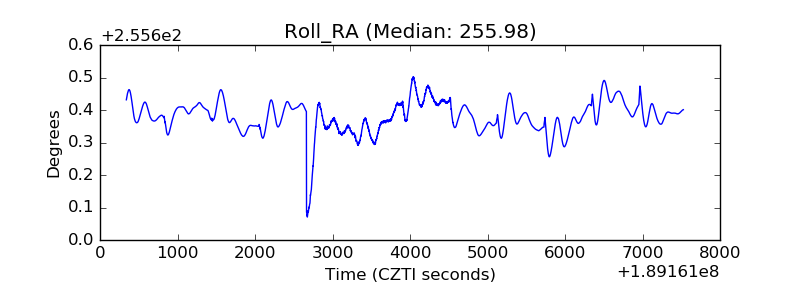 |
| Veto Counter | 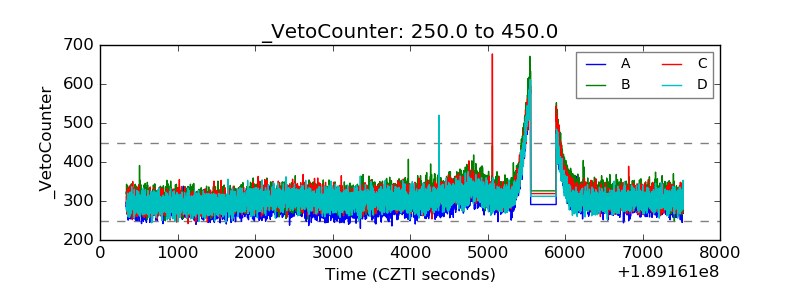 |