| Param | Original file | Final file |
|---|---|---|
| Filename | modeM0/AS1G04_014T02_9000000232_01382cztM0_level2.evt | modeM0/AS1G04_014T02_9000000232_01382cztM0_level2_quad_clean.evt |
| Size (bytes) | 1,259,288,640 | 95,238,720 |
| Size | 1.2 GB | 90.8 MB |
| Events in quadrant A | 11,616,643 | 569,068 |
| Events in quadrant B | 9,635,648 | 637,526 |
| Events in quadrant C | 7,876,584 | 621,951 |
| Events in quadrant D | 8,568,593 | 590,017 |
| Mode SS | |||
|---|---|---|---|
| Quadrant | BADHDUFLAG | Total packets | Discarded packets |
| A | 0 | 136 | 0 |
| B | 0 | 136 | 0 |
| C | 0 | 136 | 0 |
| D | 0 | 136 | 0 |
| Mode M0 | |||
|---|---|---|---|
| Quadrant | BADHDUFLAG | Total packets | Discarded packets |
| A | 0 | 39369 | 2 |
| B | 0 | 33350 | 1 |
| C | 0 | 28129 | 1 |
| D | 0 | 30308 | 1 |
| Mode M9 | |||
|---|---|---|---|
| Quadrant | BADHDUFLAG | Total packets | Discarded packets |
| A | 0 | 5 | 0 |
| B | 0 | 5 | 0 |
| C | 0 | 5 | 0 |
| D | 0 | 5 | 0 |
| Quadrant | Total seconds | Saturated seconds | Saturation percentage |
|---|---|---|---|
| A | 6669 | 1149 | 17.228970% |
| B | 6669 | 88 | 1.319538% |
| C | 6669 | 21 | 0.314890% |
| D | 6669 | 404 | 6.057880% |
Noise dominated data is calculated using 1-second bins in cleaned event files. If a bin has >2000 counts, and if more than 50% of those come from <1% of pixels, then it is considered to be noise-dominated and hence unusable.
| Quadrant | # 1 sec bins | Bins with >0 counts | Bins with >2000 counts | High rate bins dominated by noise | Noise dominated (total time) | Noise dominated (detector-on time) | Marked lightcurve |
|---|---|---|---|---|---|---|---|
| A | 7204 | 6669 | 1864 | 1864 | 25.87% | 27.95% | 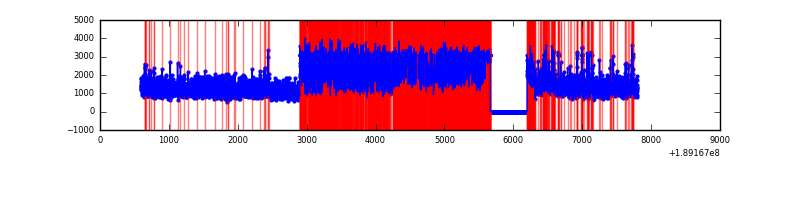 |
| B | 7204 | 6670 | 678 | 678 | 9.41% | 10.16% | 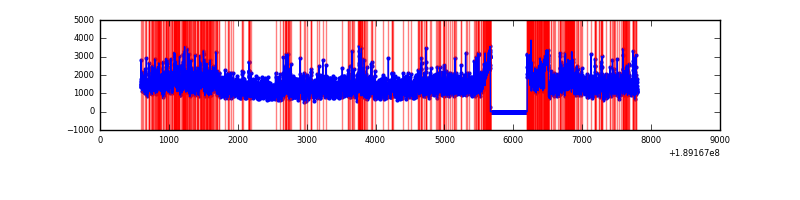 |
| C | 7204 | 6669 | 153 | 153 | 2.12% | 2.29% | 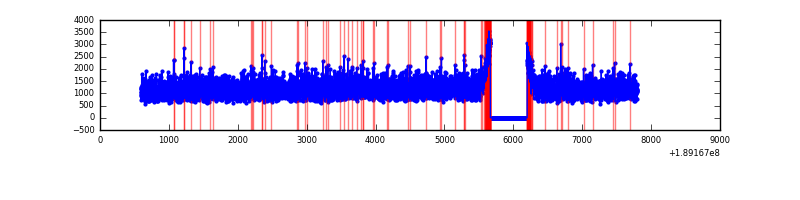 |
| D | 7203 | 6668 | 645 | 645 | 8.95% | 9.67% | 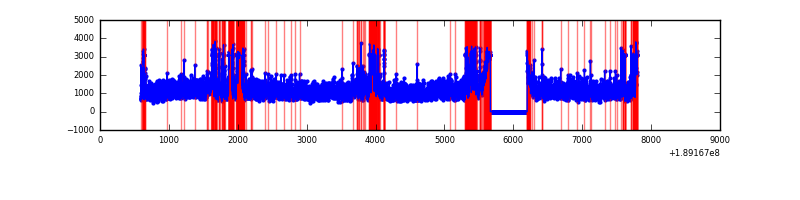 |
Top three noisy pixels from each quadrant. If the there are fewer than three noisy pixels in the level2.evt file, extra rows are filled as -1
| Pixel properties | Quadrant properties | ||||||
|---|---|---|---|---|---|---|---|
| Quadrant | DetID | PixID | Counts | Sigma | Mean | Median | Sigma |
| A | 15 | 127 | 4187252 | 9028.37 | 1911 | 1923 | 463.6 |
| A | 4 | 32 | 52419 | 108.93 | 1911 | 1923 | 463.6 |
| A | 12 | 243 | 24166 | 47.98 | 1911 | 1923 | 463.6 |
| B | 8 | 4 | 714305 | 1392.91 | 2126 | 2133 | 511.3 |
| B | 12 | 52 | 309249 | 600.68 | 2126 | 2133 | 511.3 |
| B | 5 | 249 | 168312 | 325.02 | 2126 | 2133 | 511.3 |
| C | 15 | 241 | 256194 | 469.83 | 1930 | 1999 | 541.0 |
| C | 3 | 79 | 37847 | 66.26 | 1930 | 1999 | 541.0 |
| C | 3 | 111 | 30085 | 51.91 | 1930 | 1999 | 541.0 |
| D | 13 | 73 | 976071 | 1704.5 | 1842 | 1911 | 571.5 |
| D | 2 | 16 | 358260 | 623.51 | 1842 | 1911 | 571.5 |
| D | 13 | 252 | 144147 | 248.87 | 1842 | 1911 | 571.5 |
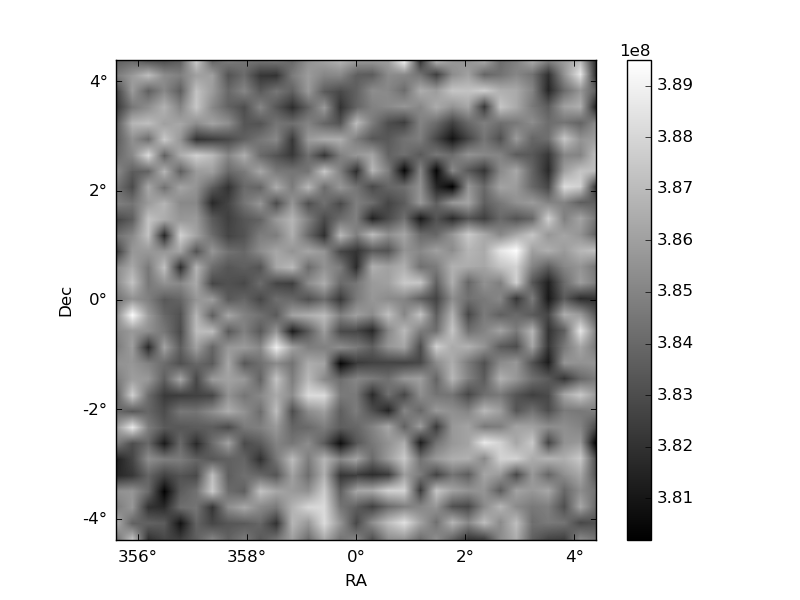
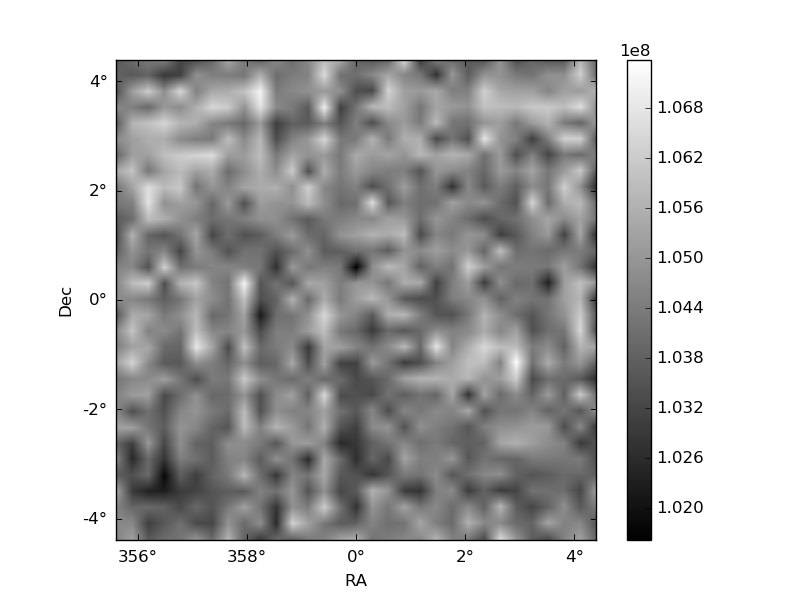
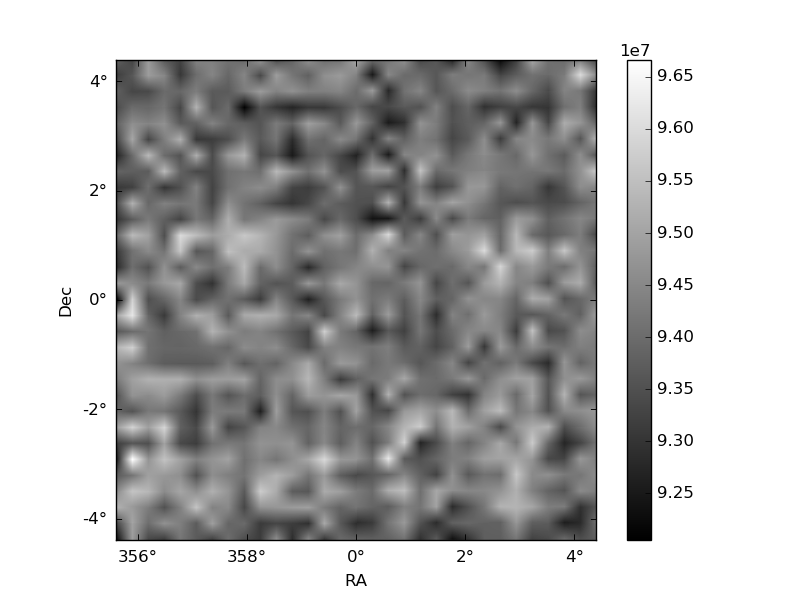
Histogram calculated using DETX and DETY for each event in the final _common_clean file
| Quadrant A | 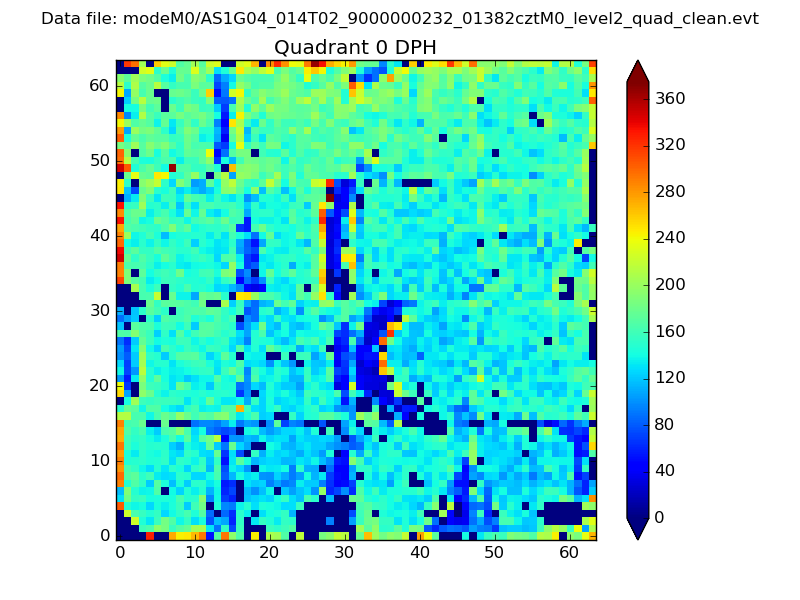 |
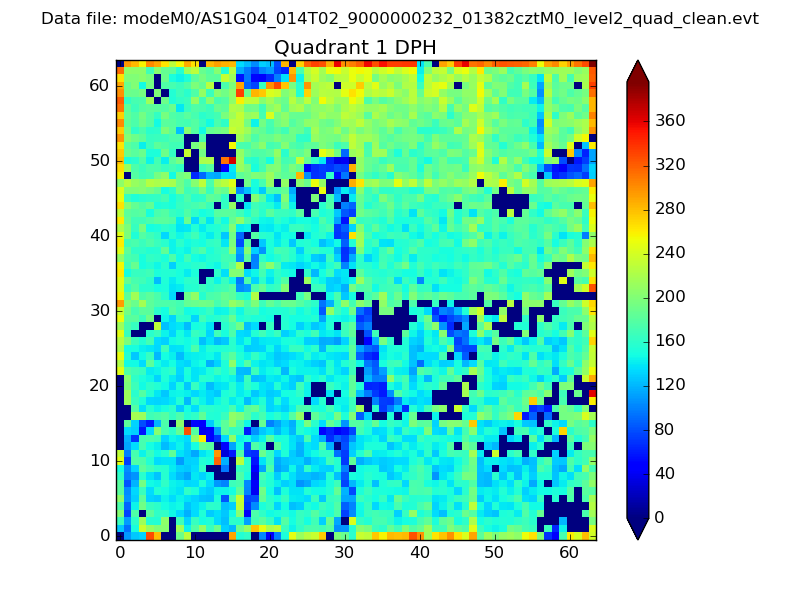 |
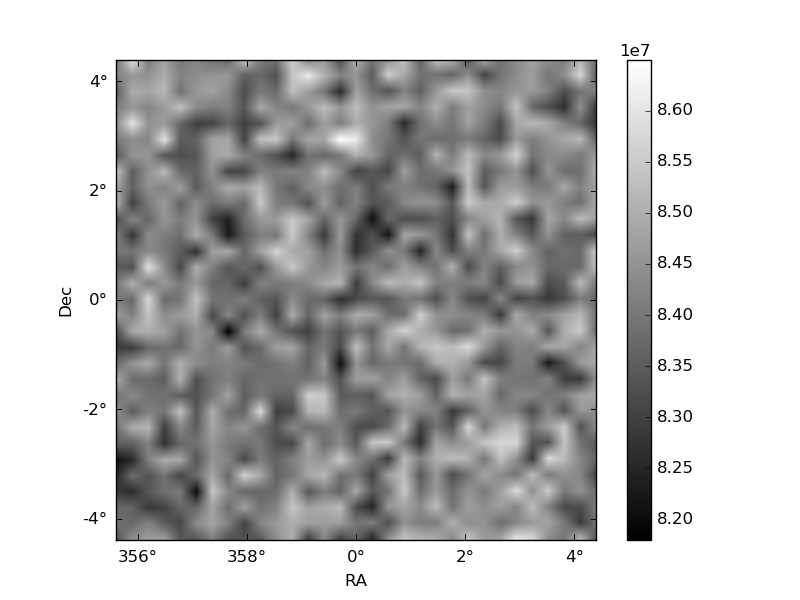
Quadrant B |
|---|---|---|---|
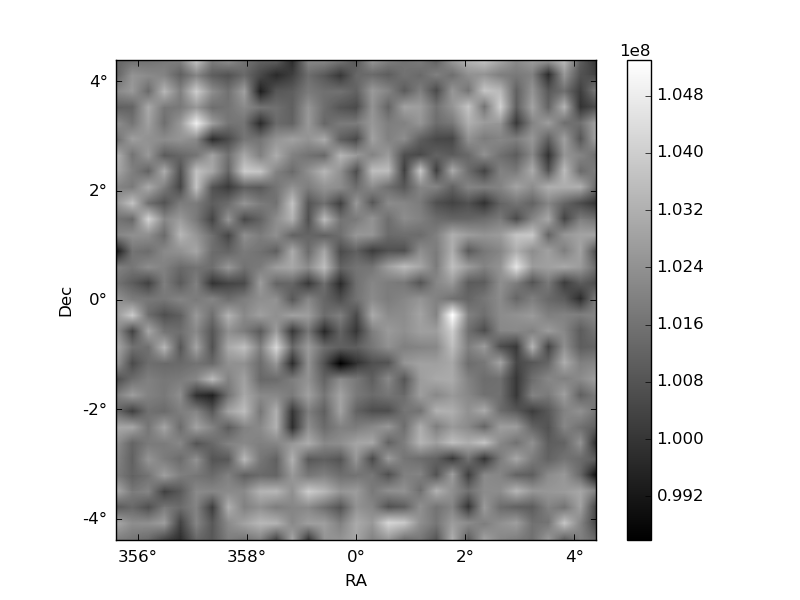
| Quadrant D | 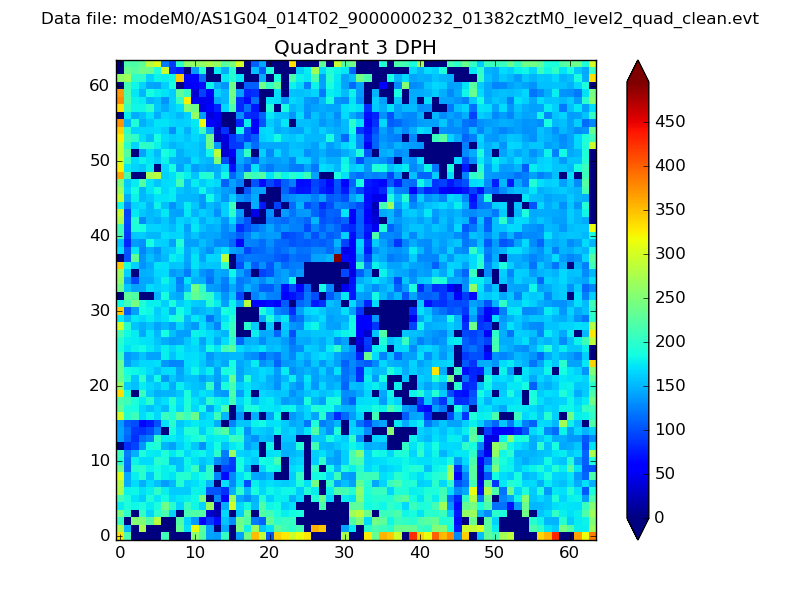 |
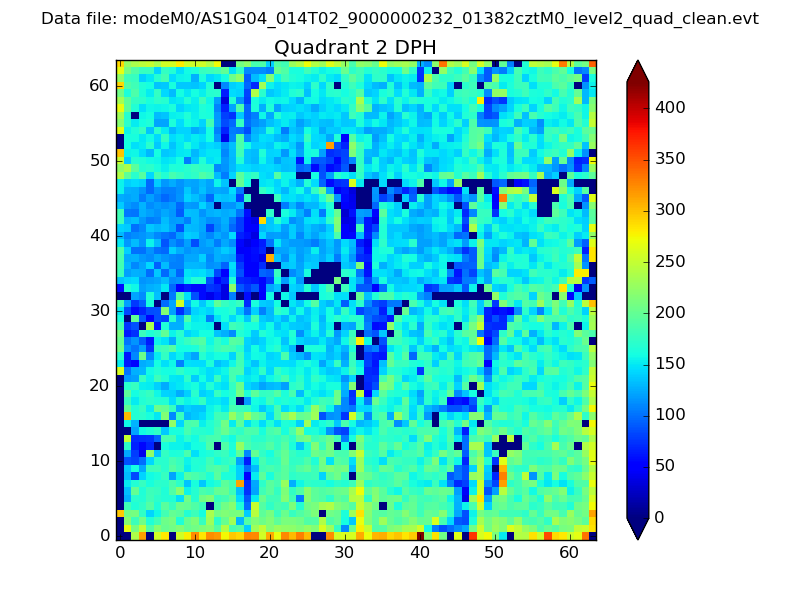 |
Quadrant C |
| Plot type | Count rate plots | Images |
|---|---|---|
| Comparison with Poisson distribution Blue bars denote a histogram of data divided into 1 sec bins. Red curve is a Poisson curve with rate = median count rate of data. |
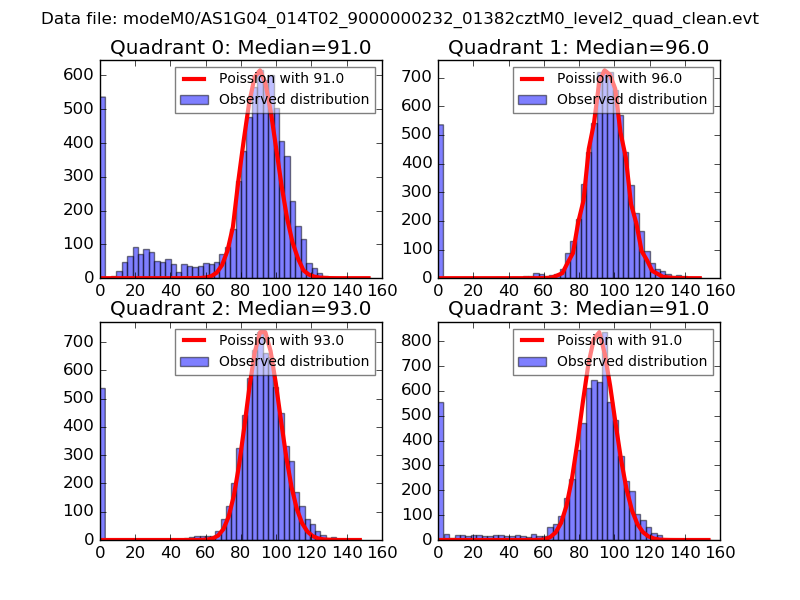 |
 |
| Quadrant-wise count rates Data is divided into 100 sec bins |
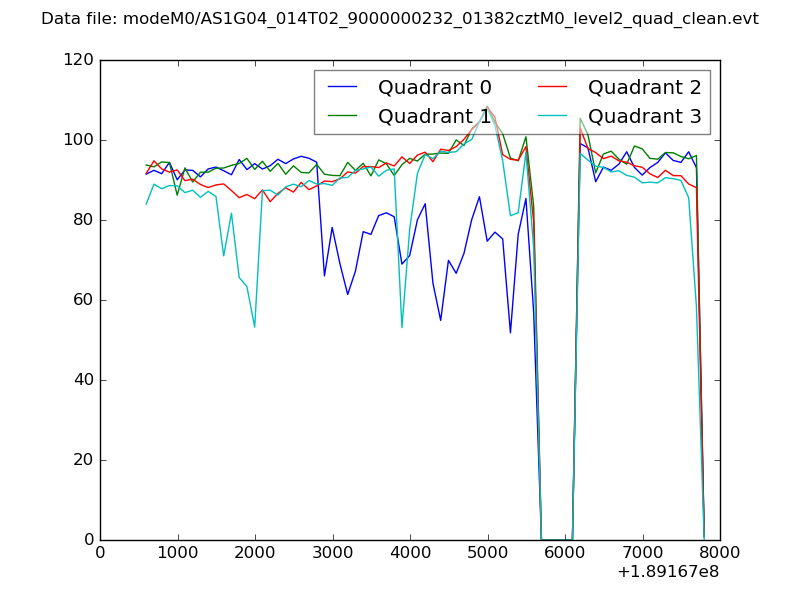 |
|
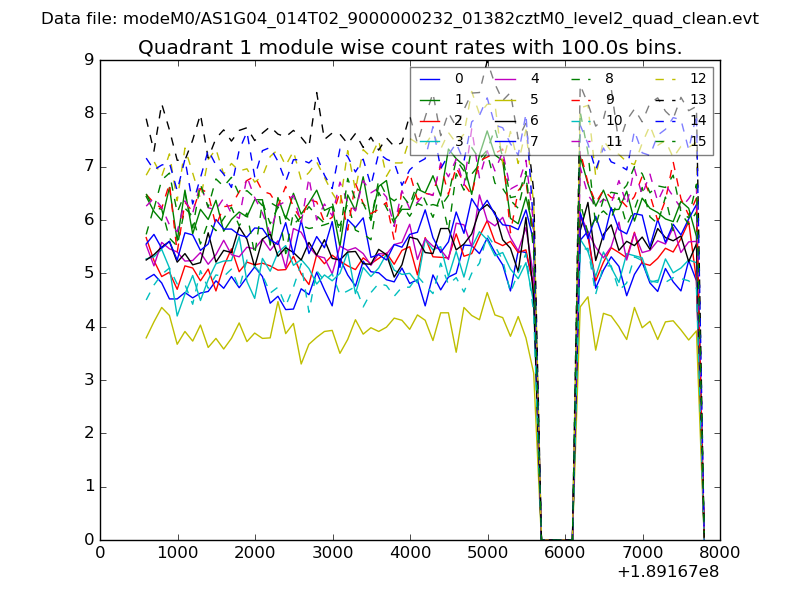
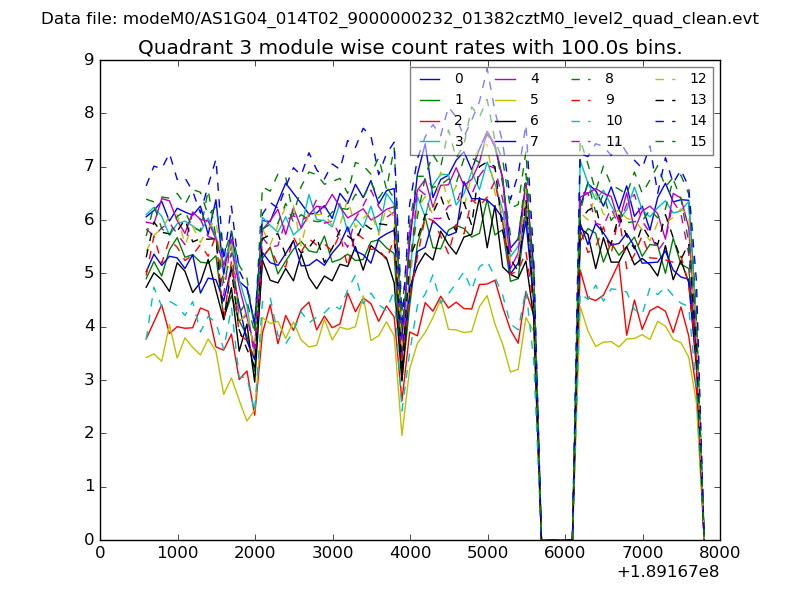
| Module-wise count rates for Quadrant A Data is divided into 100 sec bins |
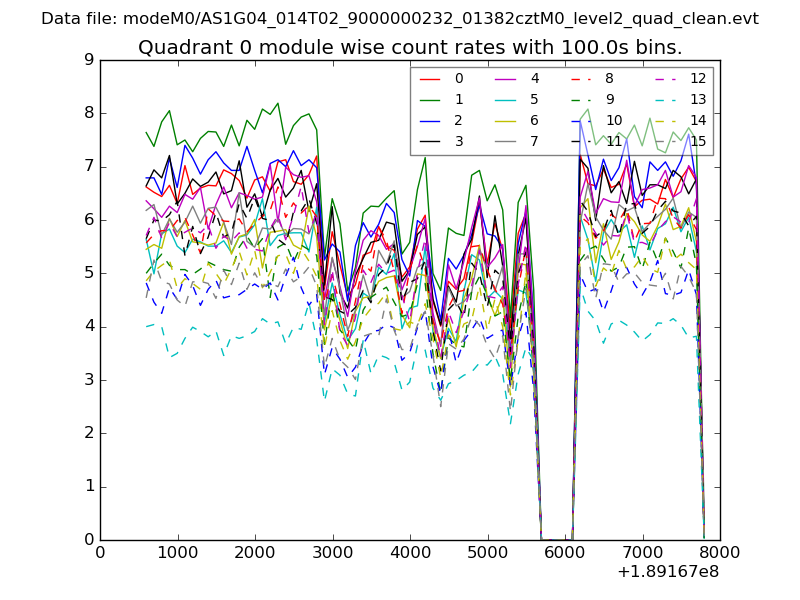 |
 |
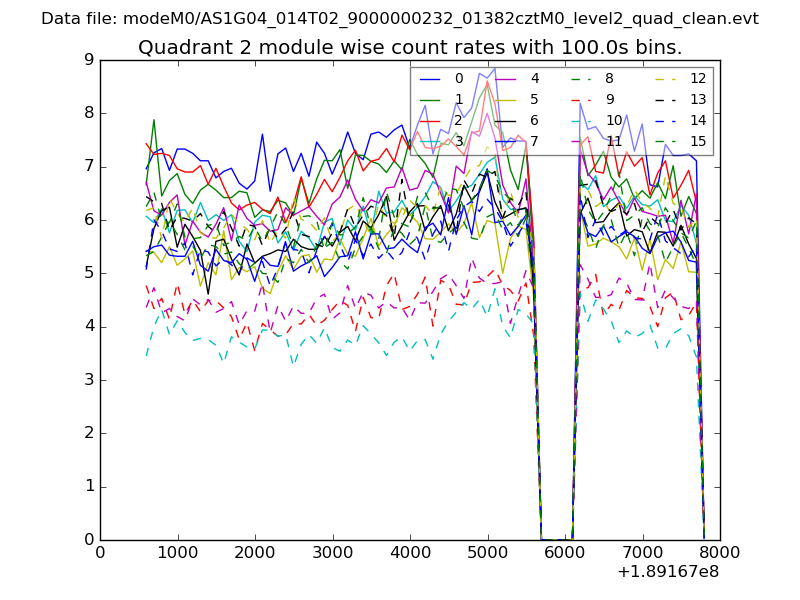
| Module-wise count rates for Quadrant B Data is divided into 100 sec bins |
 |
 |
| Module-wise count rates for Quadrant C Data is divided into 100 sec bins |
 |
 |
| Module-wise count rates for Quadrant D Data is divided into 100 sec bins |
 |
 |
| Parameter | Plot |
|---|---|
| CZT HV Monitor | 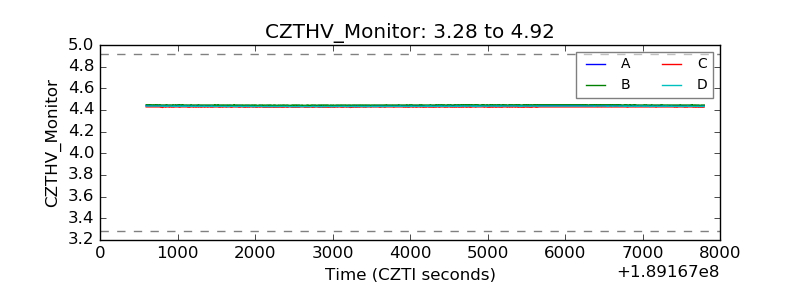 |
| D_VDD | 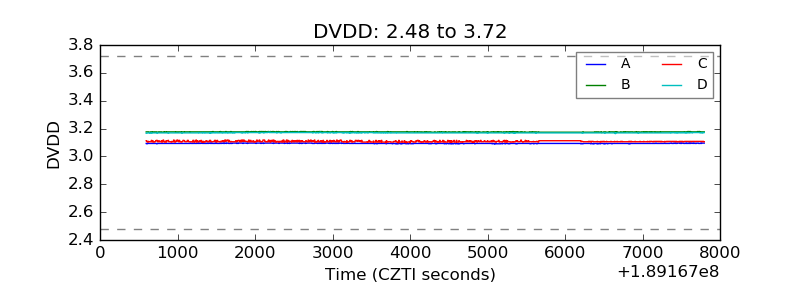 |
| Temperature 1 | 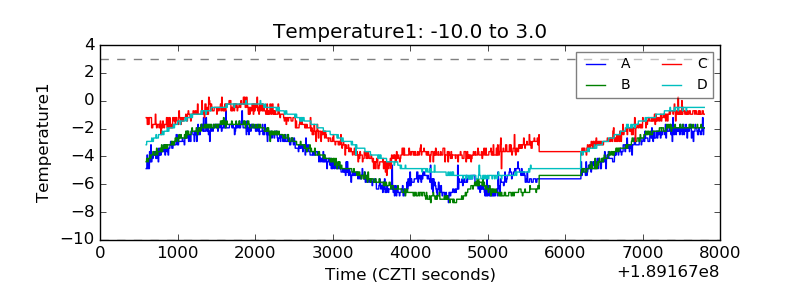 |
| Veto HV Monitor | 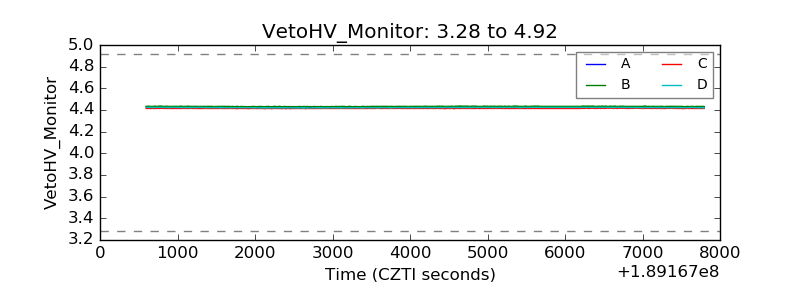 |
| Veto LLD | 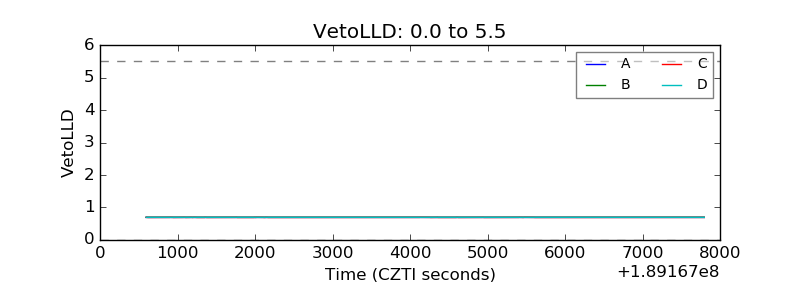 |
| Alpha Counter | 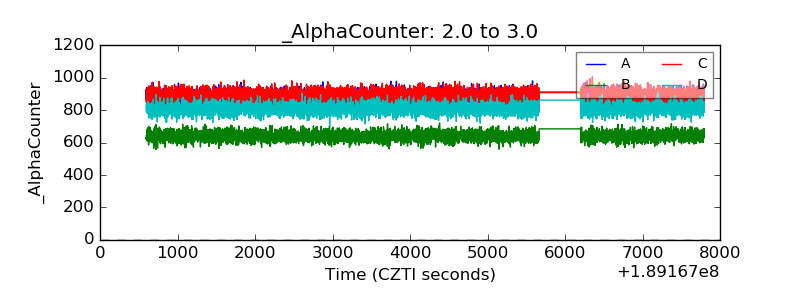 |
| _CPM_Rate | 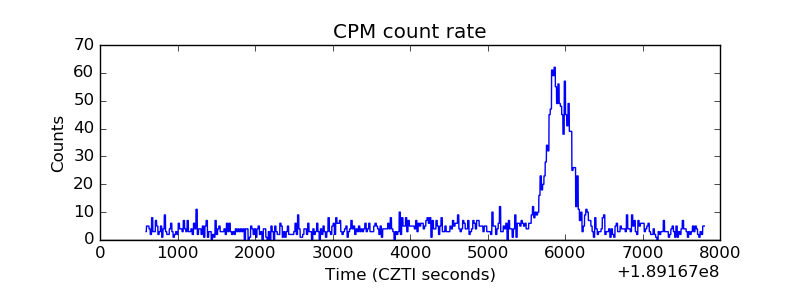 |
| CZT Counter | 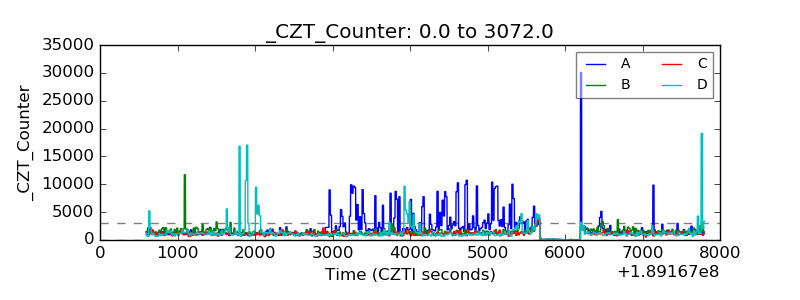 |
| +2.5 Volts monitor |  |
| +5 Volts monitor | 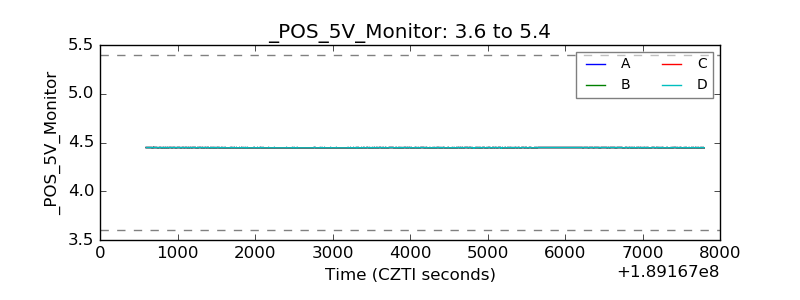 |
| _ROLL_ROT | 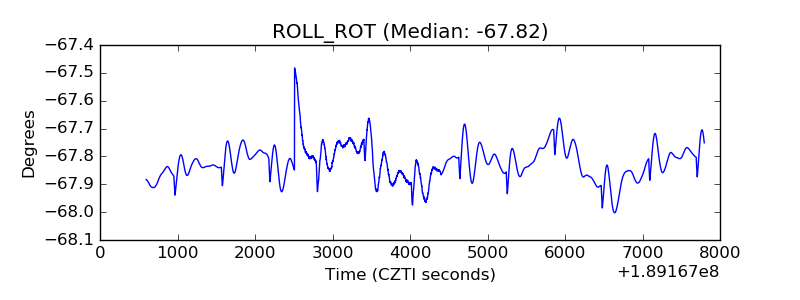 |
| _Roll_DEC | 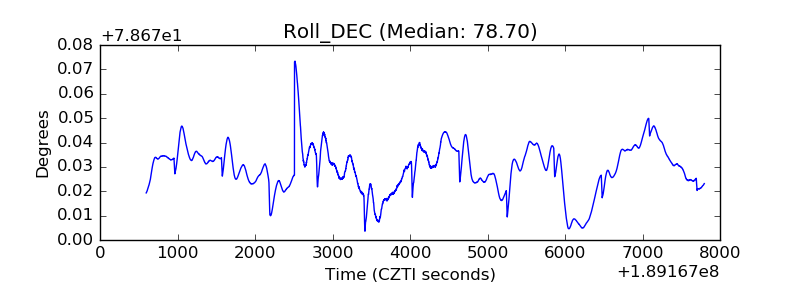 |
| _Roll_RA | 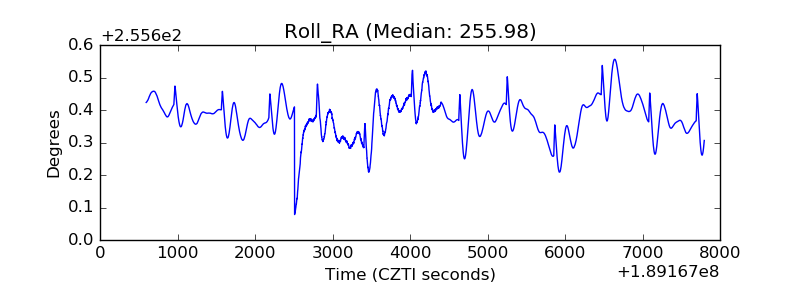 |
| Veto Counter | 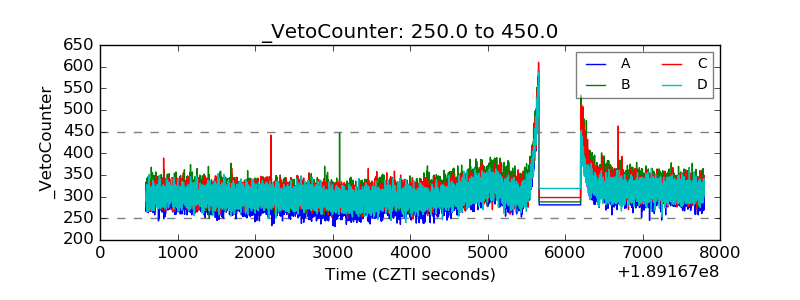 |