| Param | Original file | Final file |
|---|---|---|
| Filename | modeM0/AS1G04_014T02_9000000232_01383cztM0_level2.evt | modeM0/AS1G04_014T02_9000000232_01383cztM0_level2_quad_clean.evt |
| Size (bytes) | 1,232,562,240 | 96,376,320 |
| Size | 1.1 GB | 91.9 MB |
| Events in quadrant A | 10,578,712 | 618,263 |
| Events in quadrant B | 9,109,327 | 644,903 |
| Events in quadrant C | 7,908,096 | 622,651 |
| Events in quadrant D | 9,292,261 | 567,822 |
| Mode SS | |||
|---|---|---|---|
| Quadrant | BADHDUFLAG | Total packets | Discarded packets |
| A | 0 | 134 | 0 |
| B | 0 | 134 | 0 |
| C | 0 | 134 | 0 |
| D | 0 | 134 | 0 |
| Mode M0 | |||
|---|---|---|---|
| Quadrant | BADHDUFLAG | Total packets | Discarded packets |
| A | 0 | 36154 | 2 |
| B | 0 | 31743 | 1 |
| C | 0 | 28169 | 1 |
| D | 0 | 32484 | 1 |
| Mode M9 | |||
|---|---|---|---|
| Quadrant | BADHDUFLAG | Total packets | Discarded packets |
| A | 0 | 7 | 0 |
| B | 0 | 7 | 0 |
| C | 0 | 7 | 0 |
| D | 0 | 7 | 0 |
| Quadrant | Total seconds | Saturated seconds | Saturation percentage |
|---|---|---|---|
| A | 6666 | 491 | 7.365737% |
| B | 6666 | 91 | 1.365137% |
| C | 6666 | 38 | 0.570057% |
| D | 6666 | 821 | 12.316232% |
Noise dominated data is calculated using 1-second bins in cleaned event files. If a bin has >2000 counts, and if more than 50% of those come from <1% of pixels, then it is considered to be noise-dominated and hence unusable.
| Quadrant | # 1 sec bins | Bins with >0 counts | Bins with >2000 counts | High rate bins dominated by noise | Noise dominated (total time) | Noise dominated (detector-on time) | Marked lightcurve |
|---|---|---|---|---|---|---|---|
| A | 7361 | 6666 | 1209 | 1209 | 16.42% | 18.14% | 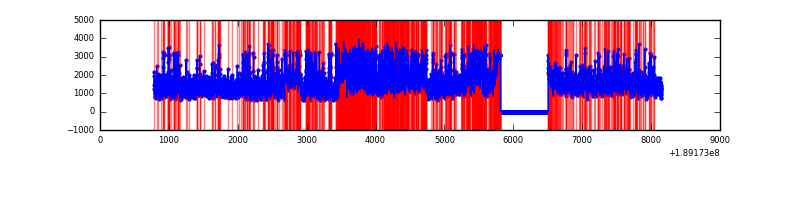 |
| B | 7361 | 6667 | 597 | 597 | 8.11% | 8.95% | 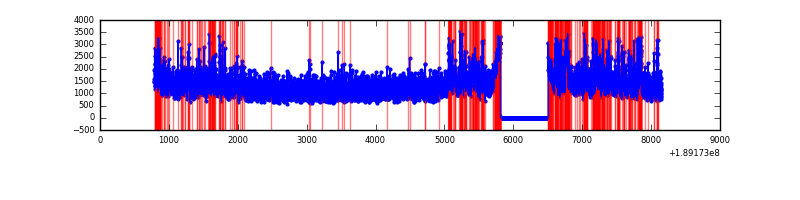 |
| C | 7361 | 6666 | 157 | 157 | 2.13% | 2.36% | 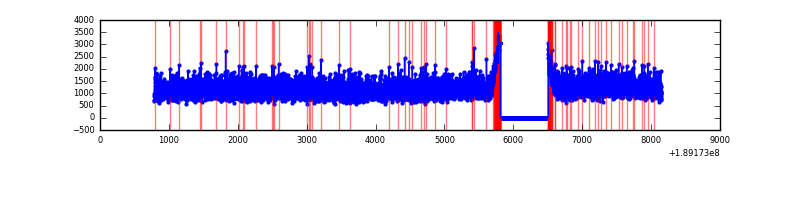 |
| D | 7361 | 6666 | 1100 | 1100 | 14.94% | 16.50% | 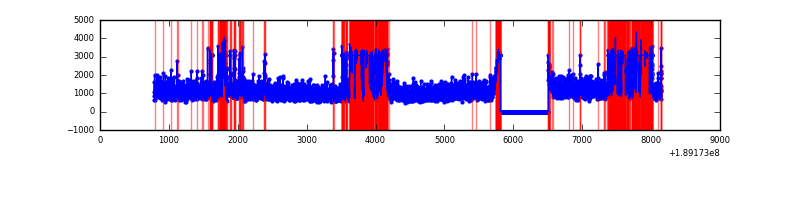 |
Top three noisy pixels from each quadrant. If the there are fewer than three noisy pixels in the level2.evt file, extra rows are filled as -1
| Pixel properties | Quadrant properties | ||||||
|---|---|---|---|---|---|---|---|
| Quadrant | DetID | PixID | Counts | Sigma | Mean | Median | Sigma |
| A | 15 | 127 | 2641255 | 5374.52 | 2022 | 2035 | 491.1 |
| A | 3 | 80 | 128761 | 258.06 | 2022 | 2035 | 491.1 |
| A | 0 | 253 | 22743 | 42.17 | 2022 | 2035 | 491.1 |
| B | 8 | 4 | 570863 | 1129.91 | 2127 | 2134 | 503.3 |
| B | 12 | 52 | 136228 | 266.41 | 2127 | 2134 | 503.3 |
| B | 15 | 22 | 96044 | 186.57 | 2127 | 2134 | 503.3 |
| C | 15 | 241 | 224039 | 406.37 | 1955 | 2023 | 546.3 |
| C | 3 | 79 | 25905 | 43.71 | 1955 | 2023 | 546.3 |
| C | 3 | 111 | 24183 | 40.56 | 1955 | 2023 | 546.3 |
| D | 13 | 73 | 2468689 | 4434.71 | 1790 | 1854 | 556.3 |
| D | 9 | 53 | 34700 | 59.05 | 1790 | 1854 | 556.3 |
| D | 5 | 234 | 34442 | 58.58 | 1790 | 1854 | 556.3 |
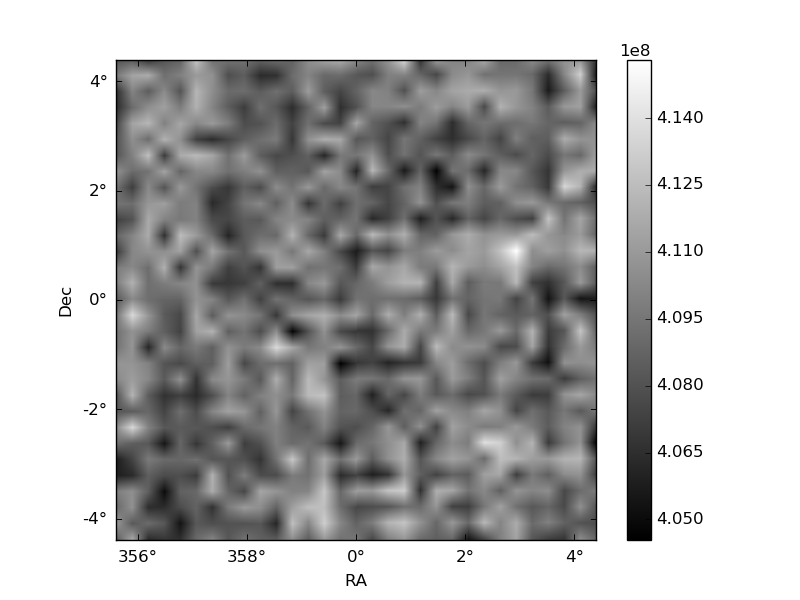
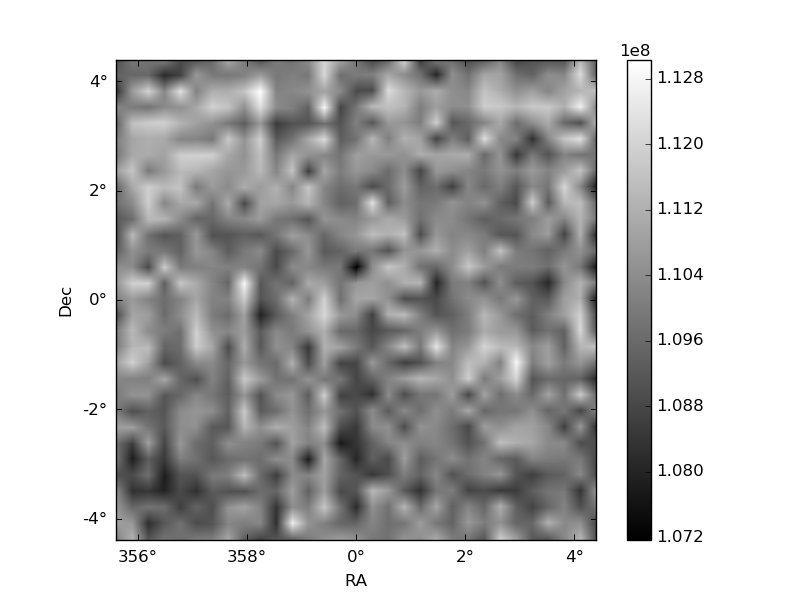
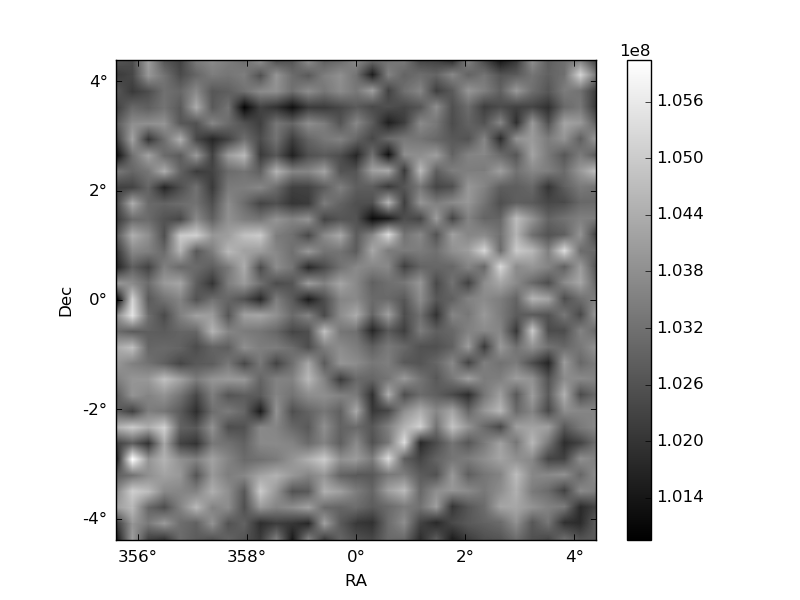
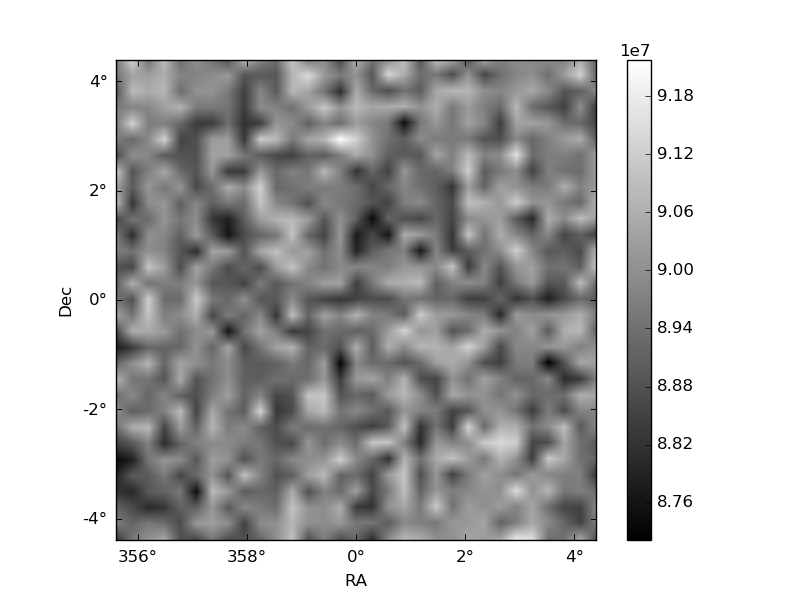
Histogram calculated using DETX and DETY for each event in the final _common_clean file
| Quadrant A | 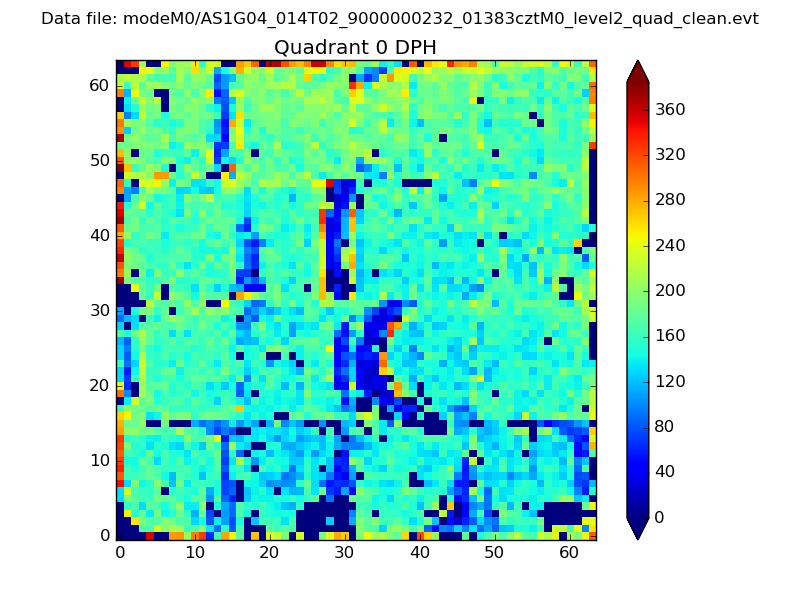 |
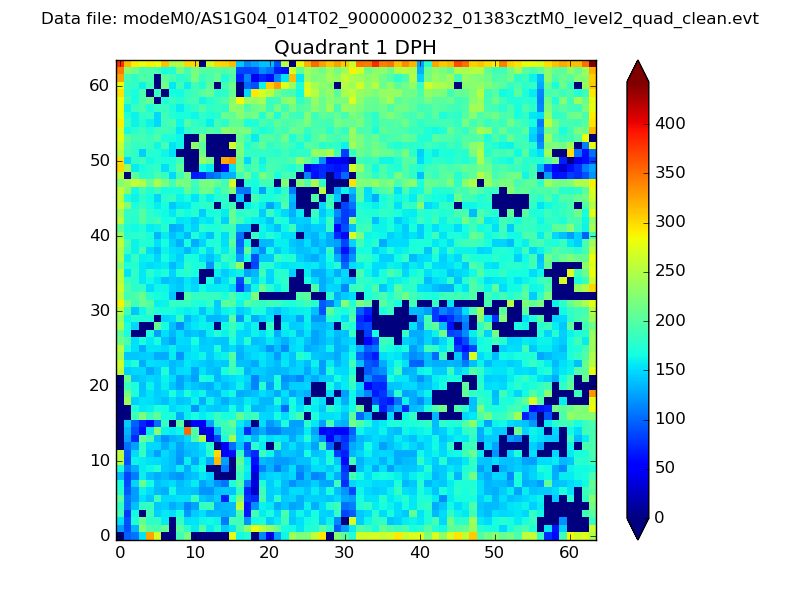 |
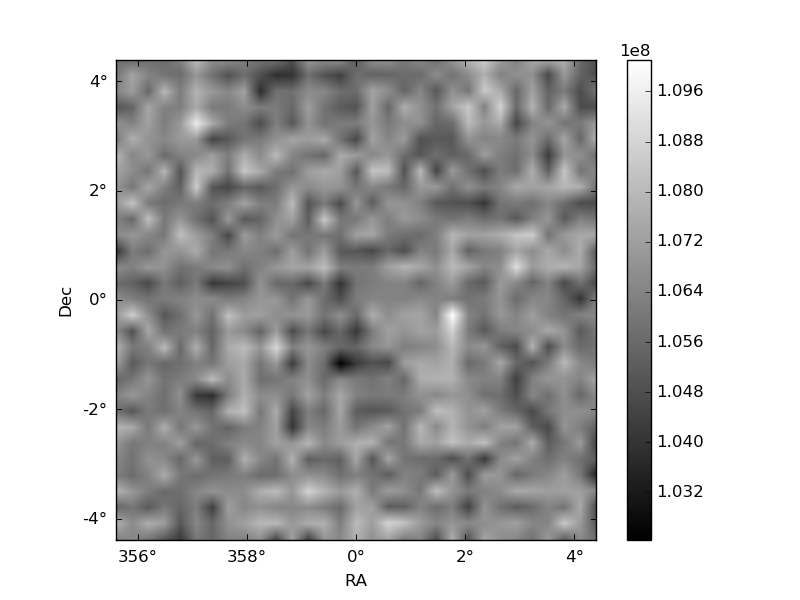
Quadrant B |
|---|---|---|---|
| Quadrant D | 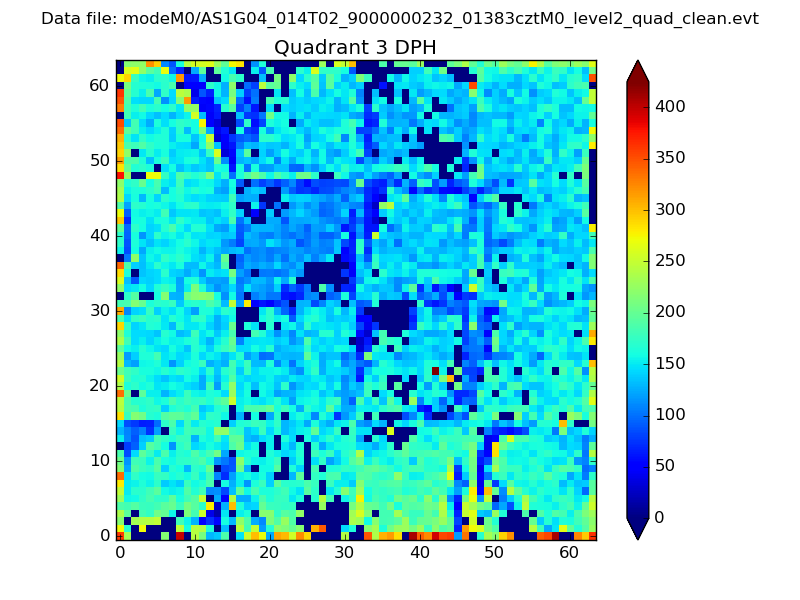 |
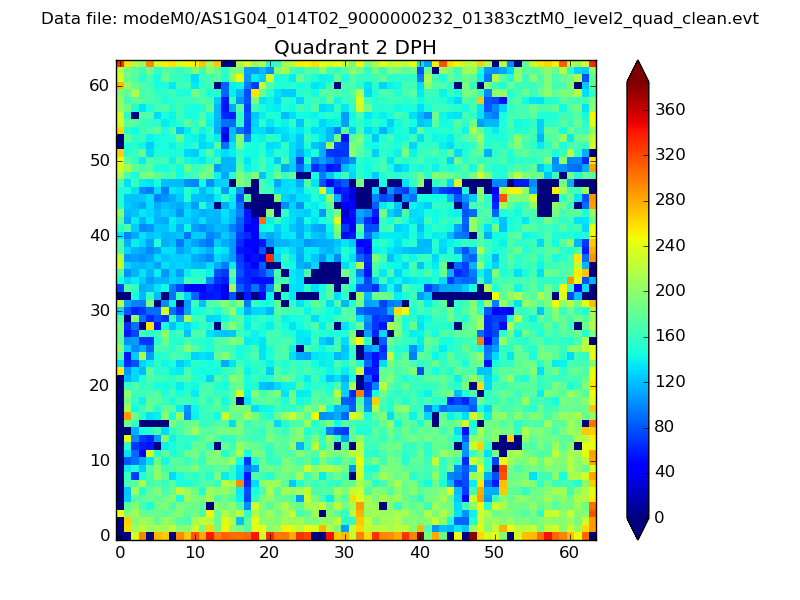 |
Quadrant C |
| Plot type | Count rate plots | Images |
|---|---|---|
| Comparison with Poisson distribution Blue bars denote a histogram of data divided into 1 sec bins. Red curve is a Poisson curve with rate = median count rate of data. |
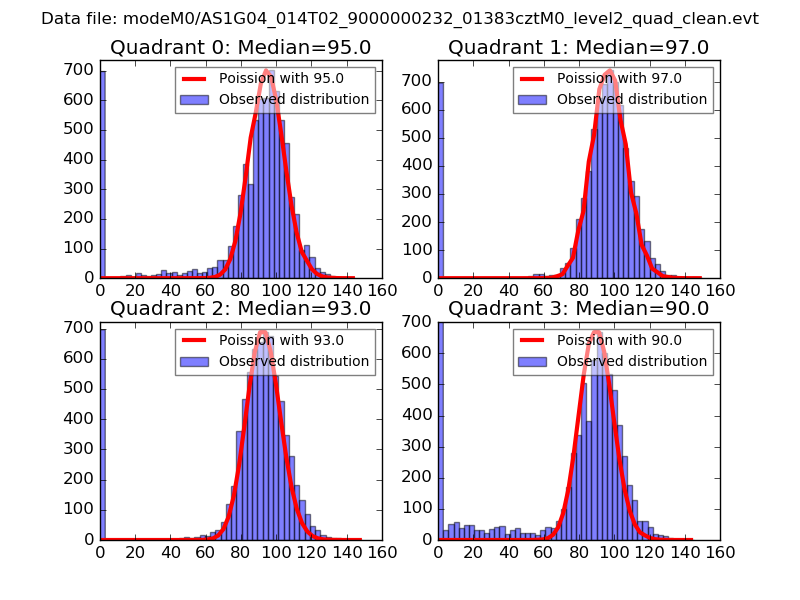 |
 |
| Quadrant-wise count rates Data is divided into 100 sec bins |
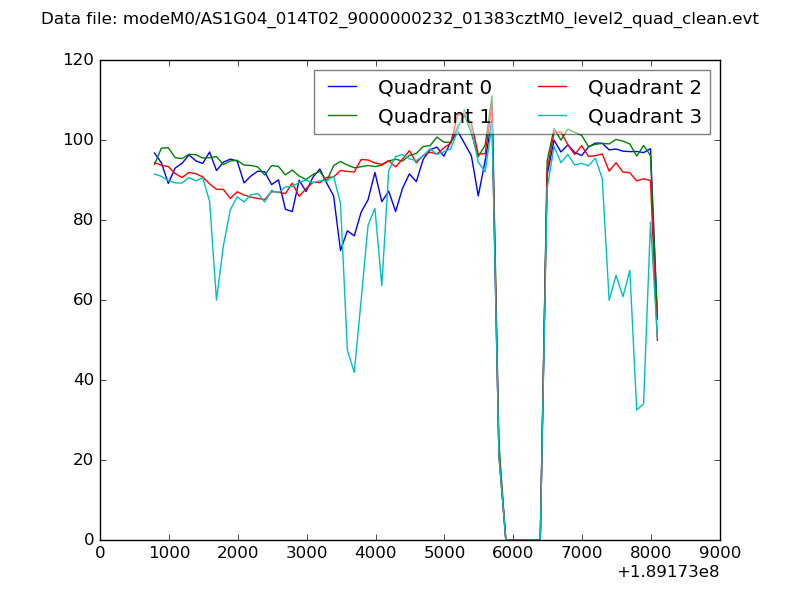 |
|
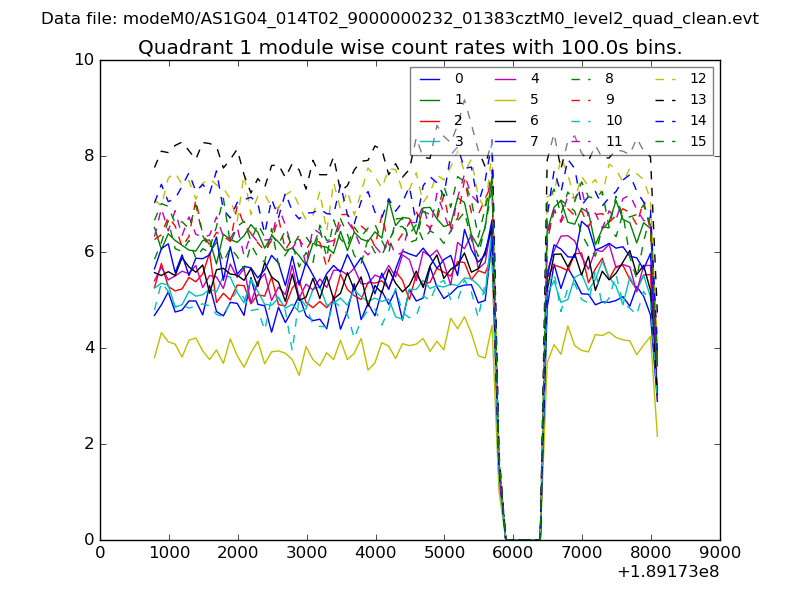
| Module-wise count rates for Quadrant A Data is divided into 100 sec bins |
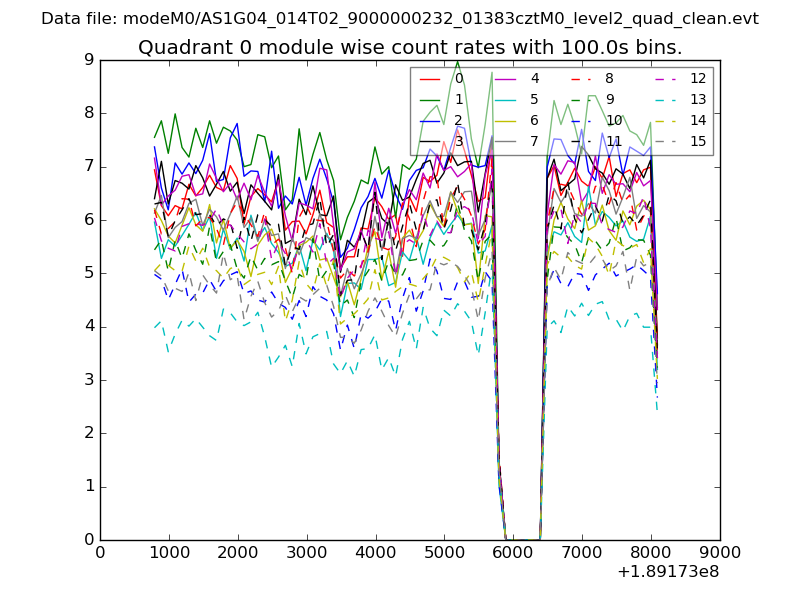 |
 |
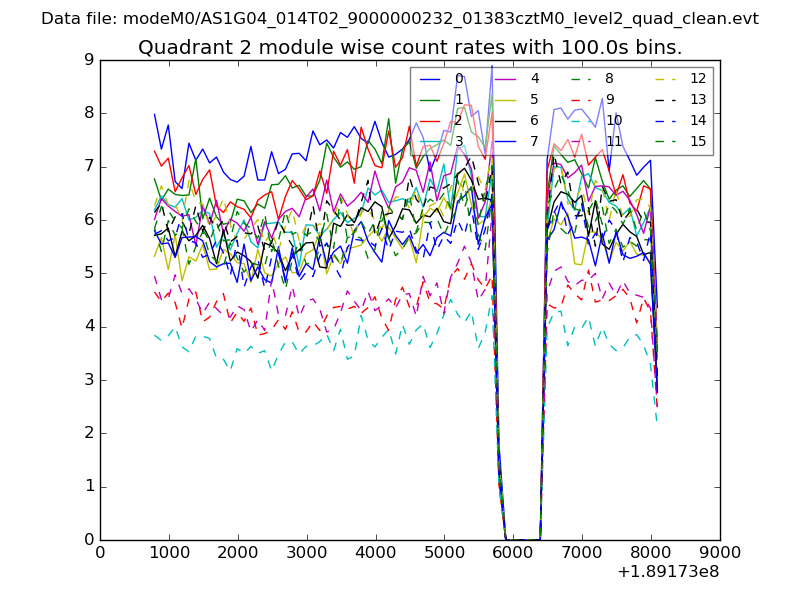
| Module-wise count rates for Quadrant B Data is divided into 100 sec bins |
 |
 |
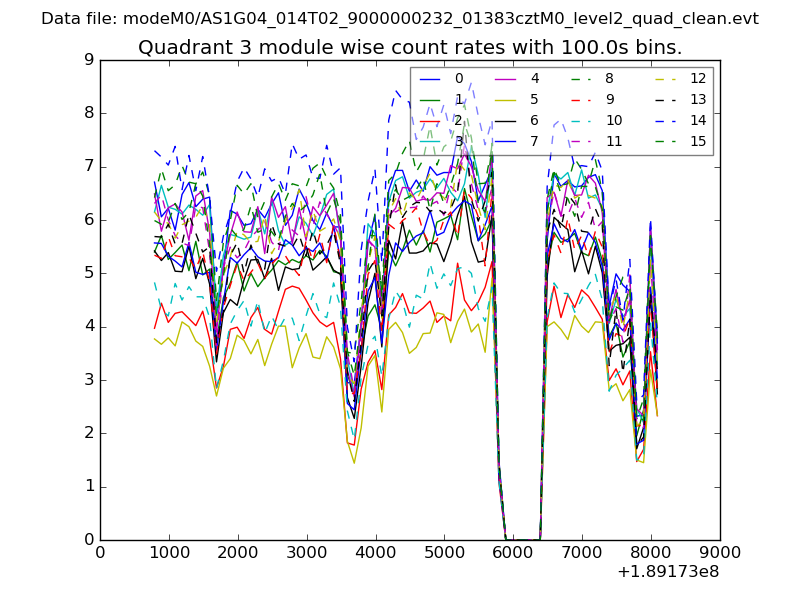
| Module-wise count rates for Quadrant C Data is divided into 100 sec bins |
 |
 |
| Module-wise count rates for Quadrant D Data is divided into 100 sec bins |
 |
 |
| Parameter | Plot |
|---|---|
| CZT HV Monitor | 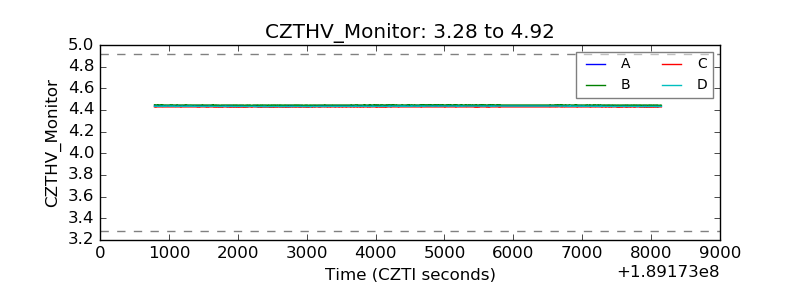 |
| D_VDD | 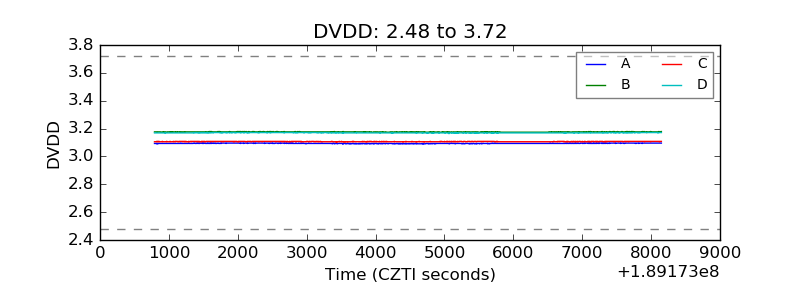 |
| Temperature 1 | 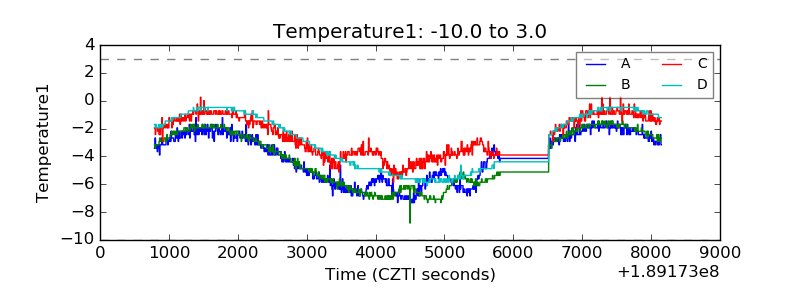 |
| Veto HV Monitor | 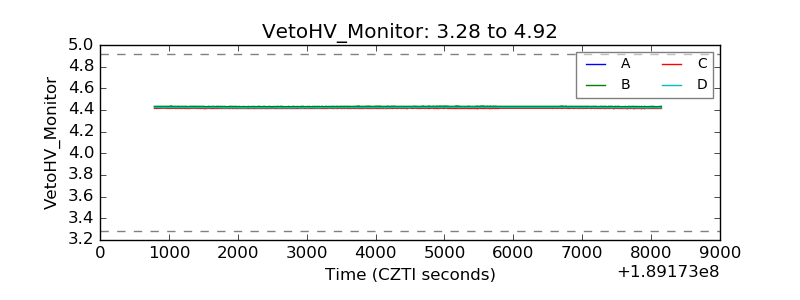 |
| Veto LLD | 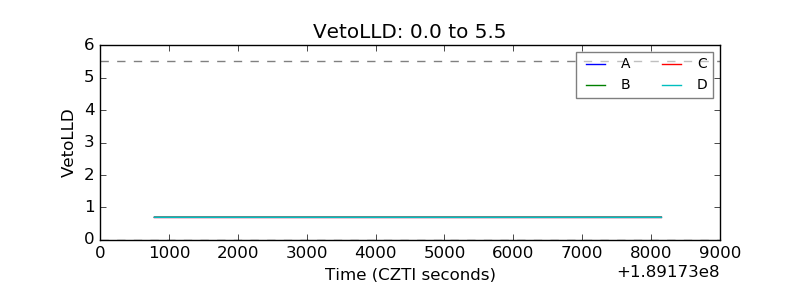 |
| Alpha Counter | 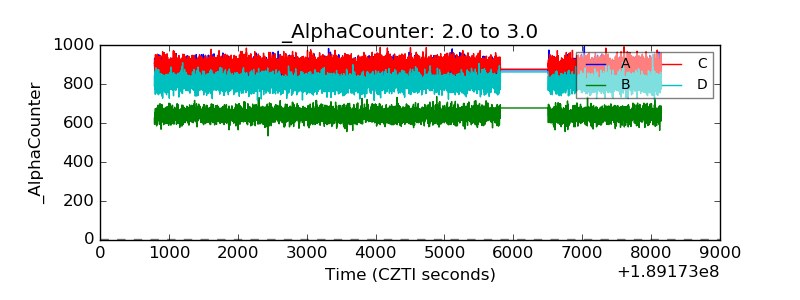 |
| _CPM_Rate | 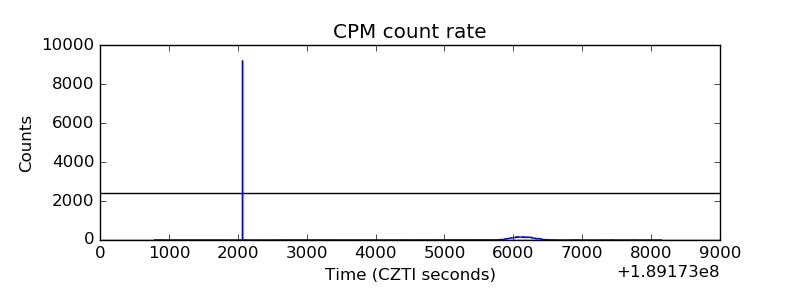 |
| CZT Counter | 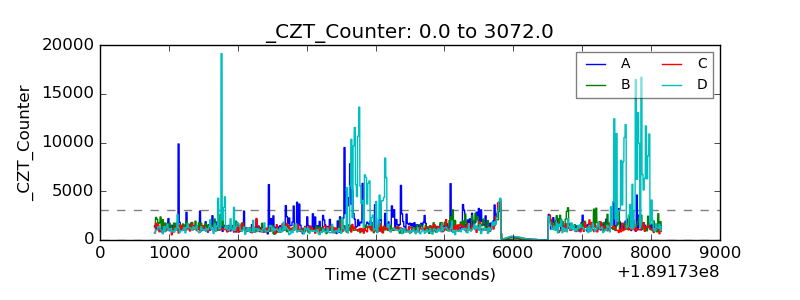 |
| +2.5 Volts monitor | 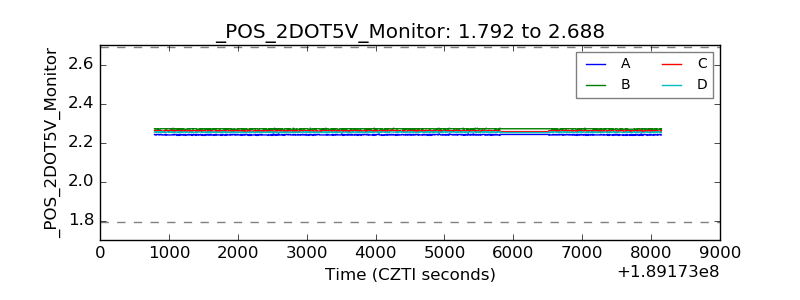 |
| +5 Volts monitor | 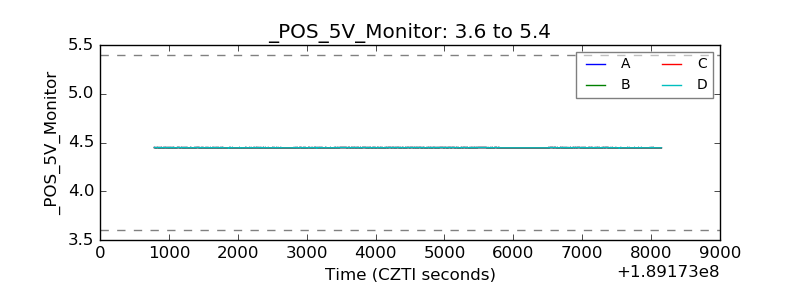 |
| _ROLL_ROT | 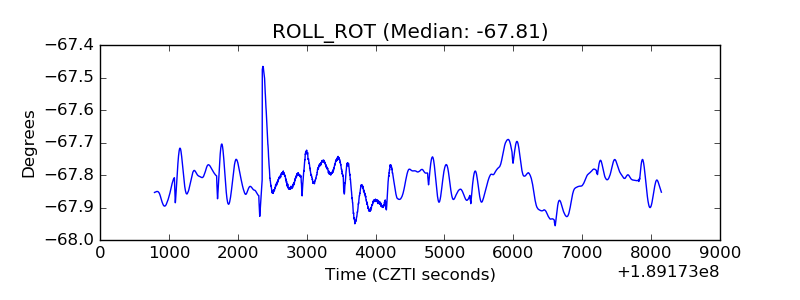 |
| _Roll_DEC | 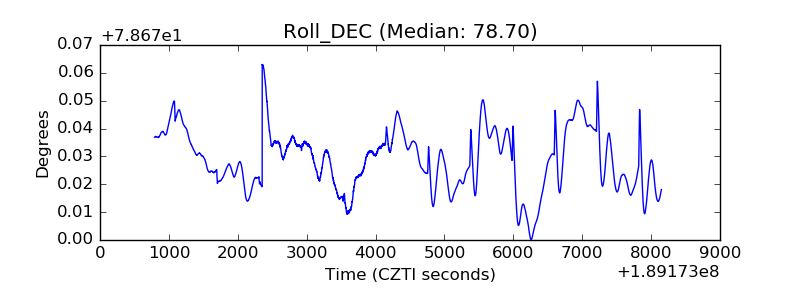 |
| _Roll_RA | 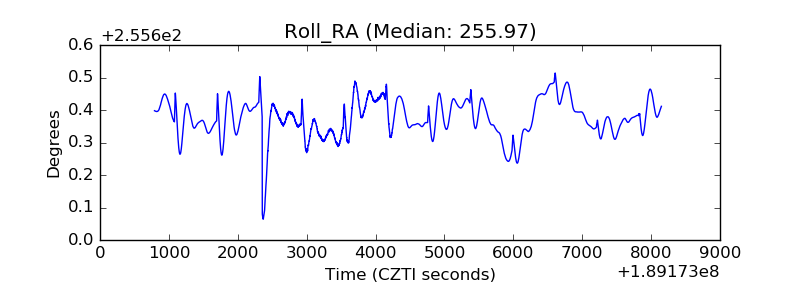 |
| Veto Counter | 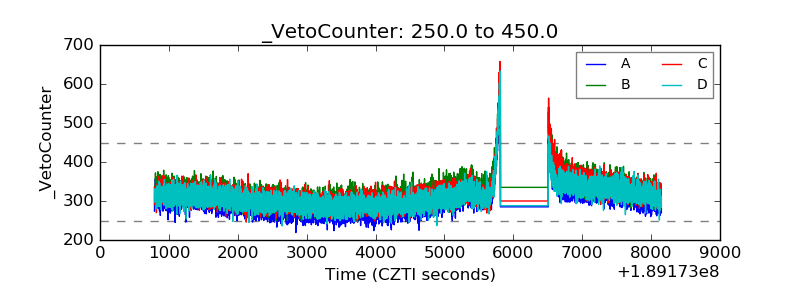 |