| Param | Original file | Final file |
|---|---|---|
| Filename | modeM0/AS1G04_014T02_9000000232_01386cztM0_level2.evt | modeM0/AS1G04_014T02_9000000232_01386cztM0_level2_quad_clean.evt |
| Size (bytes) | 1,172,574,720 | 96,552,000 |
| Size | 1.1 GB | 92.1 MB |
| Events in quadrant A | 11,166,930 | 596,655 |
| Events in quadrant B | 8,085,622 | 648,724 |
| Events in quadrant C | 7,665,551 | 629,062 |
| Events in quadrant D | 8,166,159 | 598,106 |
| Mode SS | |||
|---|---|---|---|
| Quadrant | BADHDUFLAG | Total packets | Discarded packets |
| A | 0 | 132 | 0 |
| B | 0 | 132 | 0 |
| C | 0 | 132 | 0 |
| D | 0 | 132 | 0 |
| Mode M0 | |||
|---|---|---|---|
| Quadrant | BADHDUFLAG | Total packets | Discarded packets |
| A | 0 | 37882 | 2 |
| B | 0 | 28616 | 1 |
| C | 0 | 27361 | 1 |
| D | 0 | 28929 | 1 |
| Mode M9 | |||
|---|---|---|---|
| Quadrant | BADHDUFLAG | Total packets | Discarded packets |
| A | 0 | 10 | 0 |
| B | 0 | 10 | 0 |
| C | 0 | 10 | 0 |
| D | 0 | 10 | 0 |
| Quadrant | Total seconds | Saturated seconds | Saturation percentage |
|---|---|---|---|
| A | 6460 | 853 | 13.204334% |
| B | 6460 | 23 | 0.356037% |
| C | 6460 | 13 | 0.201238% |
| D | 6460 | 397 | 6.145511% |
Noise dominated data is calculated using 1-second bins in cleaned event files. If a bin has >2000 counts, and if more than 50% of those come from <1% of pixels, then it is considered to be noise-dominated and hence unusable.
| Quadrant | # 1 sec bins | Bins with >0 counts | Bins with >2000 counts | High rate bins dominated by noise | Noise dominated (total time) | Noise dominated (detector-on time) | Marked lightcurve |
|---|---|---|---|---|---|---|---|
| A | 7504 | 6460 | 1959 | 1959 | 26.11% | 30.33% | 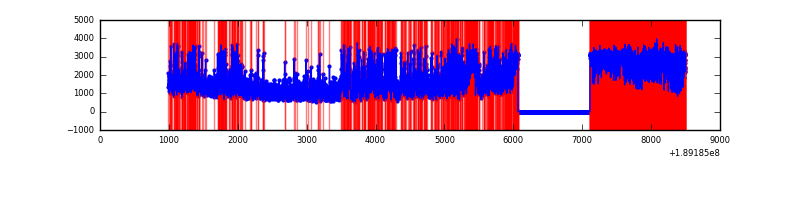 |
| B | 7505 | 6460 | 215 | 215 | 2.86% | 3.33% | 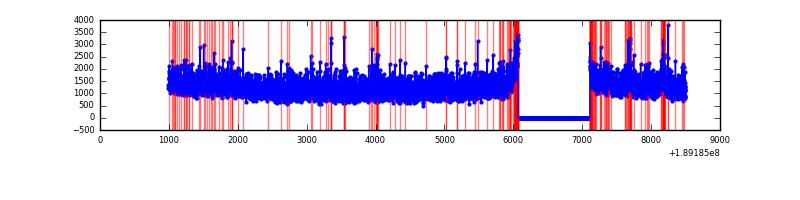 |
| C | 7505 | 6460 | 148 | 148 | 1.97% | 2.29% | 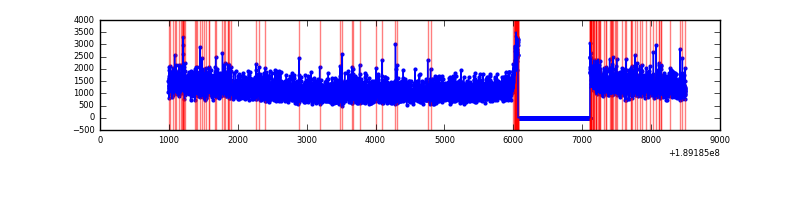 |
| D | 7505 | 6460 | 665 | 665 | 8.86% | 10.29% | 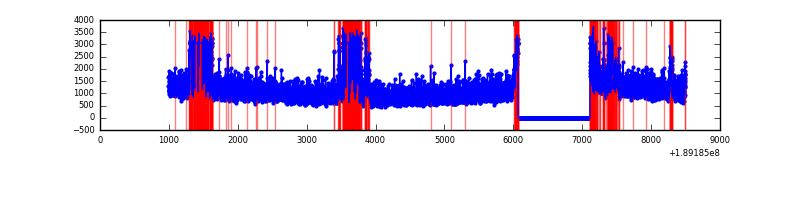 |
Top three noisy pixels from each quadrant. If the there are fewer than three noisy pixels in the level2.evt file, extra rows are filled as -1
| Pixel properties | Quadrant properties | ||||||
|---|---|---|---|---|---|---|---|
| Quadrant | DetID | PixID | Counts | Sigma | Mean | Median | Sigma |
| A | 15 | 127 | 3915168 | 8778.87 | 1871 | 1889 | 445.8 |
| A | 3 | 80 | 41699 | 89.31 | 1871 | 1889 | 445.8 |
| A | 13 | 17 | 18859 | 38.07 | 1871 | 1889 | 445.8 |
| B | 6 | 53 | 98187 | 199.76 | 2045 | 2051 | 481.3 |
| B | 5 | 249 | 43954 | 87.07 | 2045 | 2051 | 481.3 |
| B | 15 | 22 | 38507 | 75.75 | 2045 | 2051 | 481.3 |
| C | 15 | 241 | 172663 | 323.66 | 1901 | 1967 | 527.4 |
| C | 3 | 79 | 24607 | 42.93 | 1901 | 1967 | 527.4 |
| C | 3 | 111 | 23700 | 41.21 | 1901 | 1967 | 527.4 |
| D | 13 | 73 | 1354304 | 2449.61 | 1785 | 1852 | 552.1 |
| D | 2 | 16 | 39821 | 68.77 | 1785 | 1852 | 552.1 |
| D | 2 | 88 | 25170 | 42.23 | 1785 | 1852 | 552.1 |
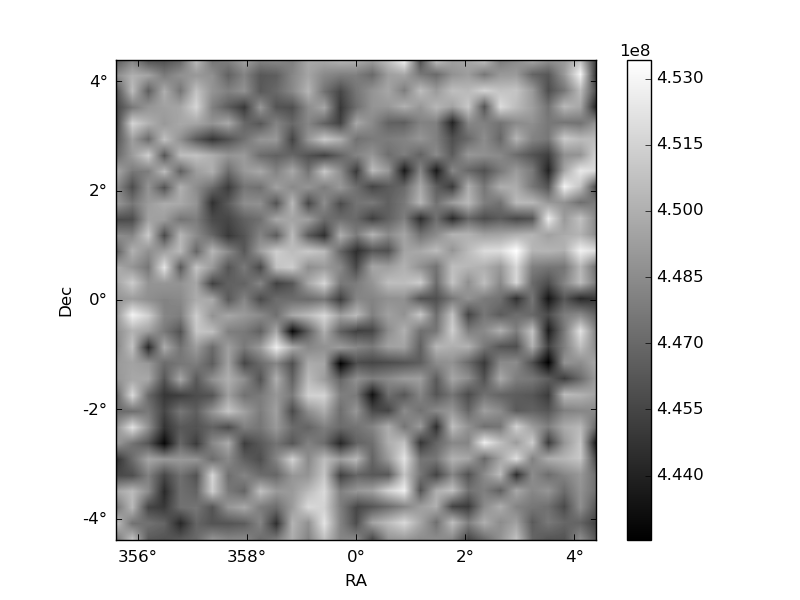
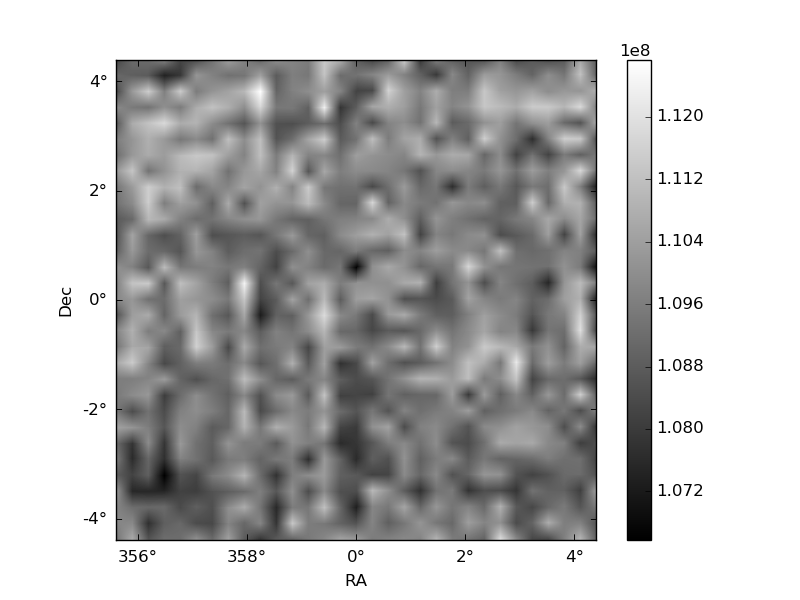
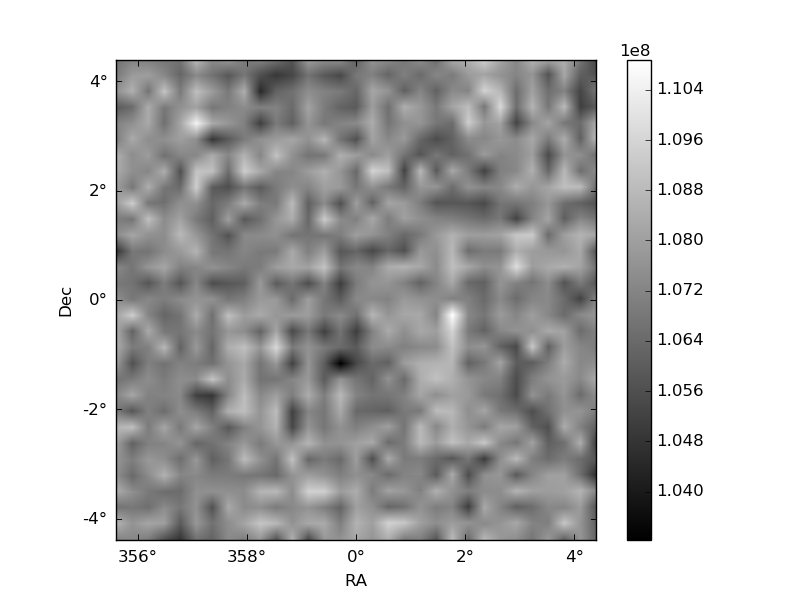
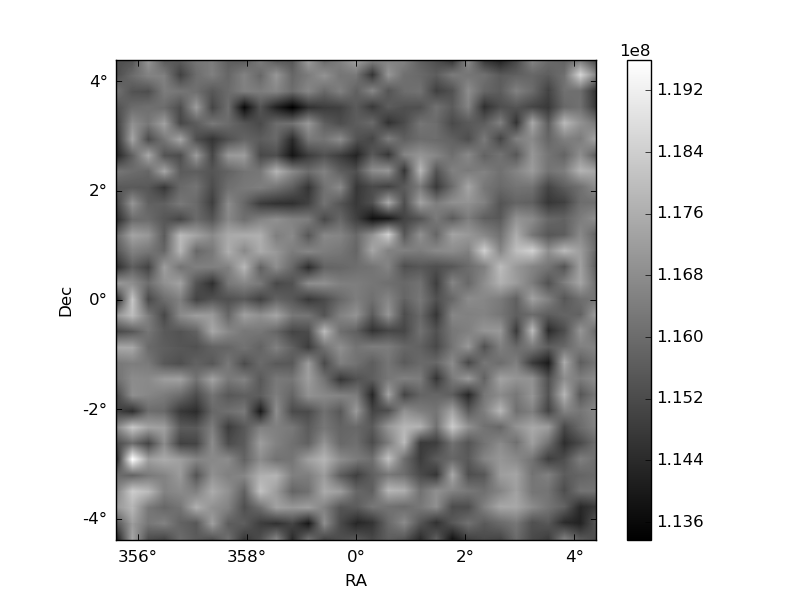
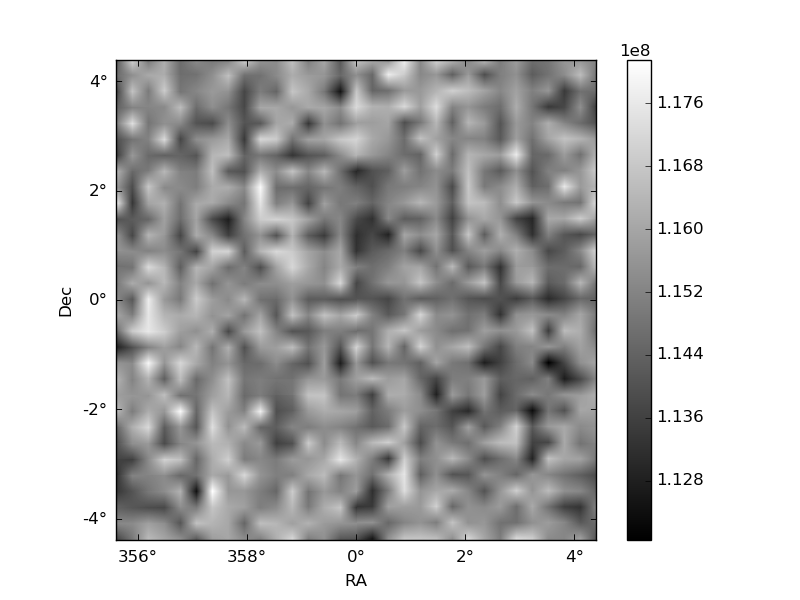
Histogram calculated using DETX and DETY for each event in the final _common_clean file
| Quadrant A | 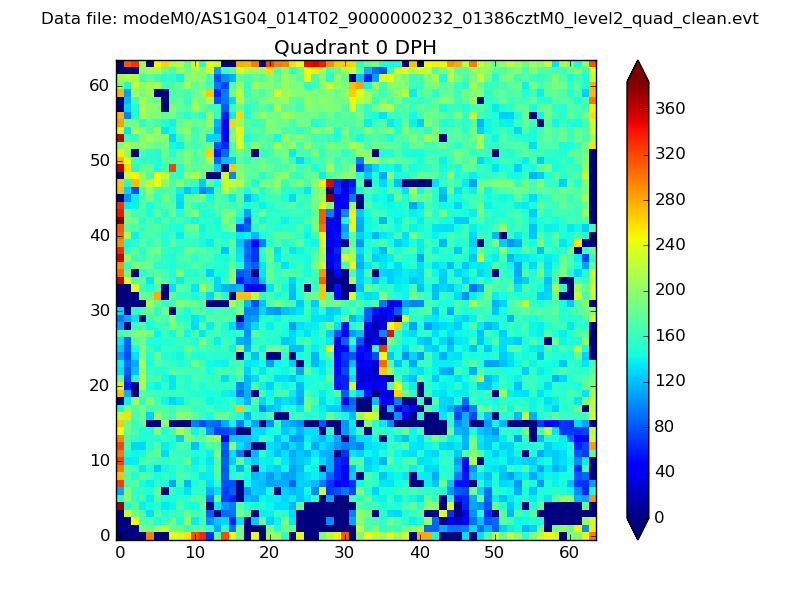 |
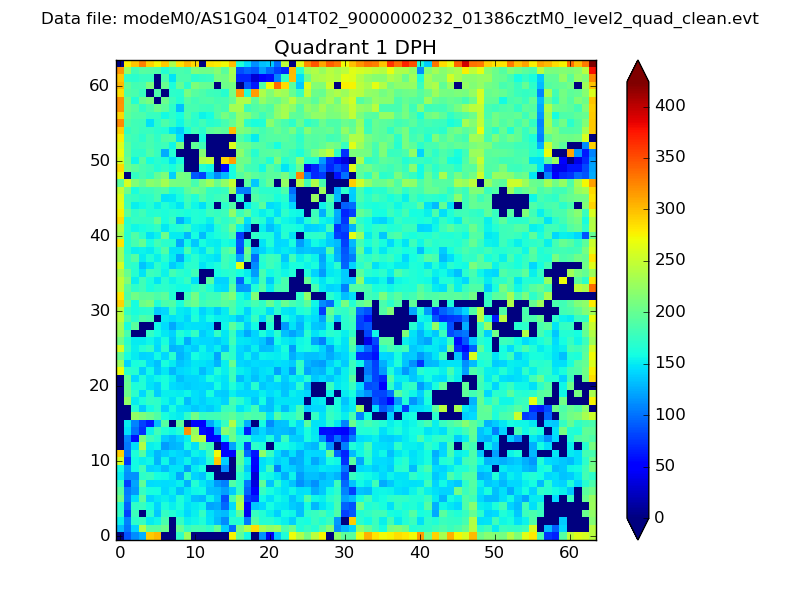 |
Quadrant B |
|---|---|---|---|
| Quadrant D | 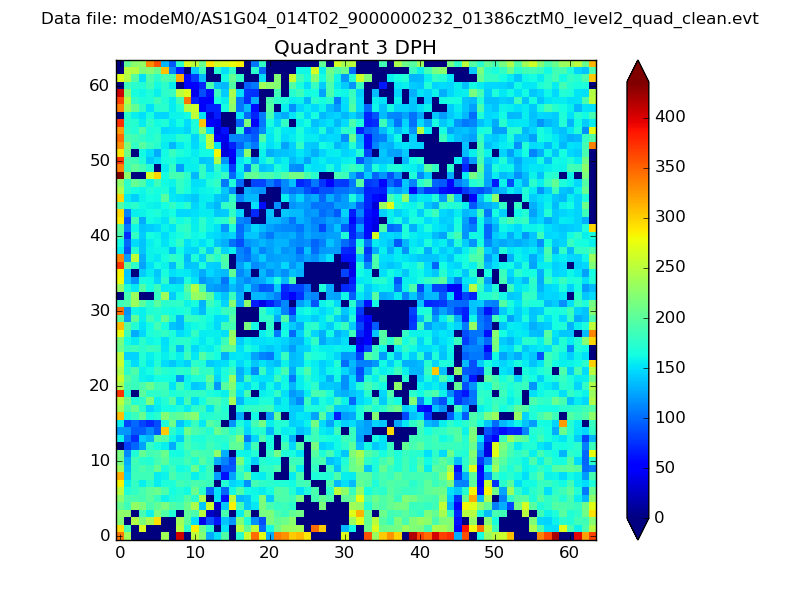 |
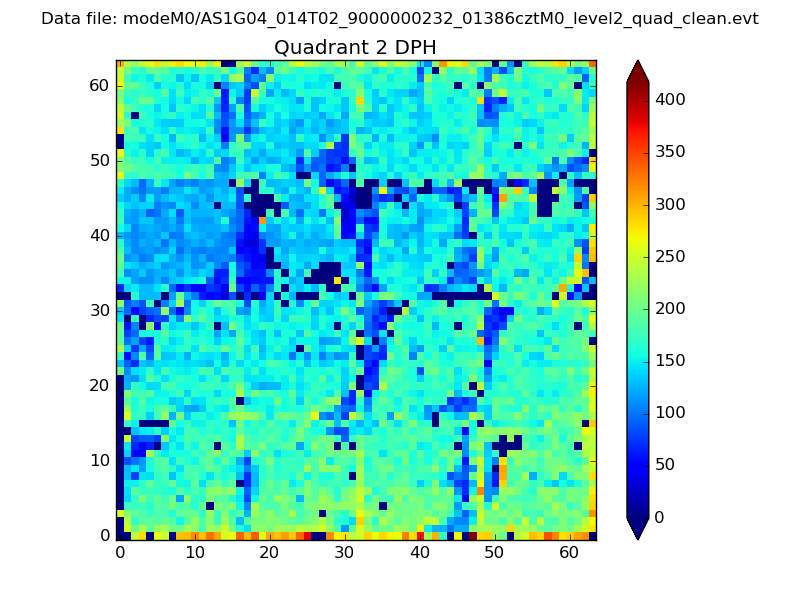 |
Quadrant C |
| Plot type | Count rate plots | Images |
|---|---|---|
| Comparison with Poisson distribution Blue bars denote a histogram of data divided into 1 sec bins. Red curve is a Poisson curve with rate = median count rate of data. |
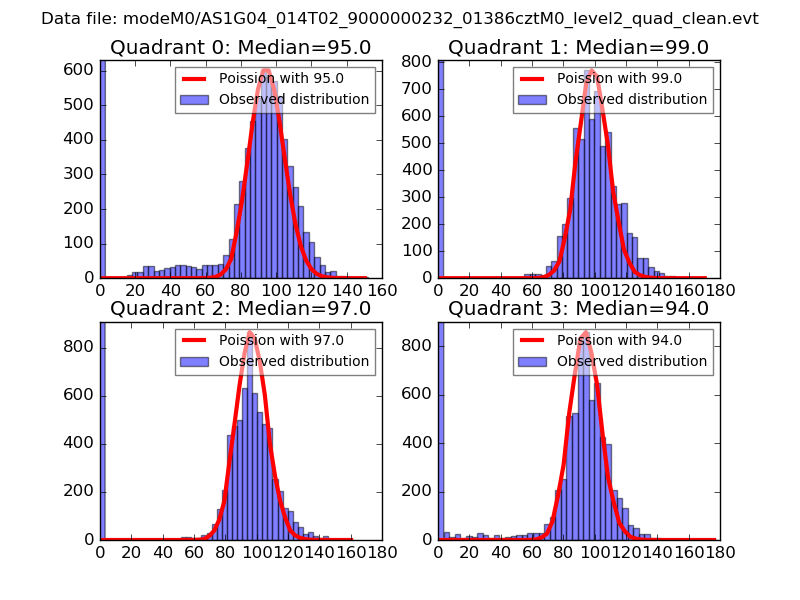 |
 |
| Quadrant-wise count rates Data is divided into 100 sec bins |
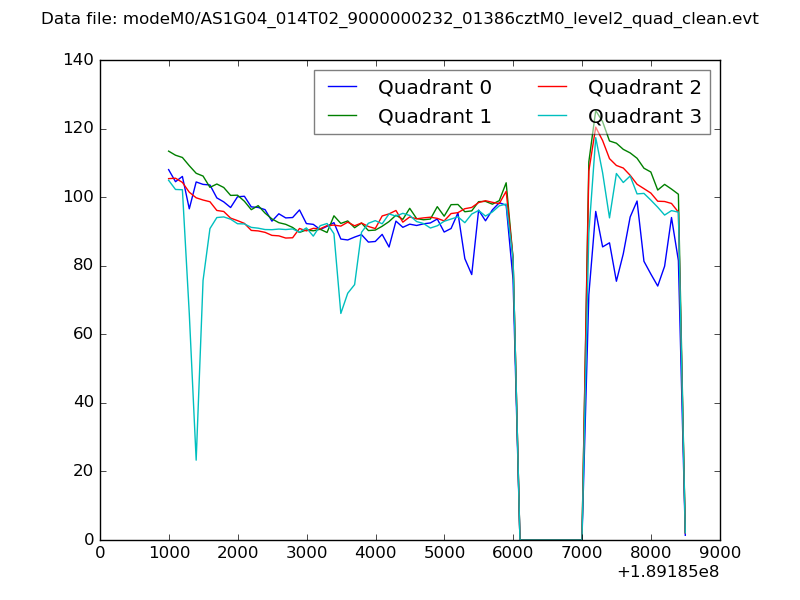 |
|
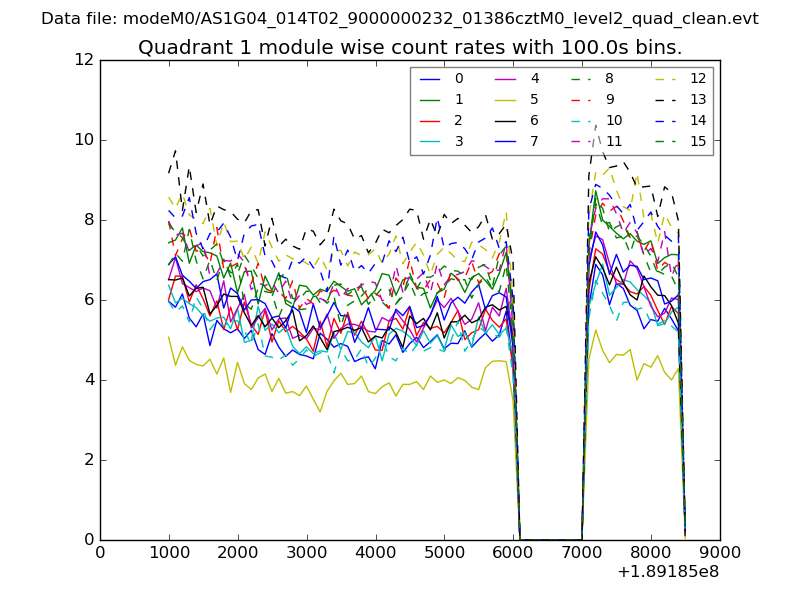
| Module-wise count rates for Quadrant A Data is divided into 100 sec bins |
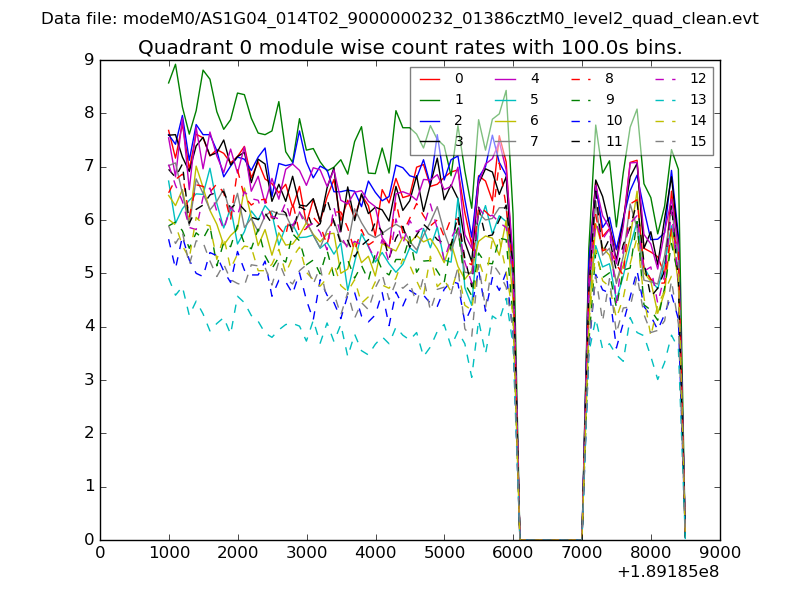 |
 |
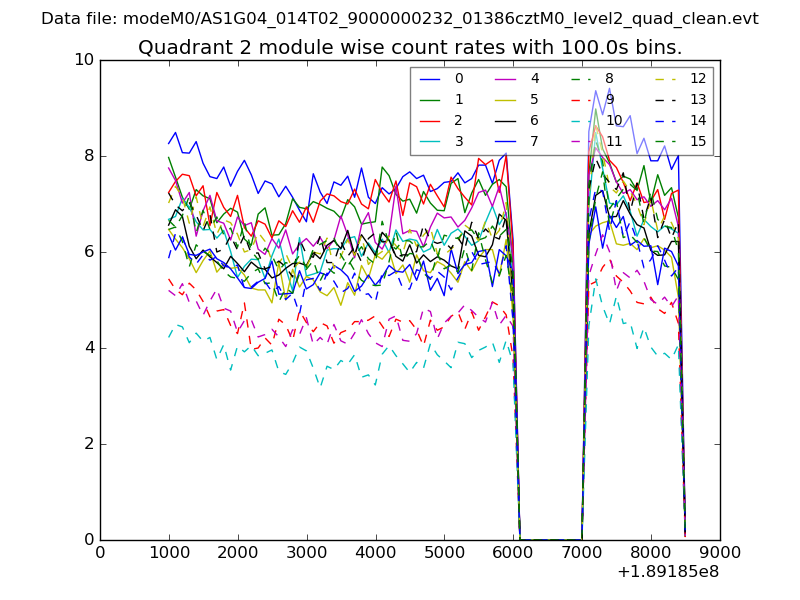
| Module-wise count rates for Quadrant B Data is divided into 100 sec bins |
 |
 |
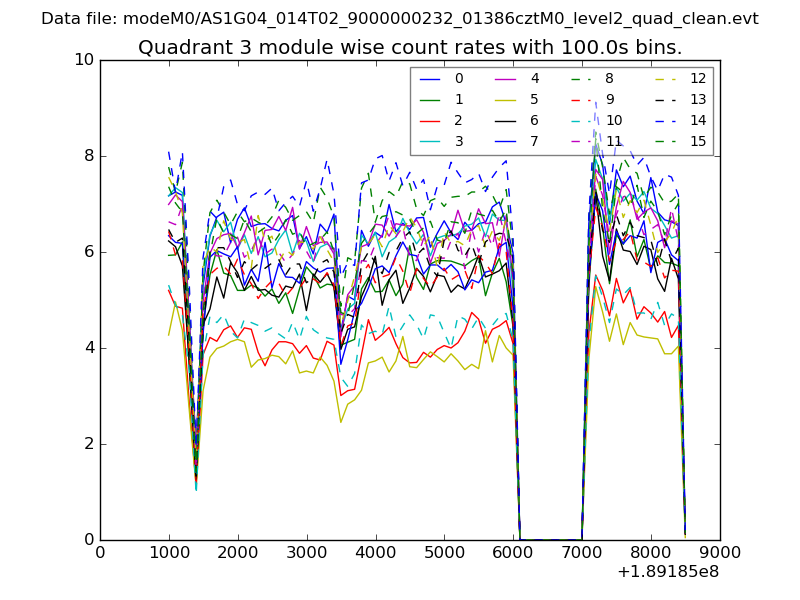
| Module-wise count rates for Quadrant C Data is divided into 100 sec bins |
 |
 |
| Module-wise count rates for Quadrant D Data is divided into 100 sec bins |
 |
 |
| Parameter | Plot |
|---|---|
| CZT HV Monitor | 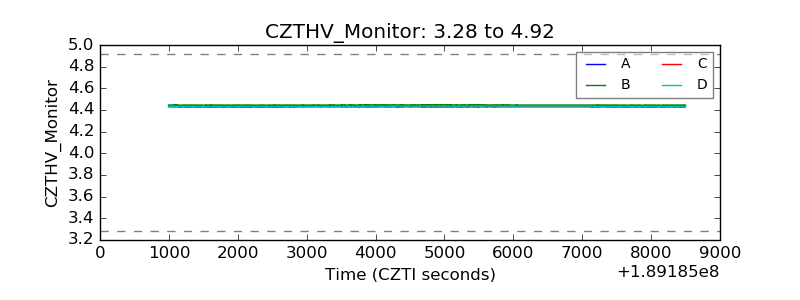 |
| D_VDD | 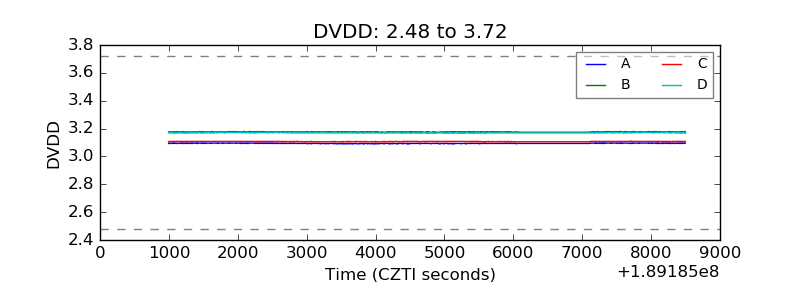 |
| Temperature 1 | 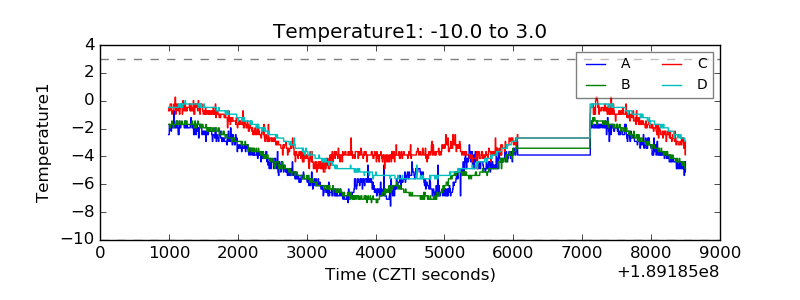 |
| Veto HV Monitor | 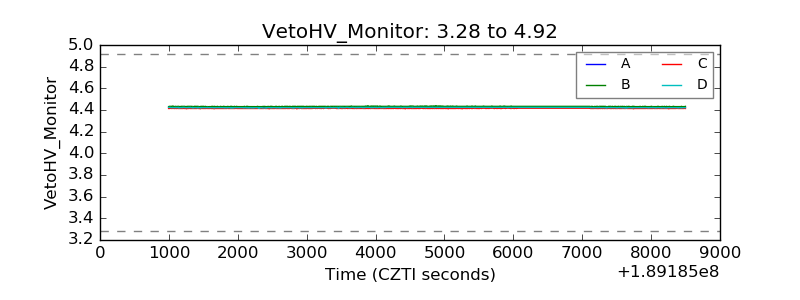 |
| Veto LLD | 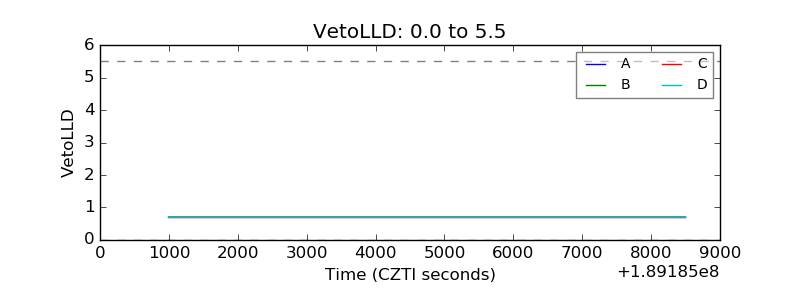 |
| Alpha Counter | 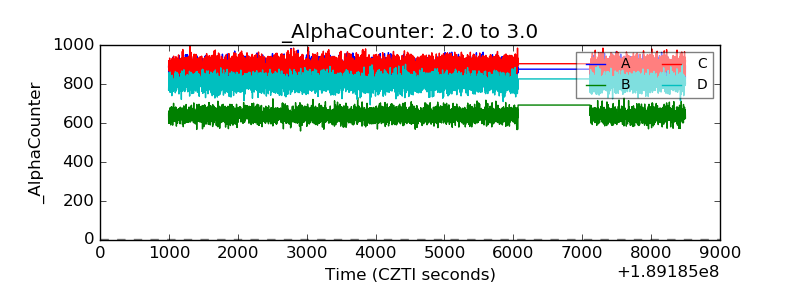 |
| _CPM_Rate | 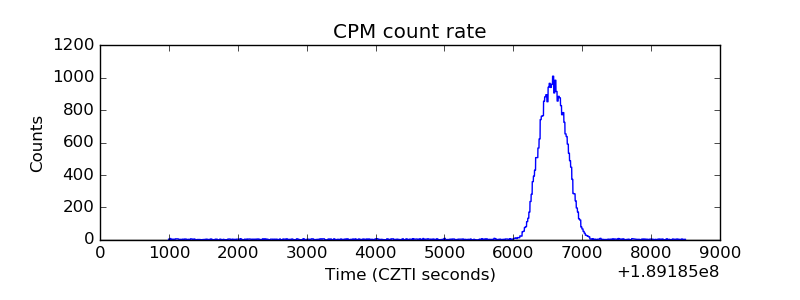 |
| CZT Counter | 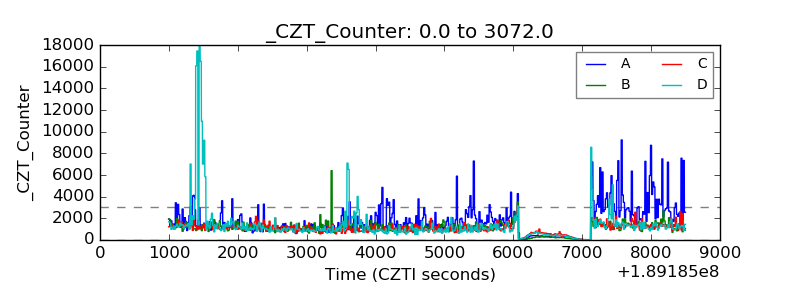 |
| +2.5 Volts monitor |  |
| +5 Volts monitor |  |
| _ROLL_ROT | 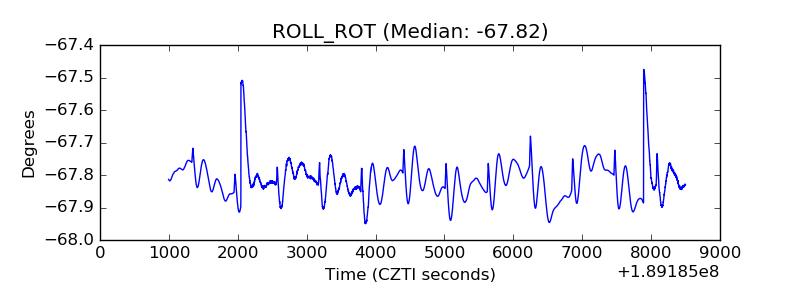 |
| _Roll_DEC | 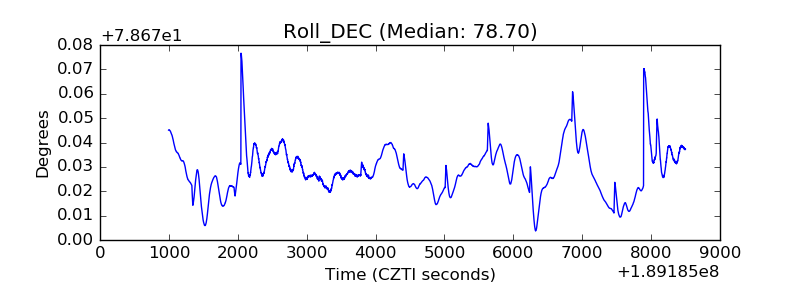 |
| _Roll_RA | 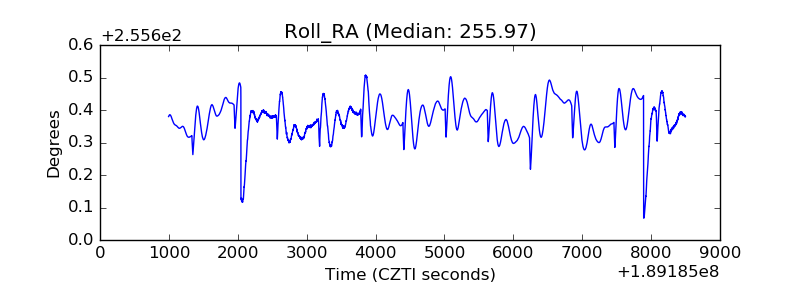 |
| Veto Counter | 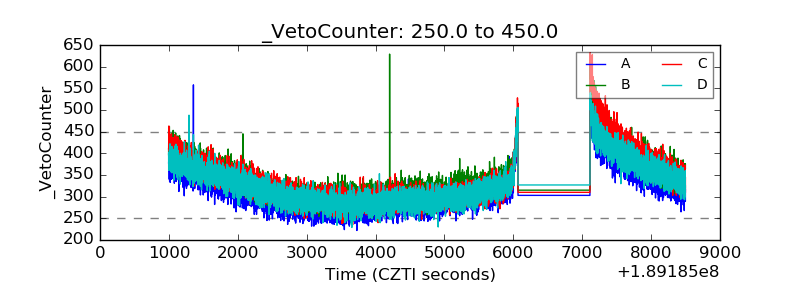 |