| Param | Original file | Final file |
|---|---|---|
| Filename | modeM0/AS1G04_014T02_9000000232_01387cztM0_level2.evt | modeM0/AS1G04_014T02_9000000232_01387cztM0_level2_quad_clean.evt |
| Size (bytes) | 1,172,802,240 | 90,757,440 |
| Size | 1.1 GB | 86.6 MB |
| Events in quadrant A | 12,482,216 | 524,260 |
| Events in quadrant B | 8,016,904 | 613,603 |
| Events in quadrant C | 7,076,183 | 607,899 |
| Events in quadrant D | 7,546,224 | 582,091 |
| Mode SS | |||
|---|---|---|---|
| Quadrant | BADHDUFLAG | Total packets | Discarded packets |
| A | 0 | 122 | 0 |
| B | 0 | 122 | 0 |
| C | 0 | 122 | 0 |
| D | 0 | 122 | 0 |
| Mode M0 | |||
|---|---|---|---|
| Quadrant | BADHDUFLAG | Total packets | Discarded packets |
| A | 0 | 41550 | 2 |
| B | 0 | 28069 | 1 |
| C | 0 | 25245 | 1 |
| D | 0 | 26756 | 1 |
| Mode M9 | |||
|---|---|---|---|
| Quadrant | BADHDUFLAG | Total packets | Discarded packets |
| A | 0 | 12 | 0 |
| B | 0 | 12 | 0 |
| C | 0 | 12 | 0 |
| D | 0 | 12 | 0 |
| Quadrant | Total seconds | Saturated seconds | Saturation percentage |
|---|---|---|---|
| A | 6011 | 1629 | 27.100316% |
| B | 6011 | 101 | 1.680253% |
| C | 6011 | 18 | 0.299451% |
| D | 6011 | 256 | 4.258859% |
Noise dominated data is calculated using 1-second bins in cleaned event files. If a bin has >2000 counts, and if more than 50% of those come from <1% of pixels, then it is considered to be noise-dominated and hence unusable.
| Quadrant | # 1 sec bins | Bins with >0 counts | Bins with >2000 counts | High rate bins dominated by noise | Noise dominated (total time) | Noise dominated (detector-on time) | Marked lightcurve |
|---|---|---|---|---|---|---|---|
| A | 7156 | 6011 | 2878 | 2878 | 40.22% | 47.88% | 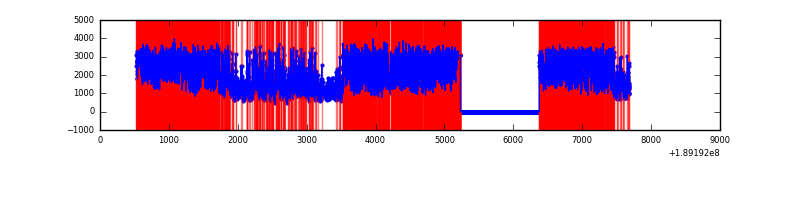 |
| B | 7156 | 6012 | 538 | 538 | 7.52% | 8.95% | 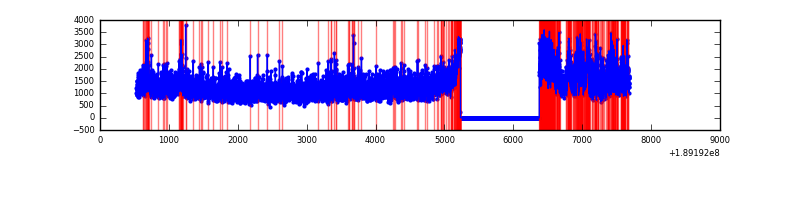 |
| C | 7156 | 6011 | 156 | 156 | 2.18% | 2.60% | 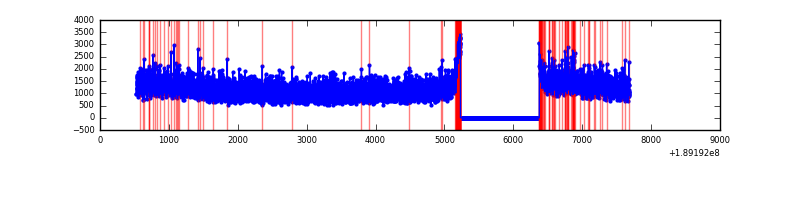 |
| D | 7156 | 6011 | 563 | 563 | 7.87% | 9.37% | 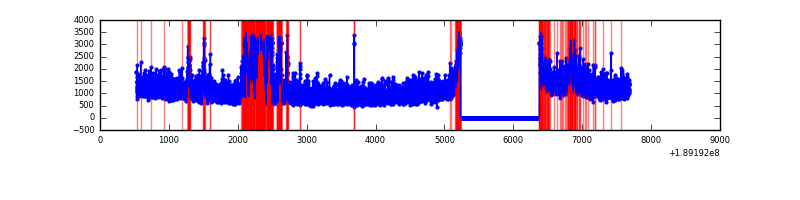 |
Top three noisy pixels from each quadrant. If the there are fewer than three noisy pixels in the level2.evt file, extra rows are filled as -1
| Pixel properties | Quadrant properties | ||||||
|---|---|---|---|---|---|---|---|
| Quadrant | DetID | PixID | Counts | Sigma | Mean | Median | Sigma |
| A | 15 | 127 | 6196288 | 16087.32 | 1612 | 1622 | 385.1 |
| A | 3 | 80 | 89564 | 228.38 | 1612 | 1622 | 385.1 |
| A | 4 | 32 | 6967 | 13.88 | 1612 | 1622 | 385.1 |
| B | 8 | 4 | 662947 | 1496.25 | 1889 | 1898 | 441.8 |
| B | 15 | 22 | 74496 | 164.32 | 1889 | 1898 | 441.8 |
| B | 5 | 249 | 46701 | 101.41 | 1889 | 1898 | 441.8 |
| C | 15 | 241 | 135397 | 273.98 | 1757 | 1822 | 487.5 |
| C | 12 | 4 | 30501 | 58.83 | 1757 | 1822 | 487.5 |
| C | 3 | 111 | 21336 | 40.03 | 1757 | 1822 | 487.5 |
| D | 13 | 73 | 925496 | 1812.39 | 1657 | 1717 | 509.7 |
| D | 2 | 16 | 204657 | 398.15 | 1657 | 1717 | 509.7 |
| D | 9 | 53 | 76926 | 147.55 | 1657 | 1717 | 509.7 |
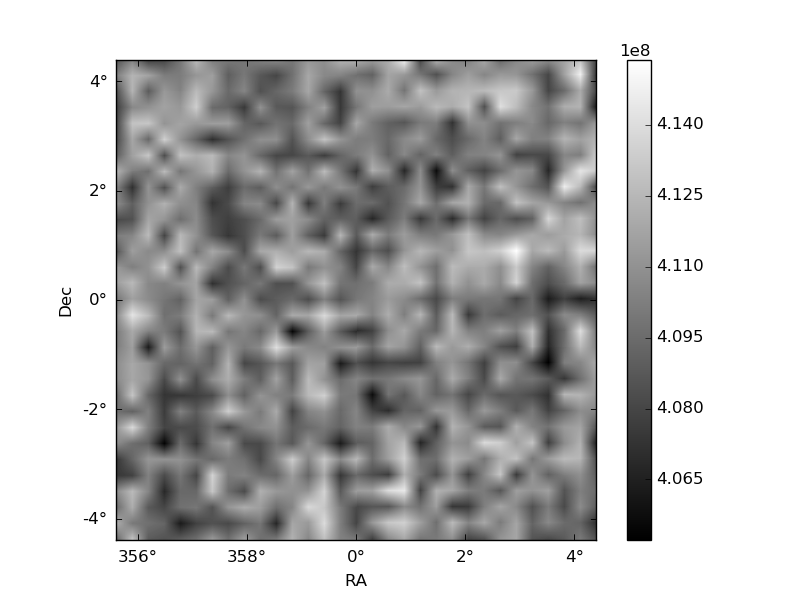
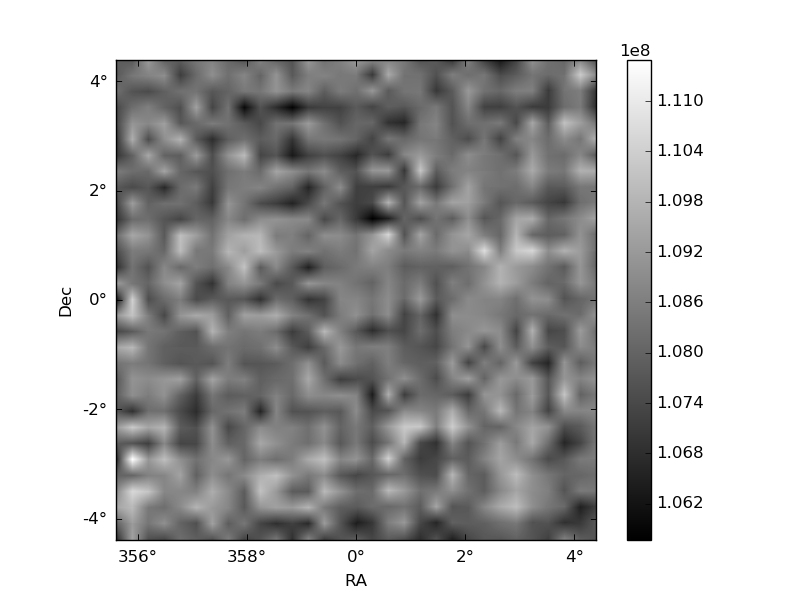
Histogram calculated using DETX and DETY for each event in the final _common_clean file
| Quadrant A | 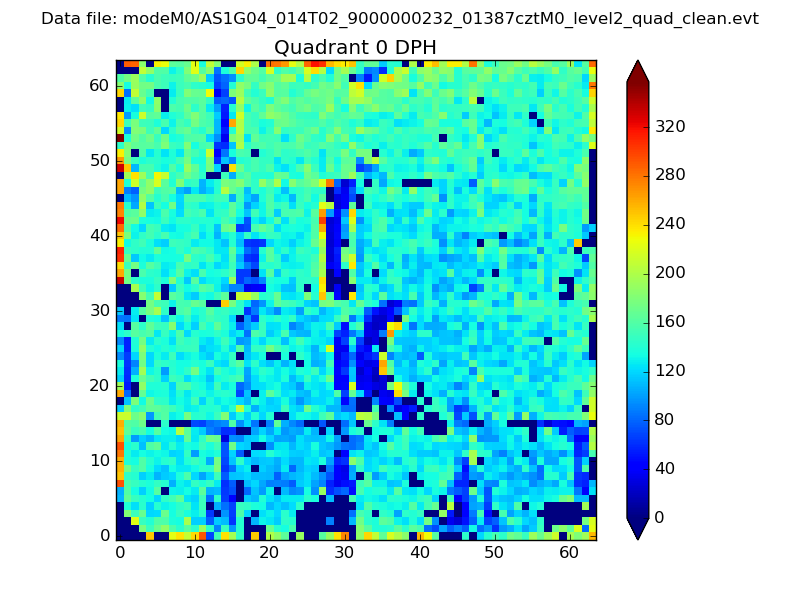 |
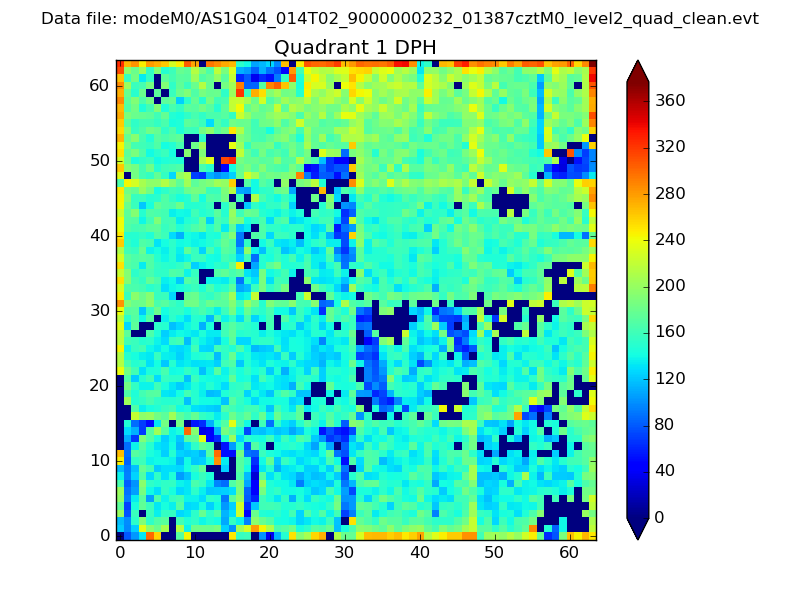 |
Quadrant B |
|---|---|---|---|
| Quadrant D | 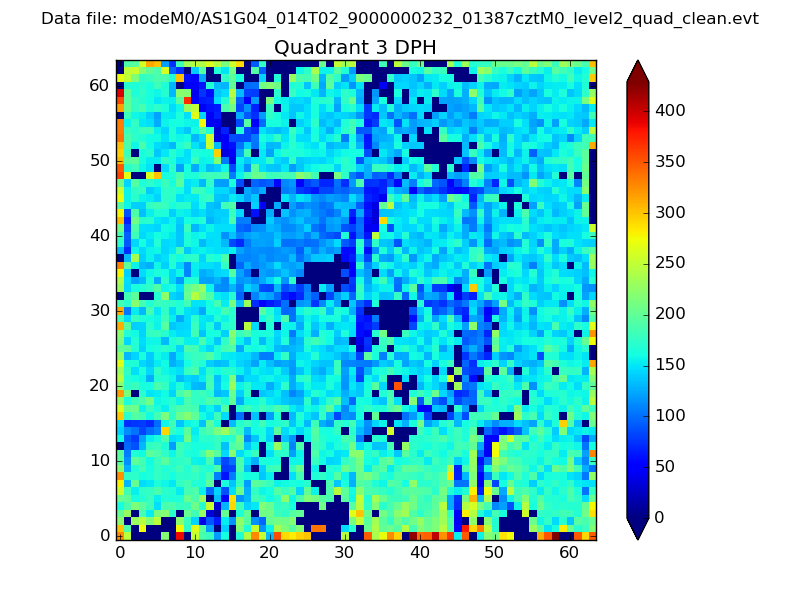 |
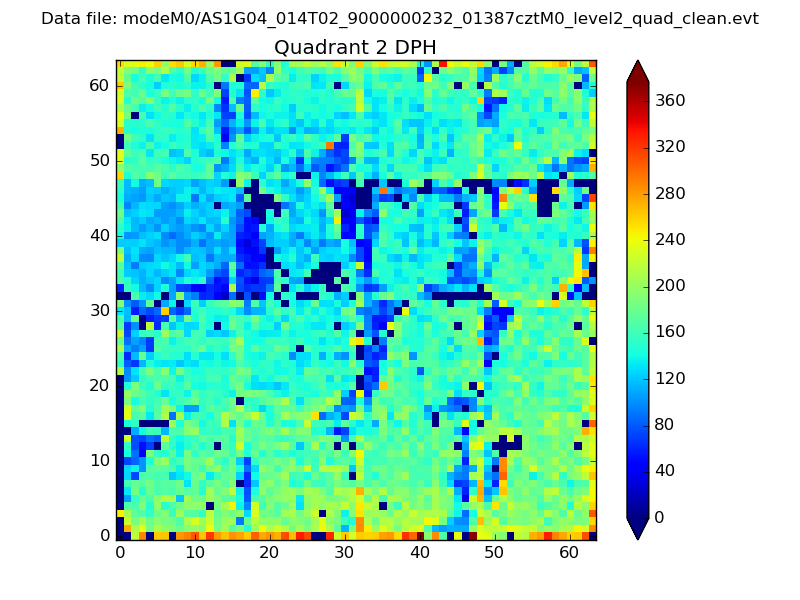 |
Quadrant C |
| Plot type | Count rate plots | Images |
|---|---|---|
| Comparison with Poisson distribution Blue bars denote a histogram of data divided into 1 sec bins. Red curve is a Poisson curve with rate = median count rate of data. |
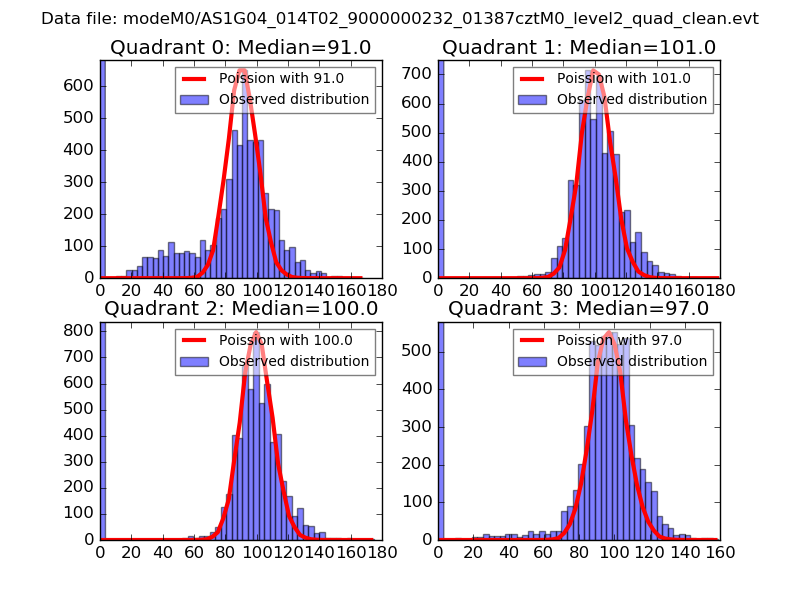 |
 |
| Quadrant-wise count rates Data is divided into 100 sec bins |
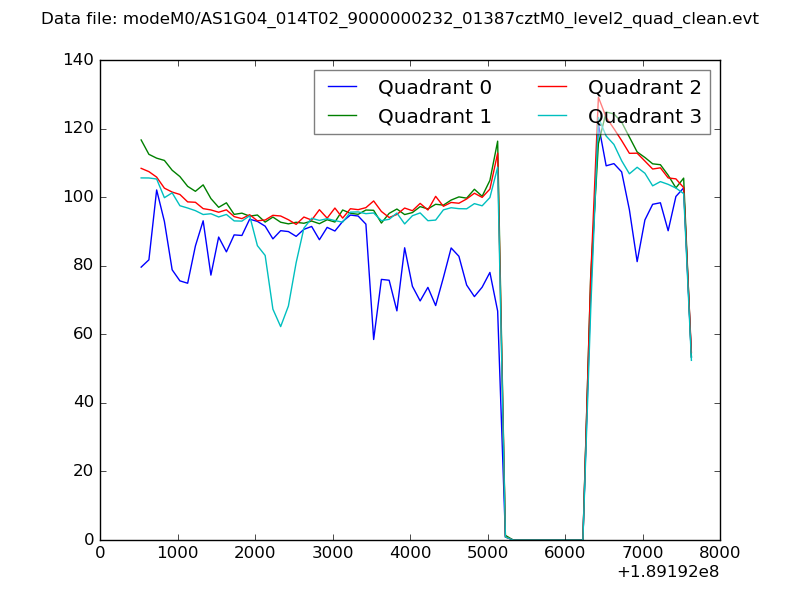 |
|
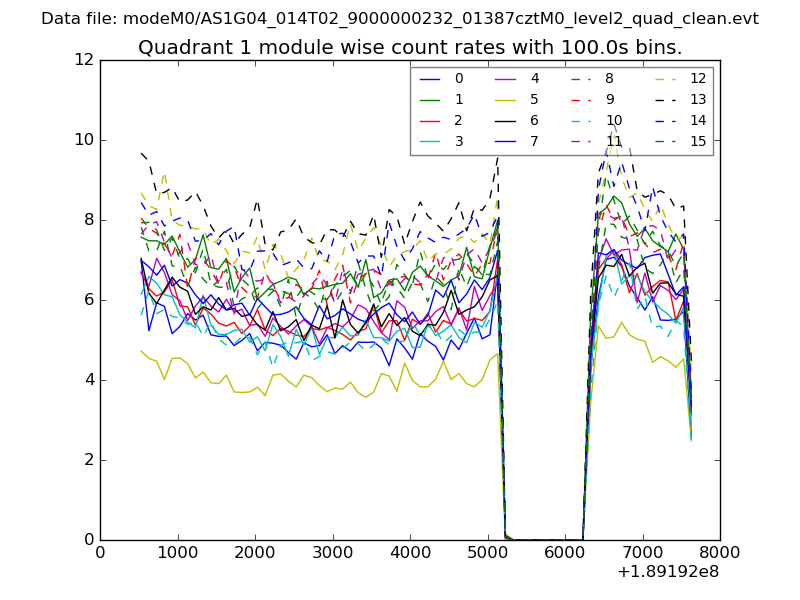
| Module-wise count rates for Quadrant A Data is divided into 100 sec bins |
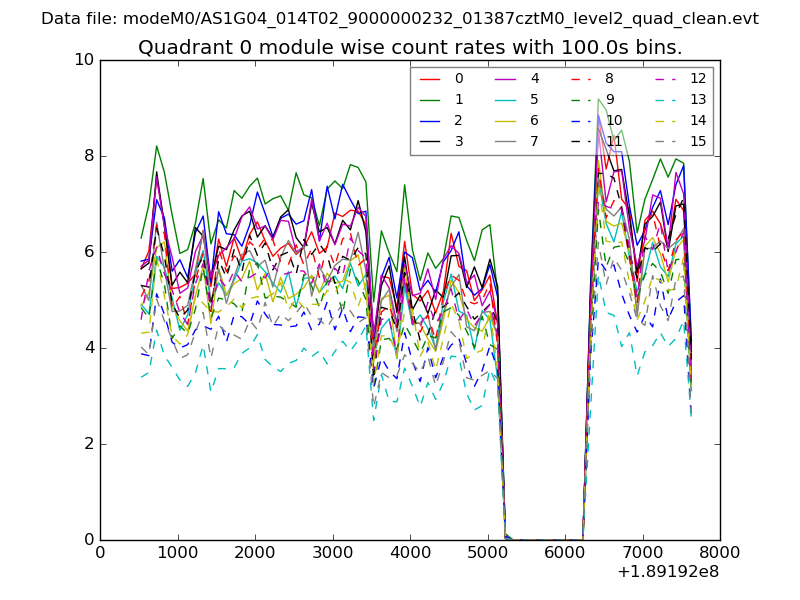 |
 |
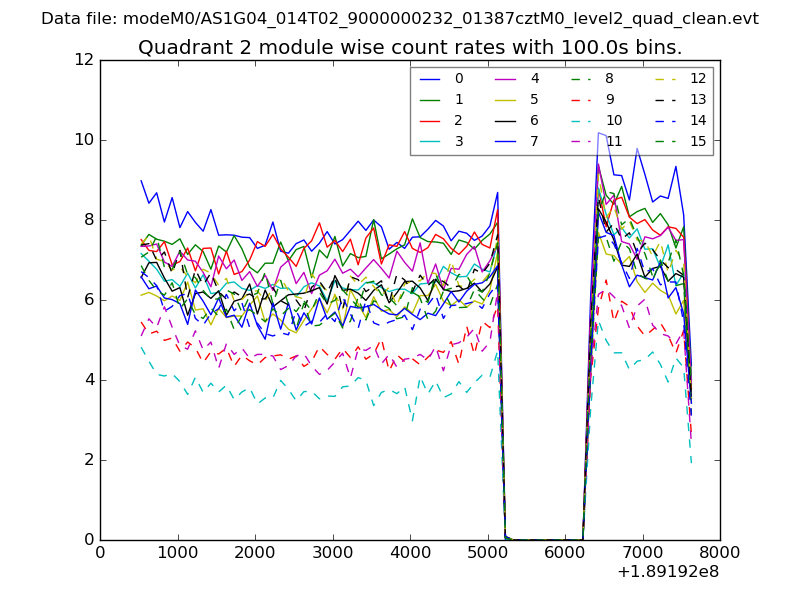
| Module-wise count rates for Quadrant B Data is divided into 100 sec bins |
 |
 |
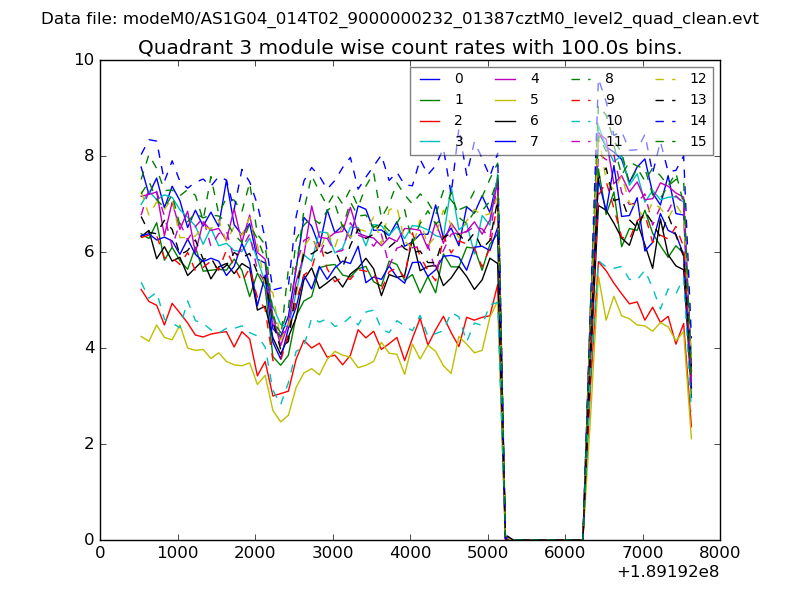
| Module-wise count rates for Quadrant C Data is divided into 100 sec bins |
 |
 |
| Module-wise count rates for Quadrant D Data is divided into 100 sec bins |
 |
 |
| Parameter | Plot |
|---|---|
| CZT HV Monitor | 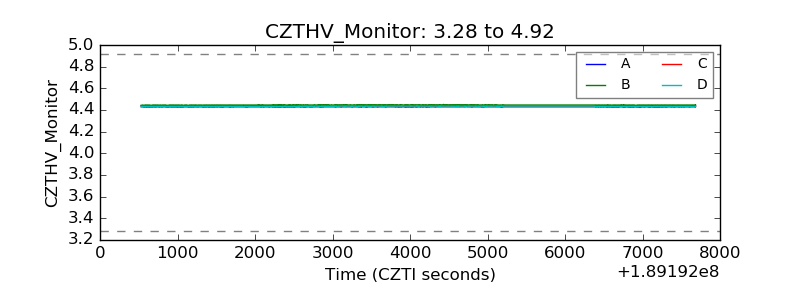 |
| D_VDD | 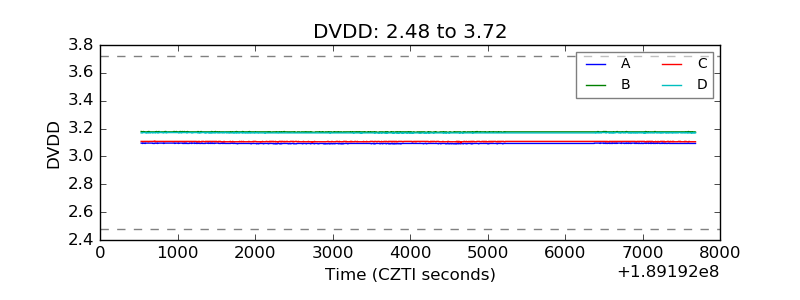 |
| Temperature 1 | 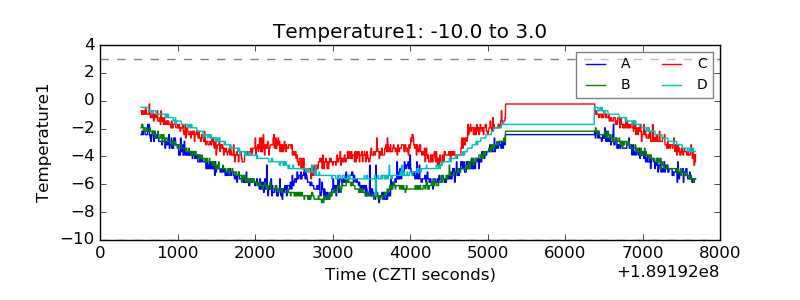 |
| Veto HV Monitor | 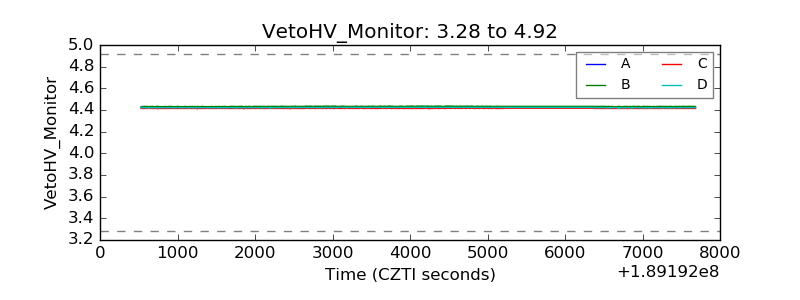 |
| Veto LLD | 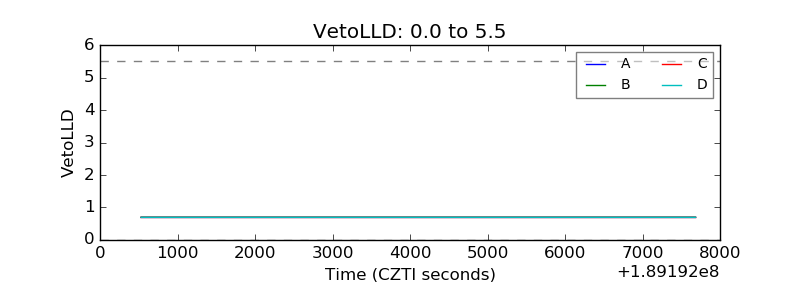 |
| Alpha Counter | 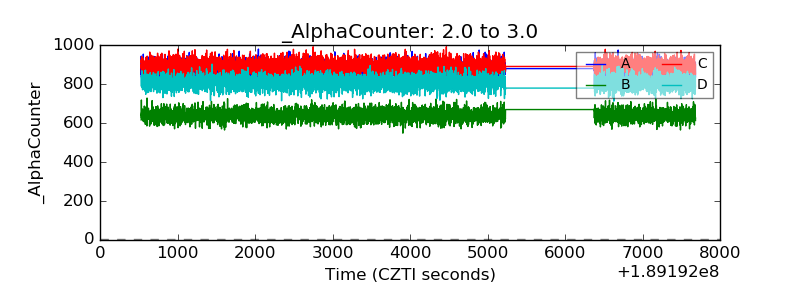 |
| _CPM_Rate | 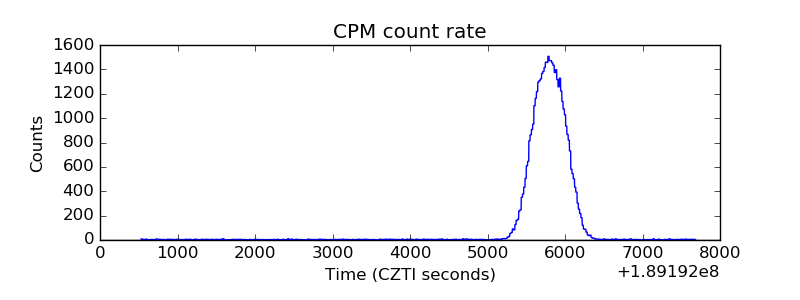 |
| CZT Counter | 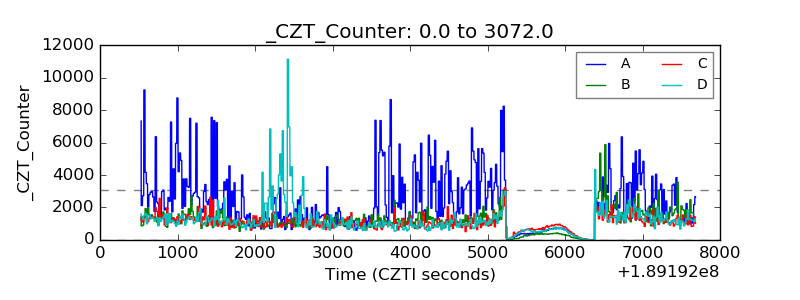 |
| +2.5 Volts monitor |  |
| +5 Volts monitor |  |
| _ROLL_ROT | 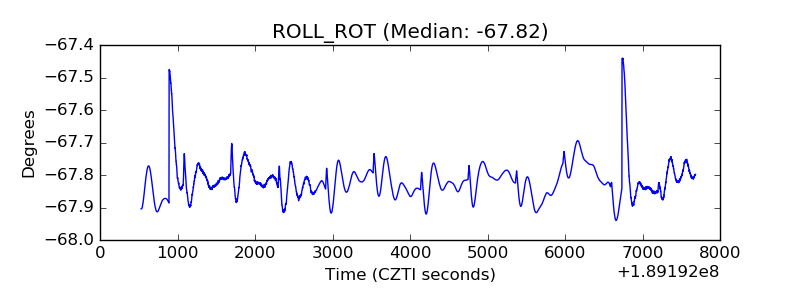 |
| _Roll_DEC | 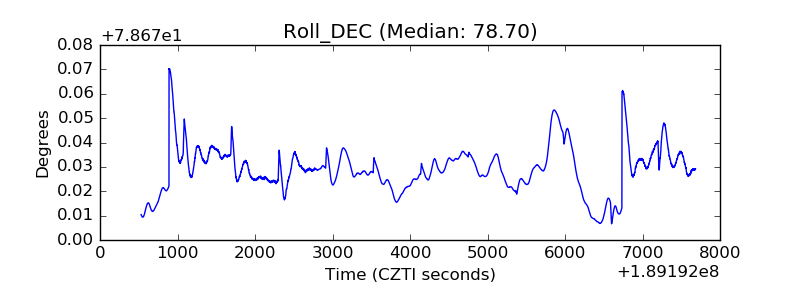 |
| _Roll_RA | 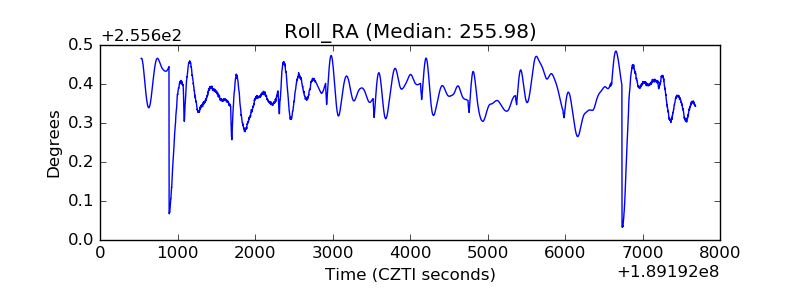 |
| Veto Counter | 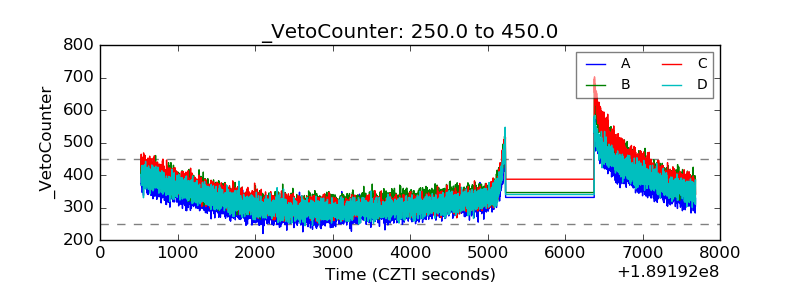 |