| Param | Original file | Final file |
|---|---|---|
| Filename | modeM0/AS1G04_014T02_9000000232_01389cztM0_level2.evt | modeM0/AS1G04_014T02_9000000232_01389cztM0_level2_quad_clean.evt |
| Size (bytes) | 1,116,538,560 | 99,216,000 |
| Size | 1.0 GB | 94.6 MB |
| Events in quadrant A | 9,951,275 | 627,178 |
| Events in quadrant B | 8,082,304 | 666,342 |
| Events in quadrant C | 7,392,953 | 654,101 |
| Events in quadrant D | 7,976,525 | 622,416 |
| Mode SS | |||
|---|---|---|---|
| Quadrant | BADHDUFLAG | Total packets | Discarded packets |
| A | 0 | 126 | 0 |
| B | 0 | 126 | 0 |
| C | 0 | 126 | 0 |
| D | 0 | 126 | 0 |
| Mode M0 | |||
|---|---|---|---|
| Quadrant | BADHDUFLAG | Total packets | Discarded packets |
| A | 0 | 34015 | 3 |
| B | 0 | 28439 | 2 |
| C | 0 | 26369 | 2 |
| D | 0 | 28192 | 2 |
| Mode M9 | |||
|---|---|---|---|
| Quadrant | BADHDUFLAG | Total packets | Discarded packets |
| A | 0 | 18 | 0 |
| B | 0 | 18 | 0 |
| C | 0 | 18 | 0 |
| D | 0 | 19 | 0 |
| Quadrant | Total seconds | Saturated seconds | Saturation percentage |
|---|---|---|---|
| A | 6228 | 439 | 7.048812% |
| B | 6228 | 71 | 1.140013% |
| C | 6228 | 13 | 0.208735% |
| D | 6228 | 246 | 3.949904% |
Noise dominated data is calculated using 1-second bins in cleaned event files. If a bin has >2000 counts, and if more than 50% of those come from <1% of pixels, then it is considered to be noise-dominated and hence unusable.
| Quadrant | # 1 sec bins | Bins with >0 counts | Bins with >2000 counts | High rate bins dominated by noise | Noise dominated (total time) | Noise dominated (detector-on time) | Marked lightcurve |
|---|---|---|---|---|---|---|---|
| A | 7498 | 6228 | 1216 | 1216 | 16.22% | 19.52% | 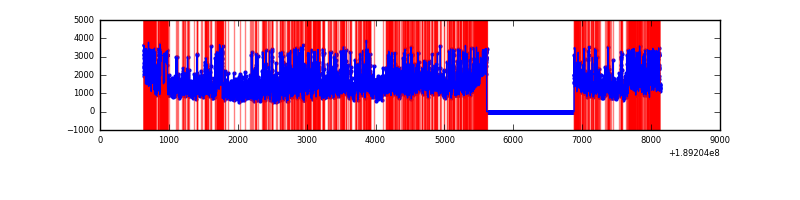 |
| B | 7498 | 6228 | 367 | 367 | 4.89% | 5.89% | 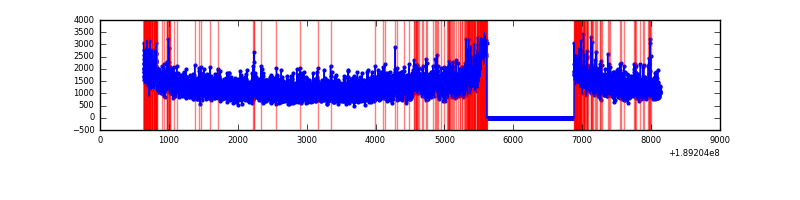 |
| C | 7498 | 6229 | 179 | 179 | 2.39% | 2.87% | 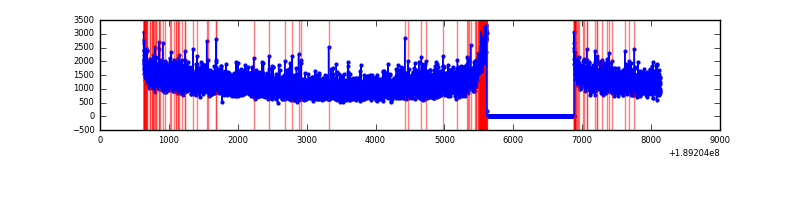 |
| D | 7498 | 6228 | 670 | 670 | 8.94% | 10.76% | 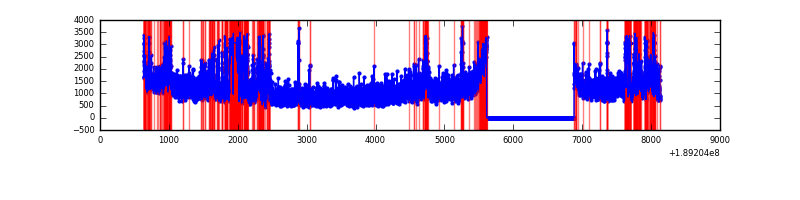 |
Top three noisy pixels from each quadrant. If the there are fewer than three noisy pixels in the level2.evt file, extra rows are filled as -1
| Pixel properties | Quadrant properties | ||||||
|---|---|---|---|---|---|---|---|
| Quadrant | DetID | PixID | Counts | Sigma | Mean | Median | Sigma |
| A | 15 | 127 | 2848625 | 6509.35 | 1842 | 1856 | 437.3 |
| A | 4 | 32 | 11305 | 21.61 | 1842 | 1856 | 437.3 |
| A | 0 | 253 | 10454 | 19.66 | 1842 | 1856 | 437.3 |
| B | 8 | 4 | 285663 | 614.04 | 1981 | 1988 | 462.0 |
| B | 5 | 191 | 88978 | 188.3 | 1981 | 1988 | 462.0 |
| B | 12 | 52 | 88671 | 187.63 | 1981 | 1988 | 462.0 |
| C | 15 | 241 | 214366 | 420.11 | 1828 | 1894 | 505.7 |
| C | 3 | 111 | 18706 | 33.24 | 1828 | 1894 | 505.7 |
| C | 3 | 79 | 12871 | 21.7 | 1828 | 1894 | 505.7 |
| D | 13 | 73 | 1003745 | 1927.63 | 1723 | 1782 | 519.8 |
| D | 9 | 53 | 158852 | 302.18 | 1723 | 1782 | 519.8 |
| D | 1 | 83 | 136349 | 258.89 | 1723 | 1782 | 519.8 |
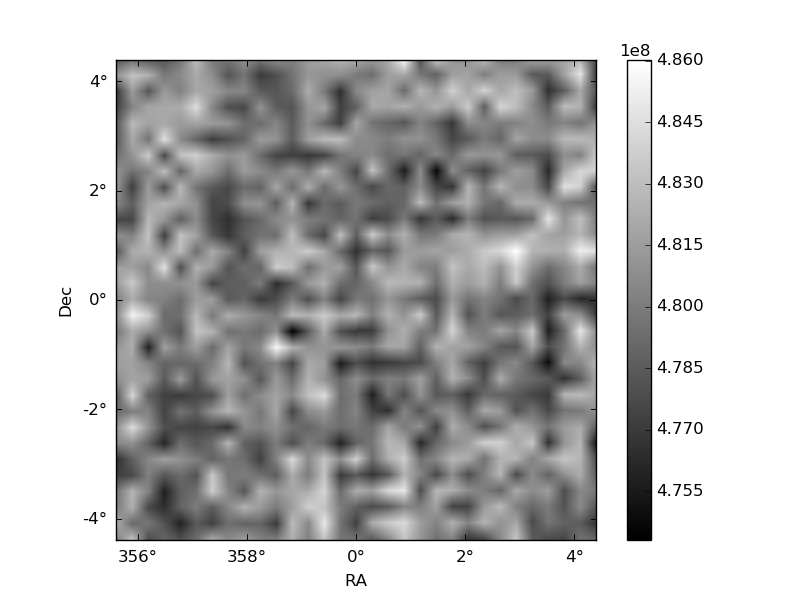
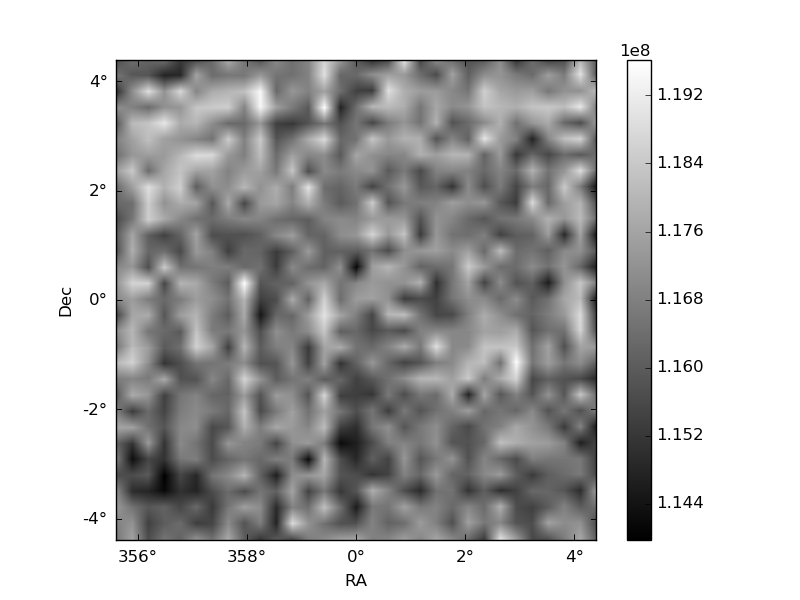
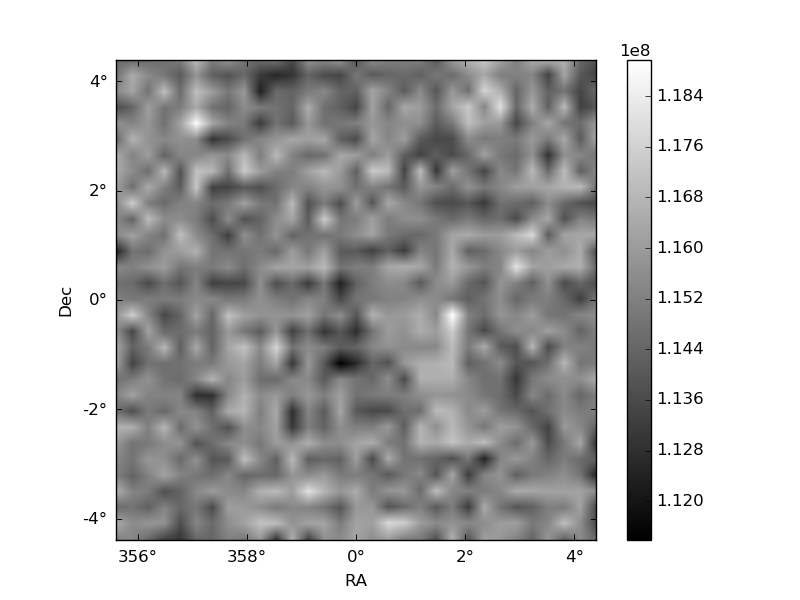
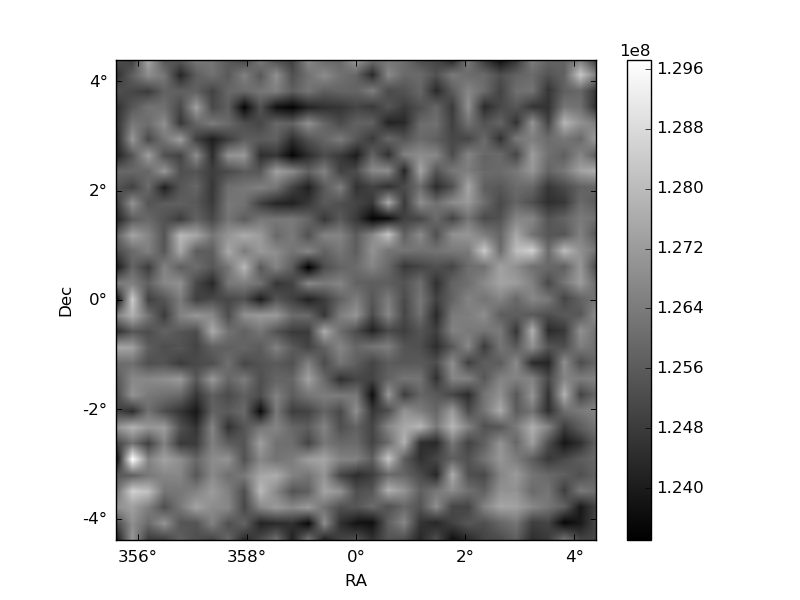
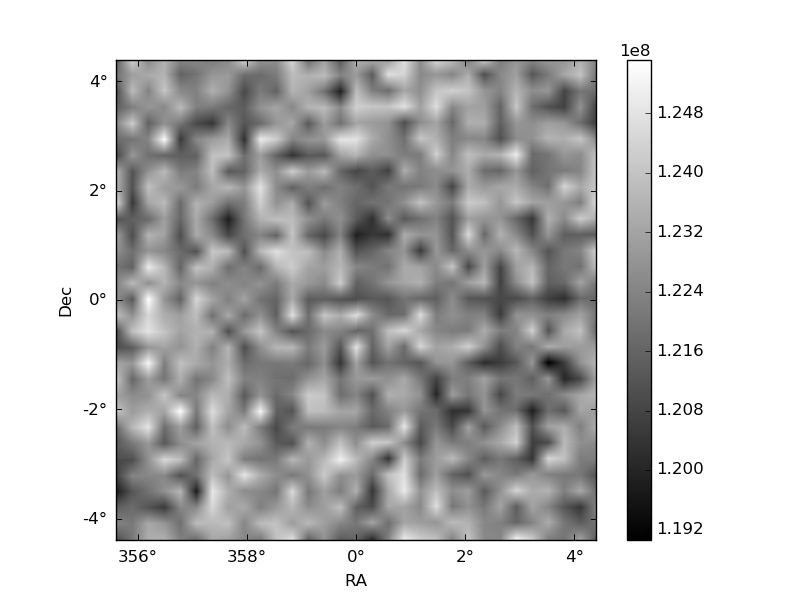
Histogram calculated using DETX and DETY for each event in the final _common_clean file
| Quadrant A | 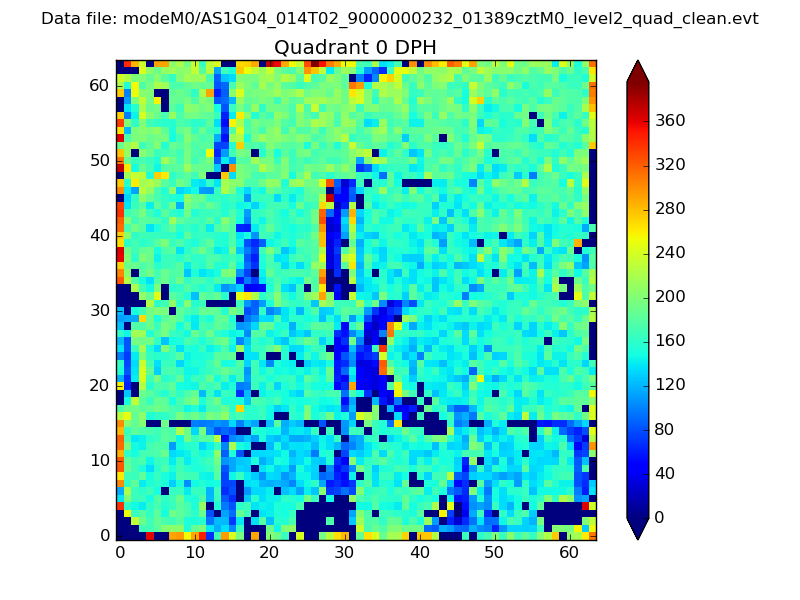 |
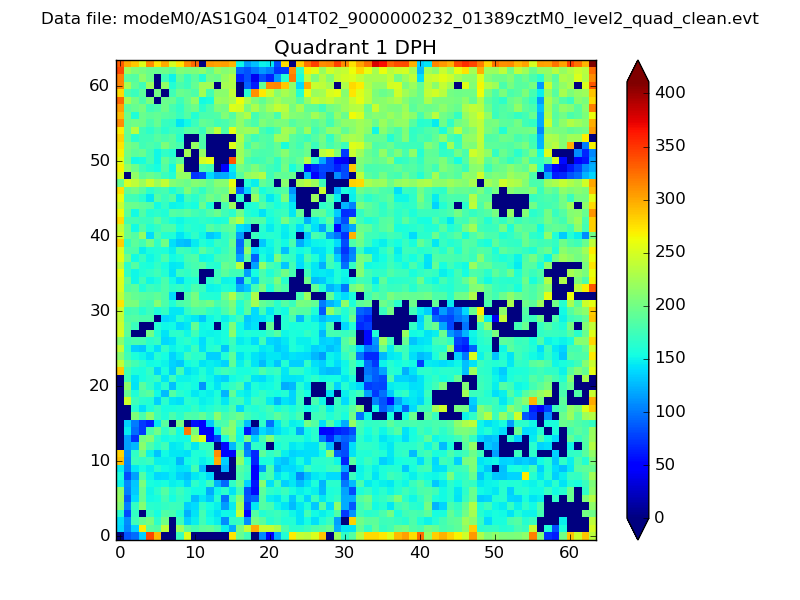 |
Quadrant B |
|---|---|---|---|
| Quadrant D | 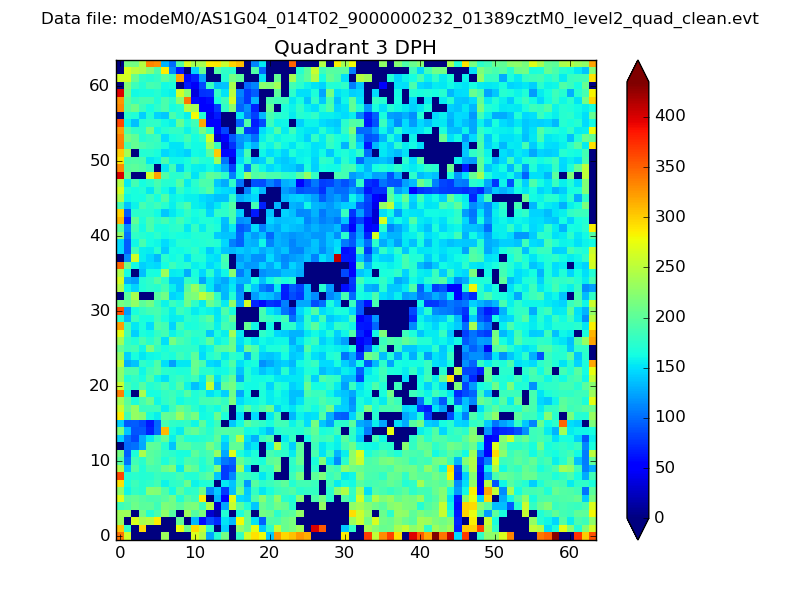 |
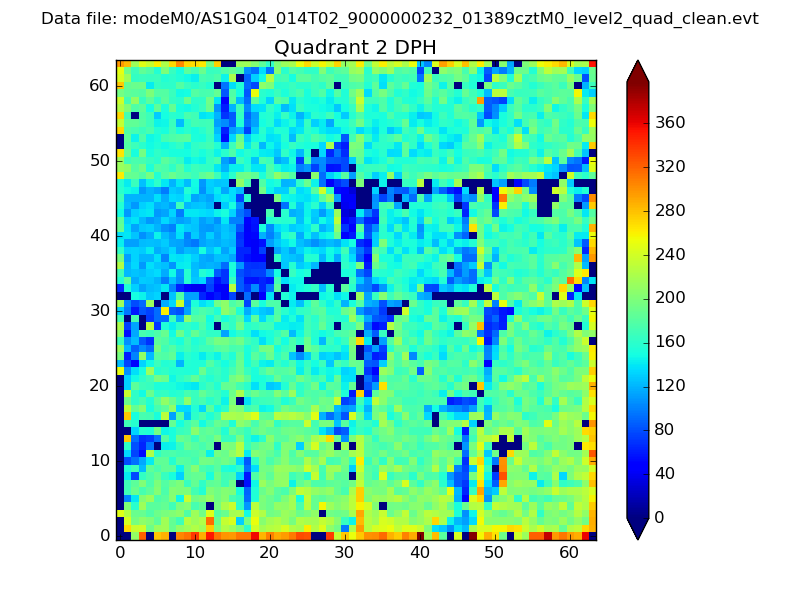 |
Quadrant C |
| Plot type | Count rate plots | Images |
|---|---|---|
| Comparison with Poisson distribution Blue bars denote a histogram of data divided into 1 sec bins. Red curve is a Poisson curve with rate = median count rate of data. |
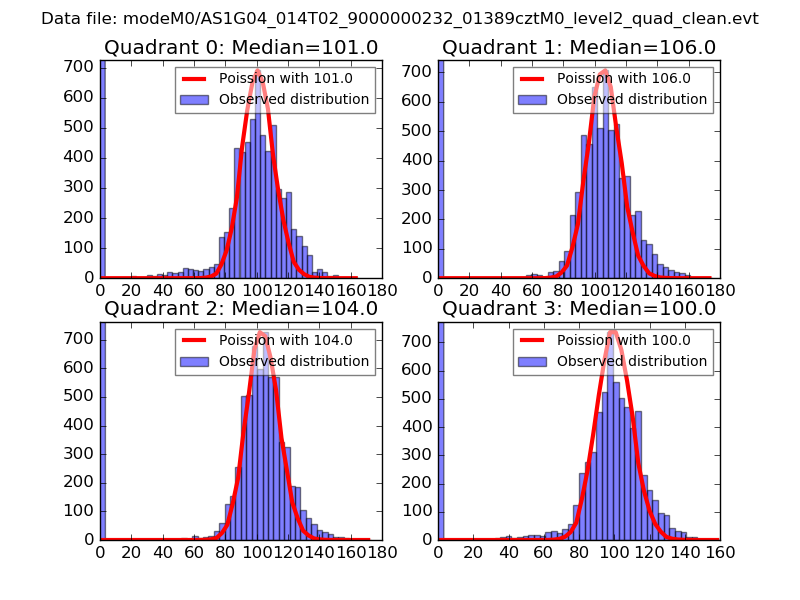 |
 |
| Quadrant-wise count rates Data is divided into 100 sec bins |
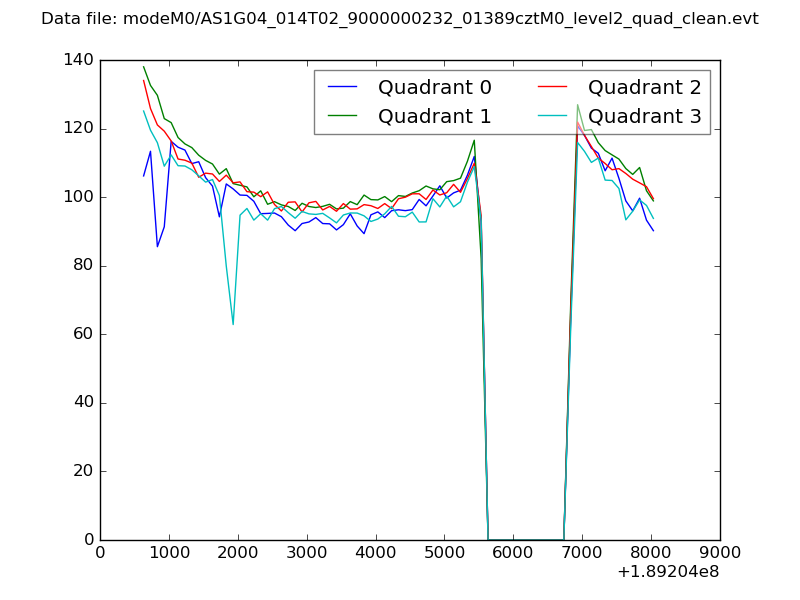 |
|
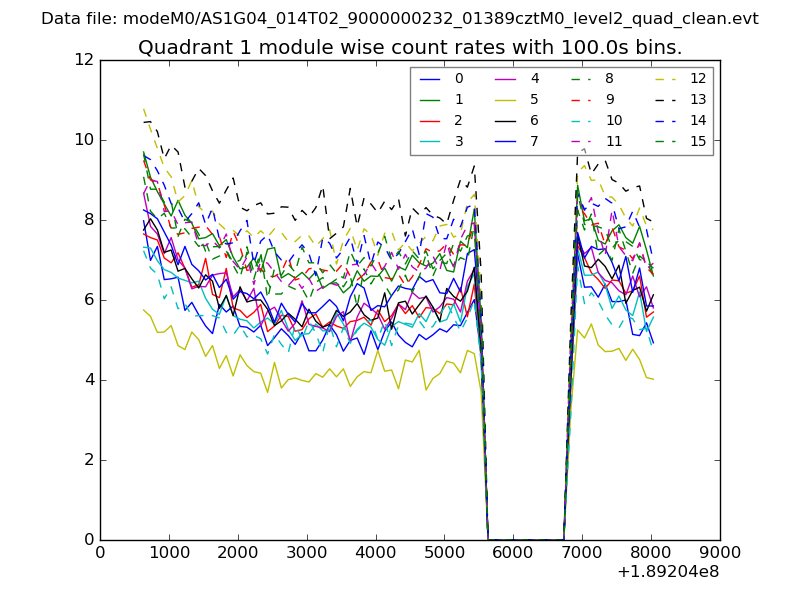
| Module-wise count rates for Quadrant A Data is divided into 100 sec bins |
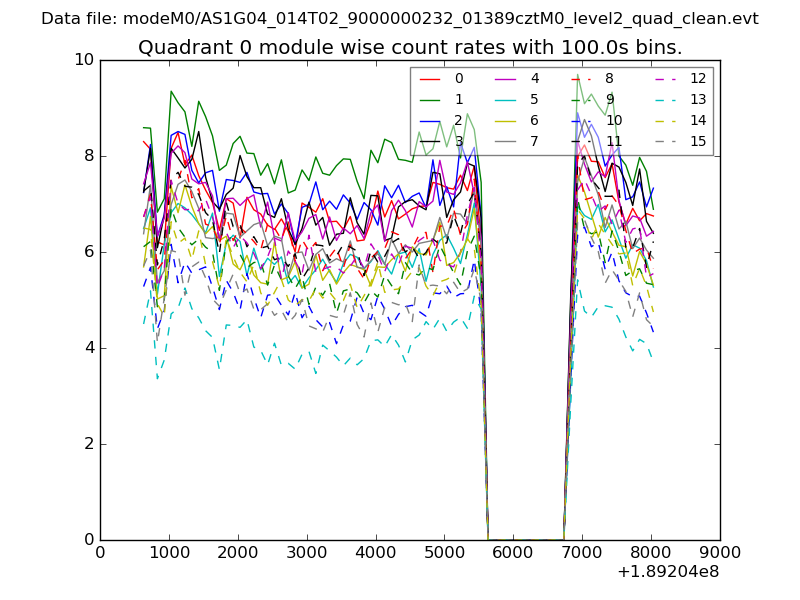 |
 |
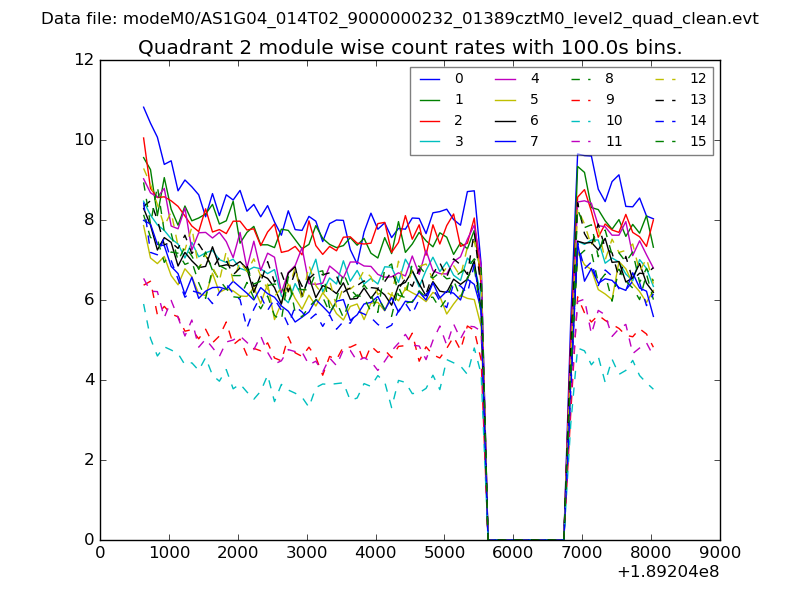
| Module-wise count rates for Quadrant B Data is divided into 100 sec bins |
 |
 |
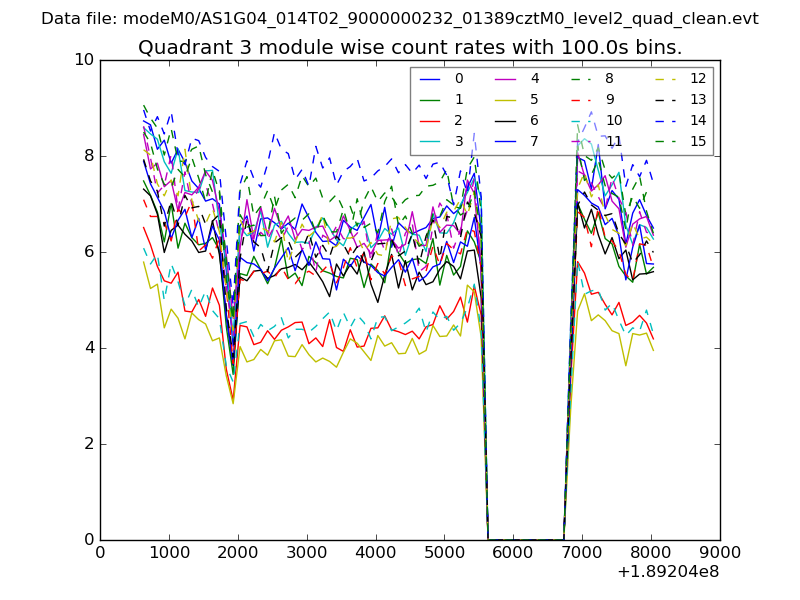
| Module-wise count rates for Quadrant C Data is divided into 100 sec bins |
 |
 |
| Module-wise count rates for Quadrant D Data is divided into 100 sec bins |
 |
 |
| Parameter | Plot |
|---|---|
| CZT HV Monitor | 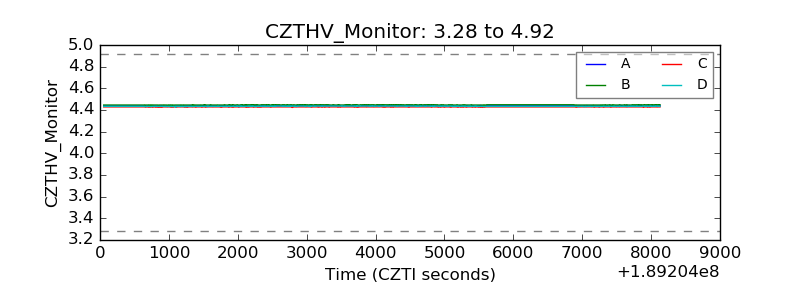 |
| D_VDD | 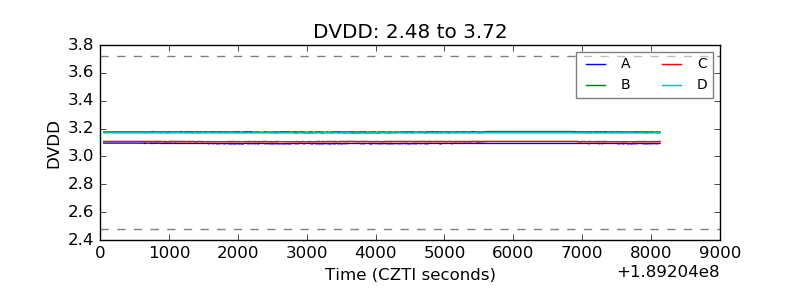 |
| Temperature 1 | 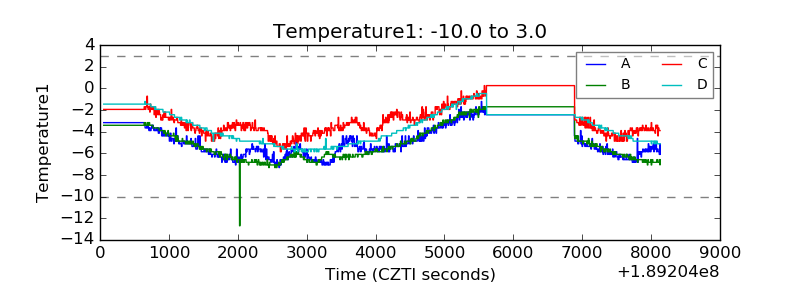 |
| Veto HV Monitor | 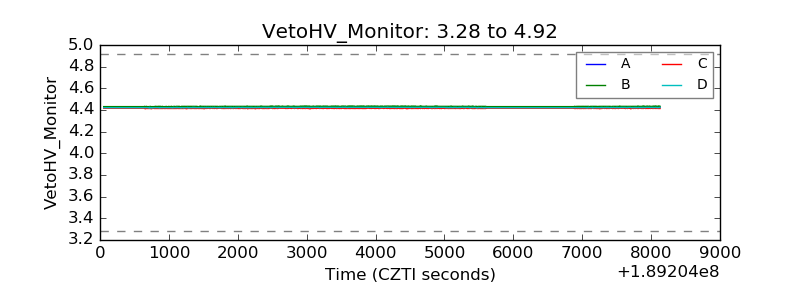 |
| Veto LLD | 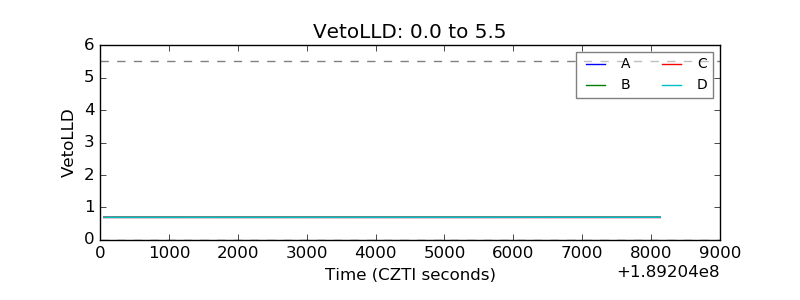 |
| Alpha Counter | 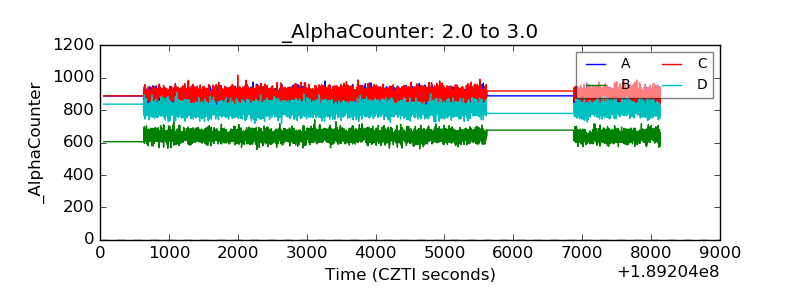 |
| _CPM_Rate | 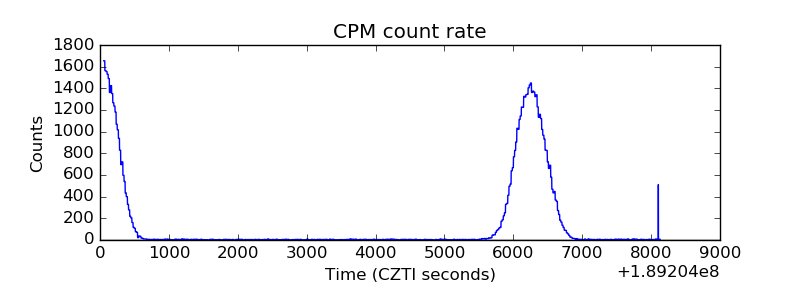 |
| CZT Counter | 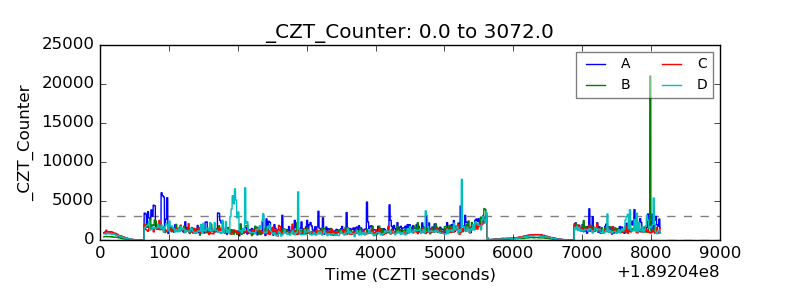 |
| +2.5 Volts monitor |  |
| +5 Volts monitor |  |
| _ROLL_ROT | 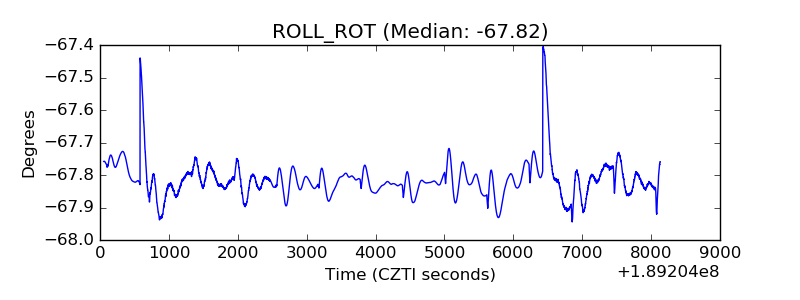 |
| _Roll_DEC | 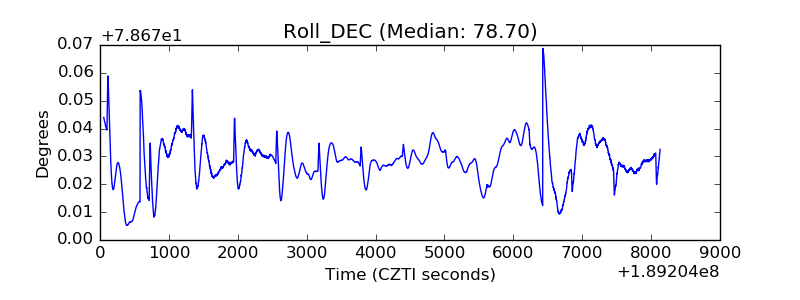 |
| _Roll_RA | 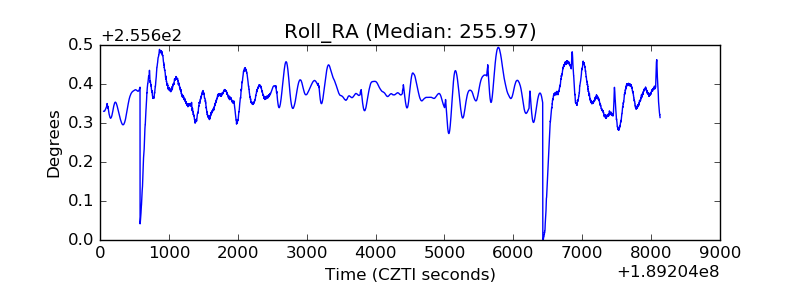 |
| Veto Counter | 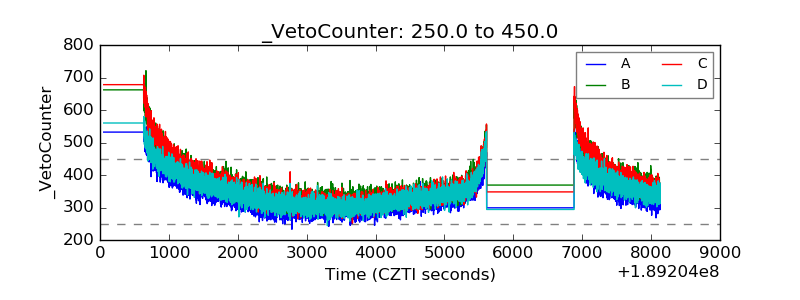 |