| Param | Original file | Final file |
|---|---|---|
| Filename | modeM0/AS1G04_014T02_9000000232_01390cztM0_level2.evt | modeM0/AS1G04_014T02_9000000232_01390cztM0_level2_quad_clean.evt |
| Size (bytes) | 1,172,263,680 | 103,533,120 |
| Size | 1.1 GB | 98.7 MB |
| Events in quadrant A | 10,951,444 | 646,685 |
| Events in quadrant B | 8,732,812 | 687,503 |
| Events in quadrant C | 7,690,513 | 681,042 |
| Events in quadrant D | 7,686,554 | 655,398 |
| Mode SS | |||
|---|---|---|---|
| Quadrant | BADHDUFLAG | Total packets | Discarded packets |
| A | 0 | 136 | 0 |
| B | 0 | 136 | 0 |
| C | 0 | 136 | 0 |
| D | 0 | 136 | 0 |
| Mode M0 | |||
|---|---|---|---|
| Quadrant | BADHDUFLAG | Total packets | Discarded packets |
| A | 0 | 37309 | 3 |
| B | 0 | 30667 | 2 |
| C | 0 | 27607 | 2 |
| D | 0 | 27605 | 2 |
| Mode M9 | |||
|---|---|---|---|
| Quadrant | BADHDUFLAG | Total packets | Discarded packets |
| A | 0 | 22 | 0 |
| B | 0 | 22 | 0 |
| C | 0 | 22 | 0 |
| D | 0 | 23 | 0 |
| Quadrant | Total seconds | Saturated seconds | Saturation percentage |
|---|---|---|---|
| A | 6665 | 568 | 8.522131% |
| B | 6665 | 75 | 1.125281% |
| C | 6665 | 4 | 0.060015% |
| D | 6665 | 107 | 1.605401% |
Noise dominated data is calculated using 1-second bins in cleaned event files. If a bin has >2000 counts, and if more than 50% of those come from <1% of pixels, then it is considered to be noise-dominated and hence unusable.
| Quadrant | # 1 sec bins | Bins with >0 counts | Bins with >2000 counts | High rate bins dominated by noise | Noise dominated (total time) | Noise dominated (detector-on time) | Marked lightcurve |
|---|---|---|---|---|---|---|---|
| A | 7930 | 6666 | 1533 | 1533 | 19.33% | 23.00% | 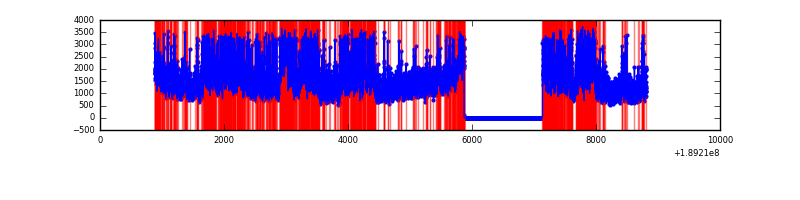 |
| B | 7930 | 6666 | 412 | 412 | 5.20% | 6.18% | 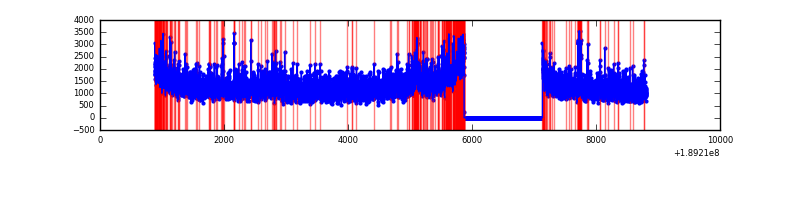 |
| C | 7930 | 6666 | 170 | 170 | 2.14% | 2.55% | 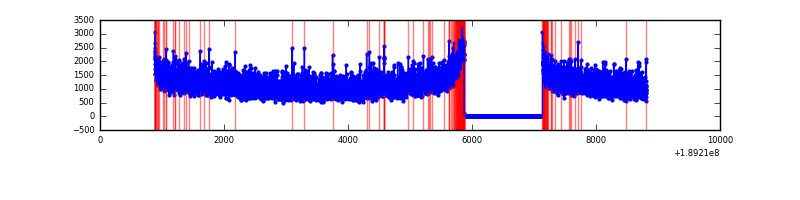 |
| D | 7930 | 6666 | 359 | 359 | 4.53% | 5.39% | 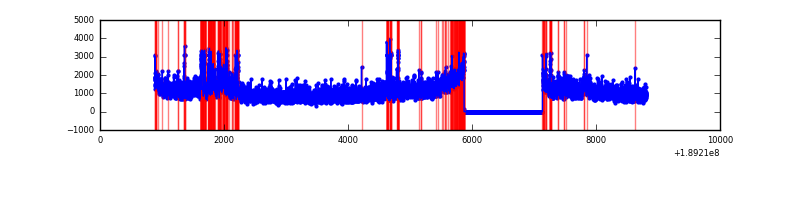 |
Top three noisy pixels from each quadrant. If the there are fewer than three noisy pixels in the level2.evt file, extra rows are filled as -1
| Pixel properties | Quadrant properties | ||||||
|---|---|---|---|---|---|---|---|
| Quadrant | DetID | PixID | Counts | Sigma | Mean | Median | Sigma |
| A | 15 | 127 | 3524477 | 7655.05 | 1926 | 1946 | 460.2 |
| A | 4 | 32 | 14566 | 27.43 | 1926 | 1946 | 460.2 |
| A | 13 | 17 | 10493 | 18.57 | 1926 | 1946 | 460.2 |
| B | 8 | 4 | 439785 | 906.32 | 2067 | 2077 | 483.0 |
| B | 5 | 191 | 179329 | 367.02 | 2067 | 2077 | 483.0 |
| B | 6 | 53 | 76587 | 154.28 | 2067 | 2077 | 483.0 |
| C | 15 | 241 | 235533 | 447.16 | 1892 | 1958 | 522.4 |
| C | 7 | 220 | 22150 | 38.65 | 1892 | 1958 | 522.4 |
| C | 3 | 111 | 18917 | 32.47 | 1892 | 1958 | 522.4 |
| D | 13 | 73 | 417954 | 779.35 | 1798 | 1849 | 533.9 |
| D | 2 | 16 | 264825 | 492.54 | 1798 | 1849 | 533.9 |
| D | 1 | 20 | 113528 | 209.17 | 1798 | 1849 | 533.9 |
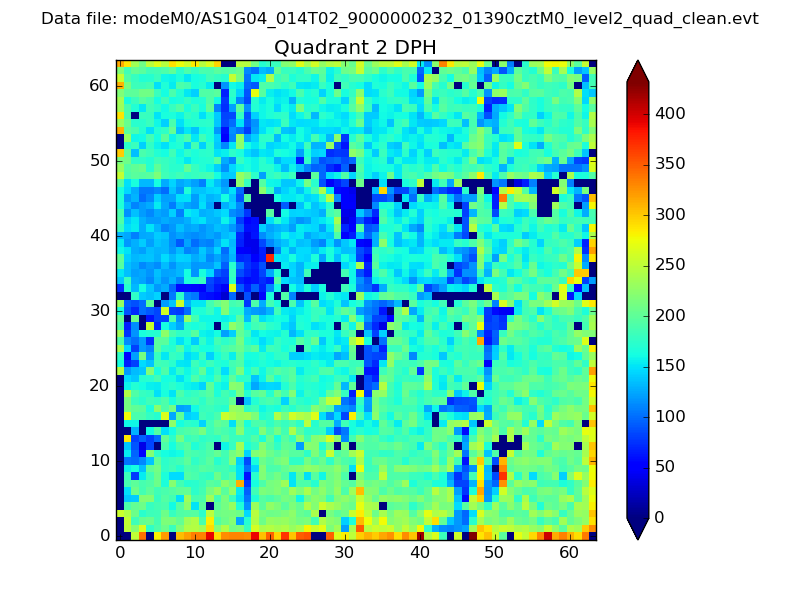
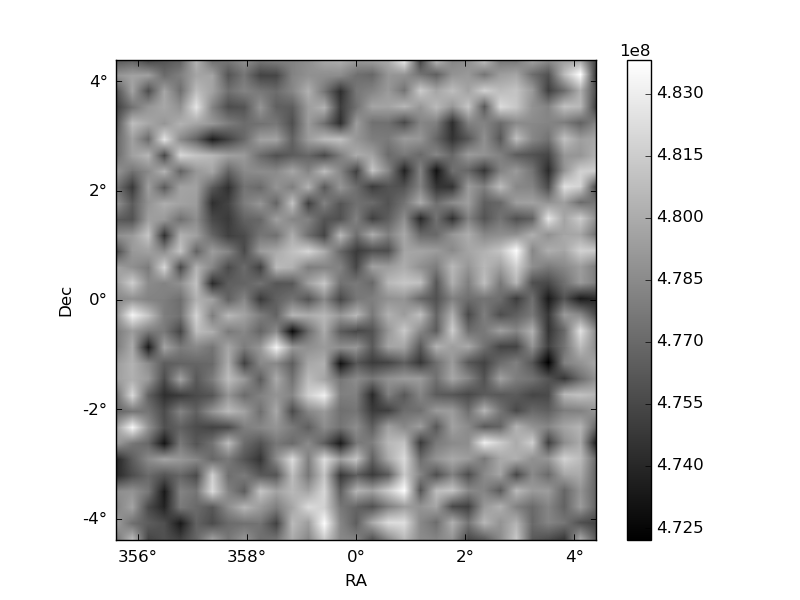
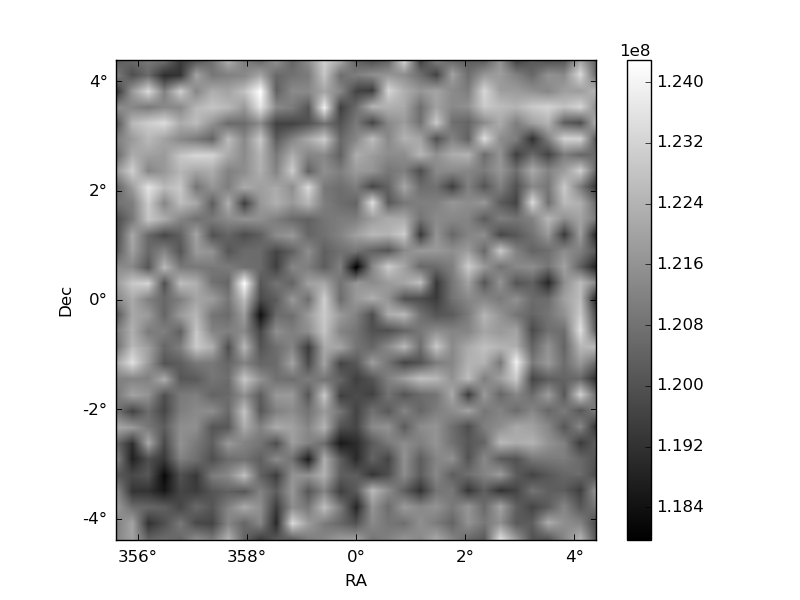
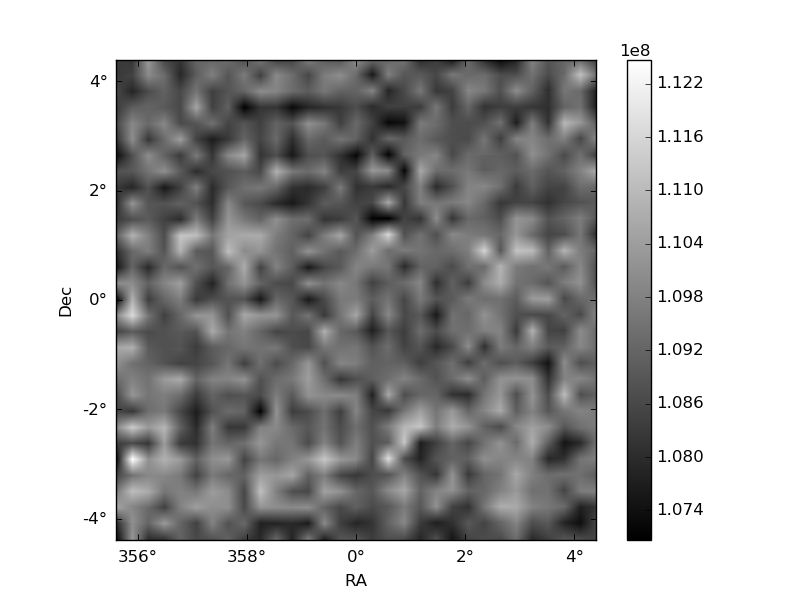
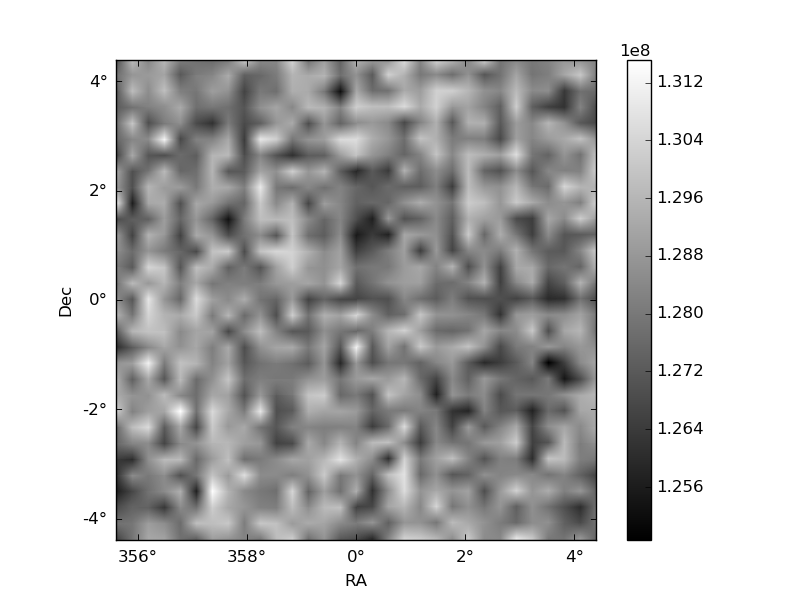
Histogram calculated using DETX and DETY for each event in the final _common_clean file
| Quadrant A | 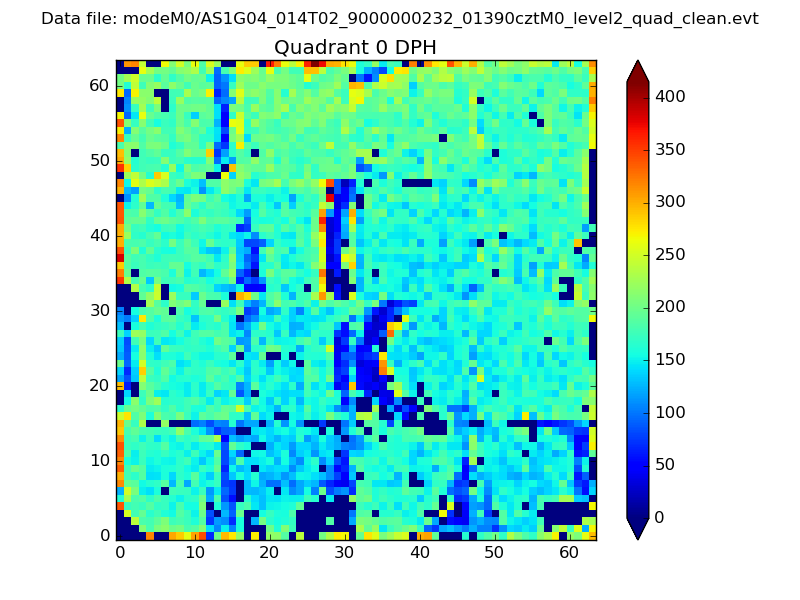 |
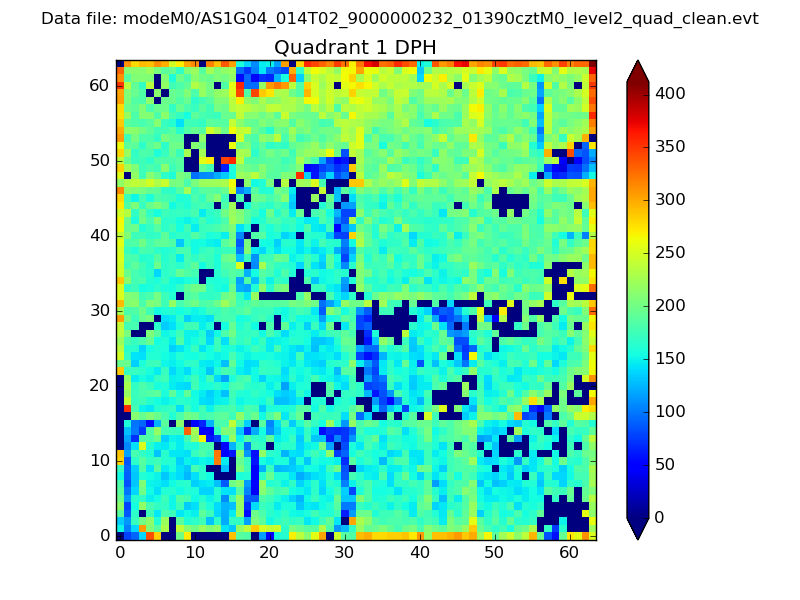 |
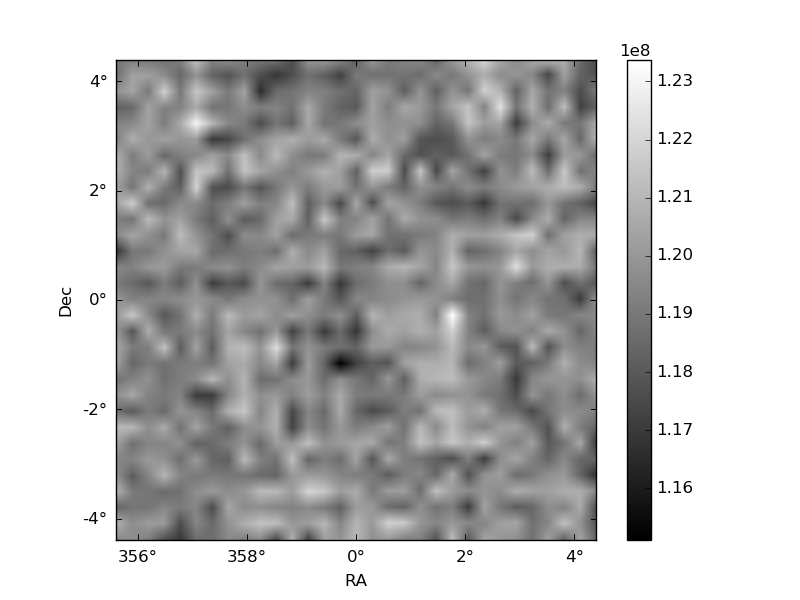
Quadrant B |
|---|---|---|---|
| Quadrant D | 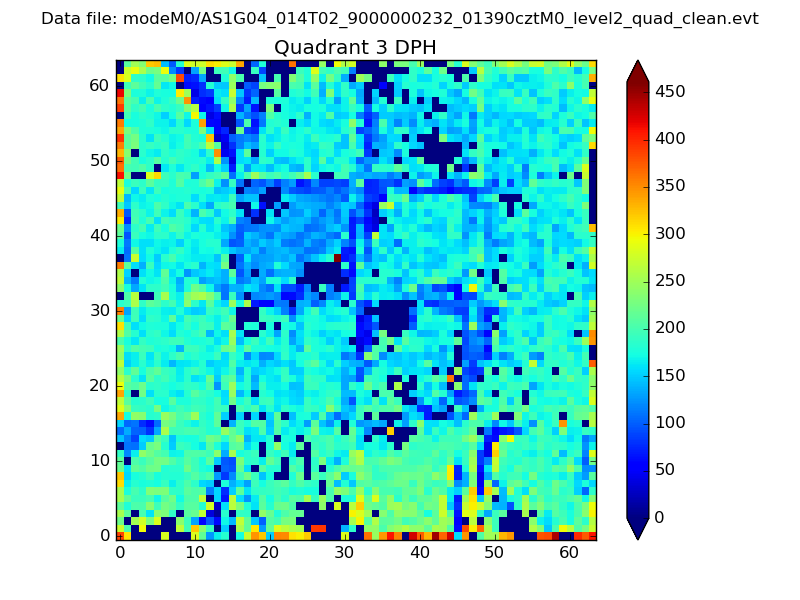 |
 |
Quadrant C |
| Plot type | Count rate plots | Images |
|---|---|---|
| Comparison with Poisson distribution Blue bars denote a histogram of data divided into 1 sec bins. Red curve is a Poisson curve with rate = median count rate of data. |
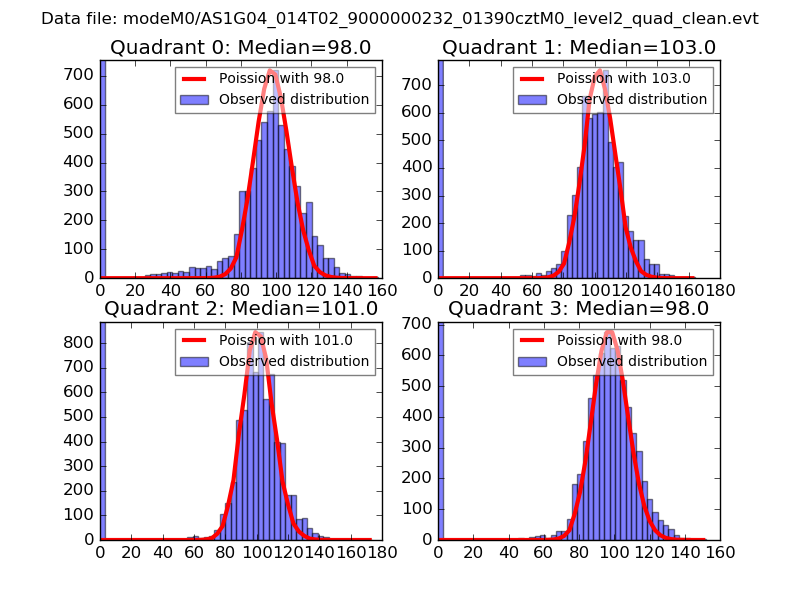 |
 |
| Quadrant-wise count rates Data is divided into 100 sec bins |
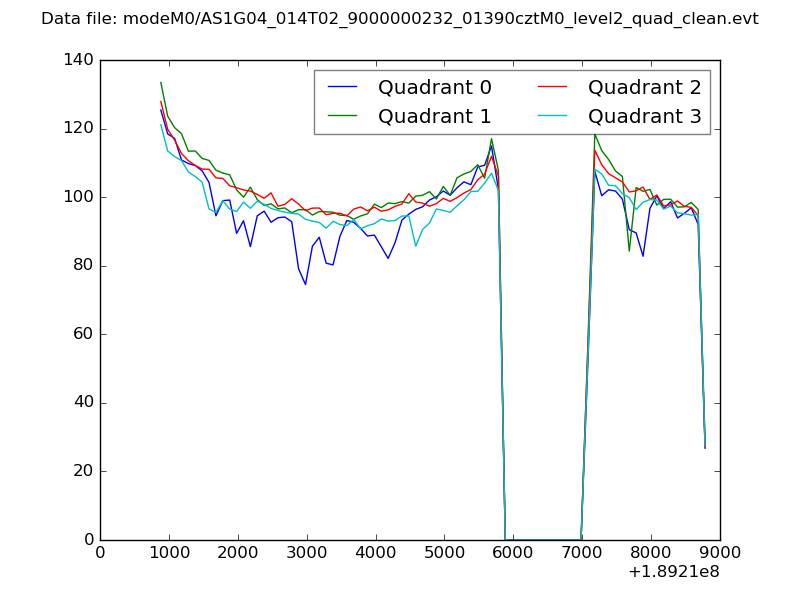 |
|
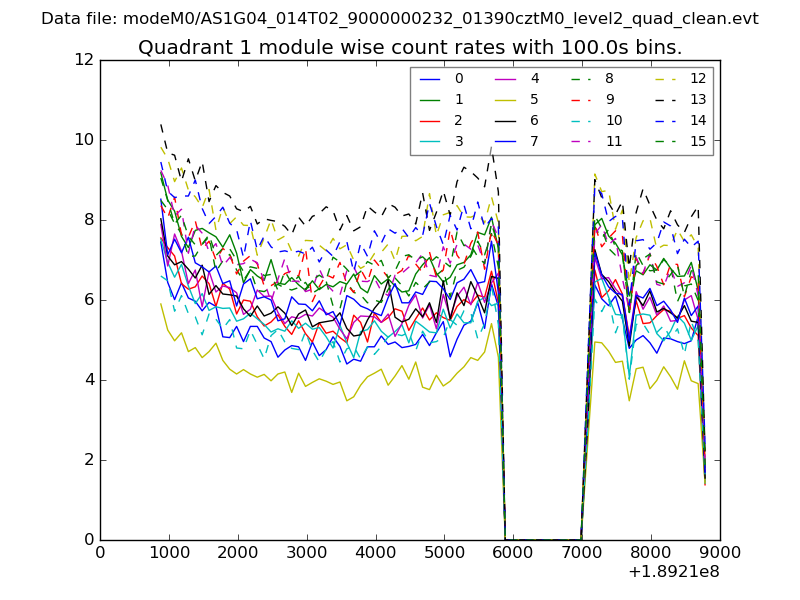
| Module-wise count rates for Quadrant A Data is divided into 100 sec bins |
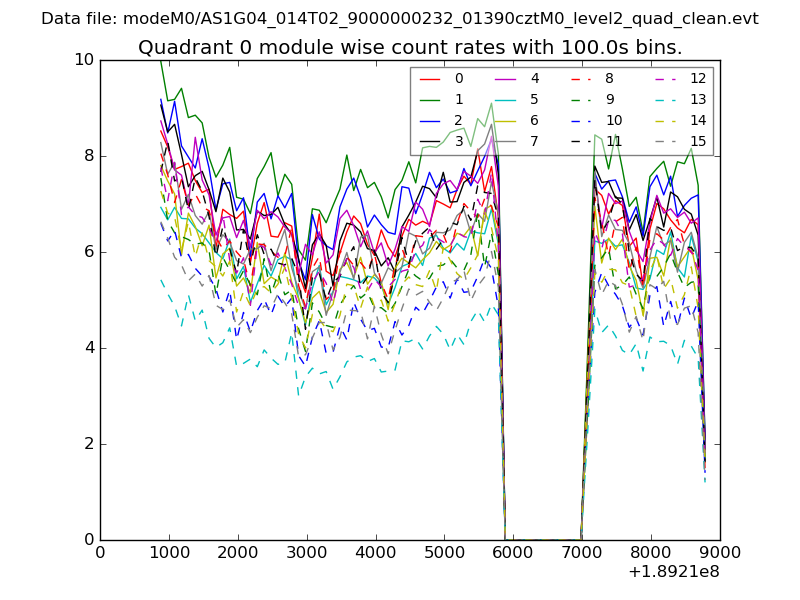 |
 |
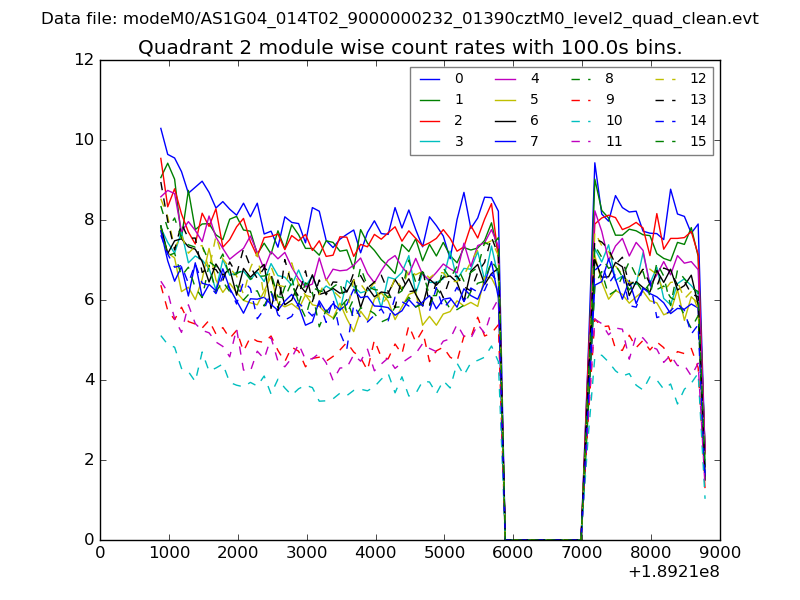
| Module-wise count rates for Quadrant B Data is divided into 100 sec bins |
 |
 |
| Module-wise count rates for Quadrant C Data is divided into 100 sec bins |
 |
 |
| Module-wise count rates for Quadrant D Data is divided into 100 sec bins |
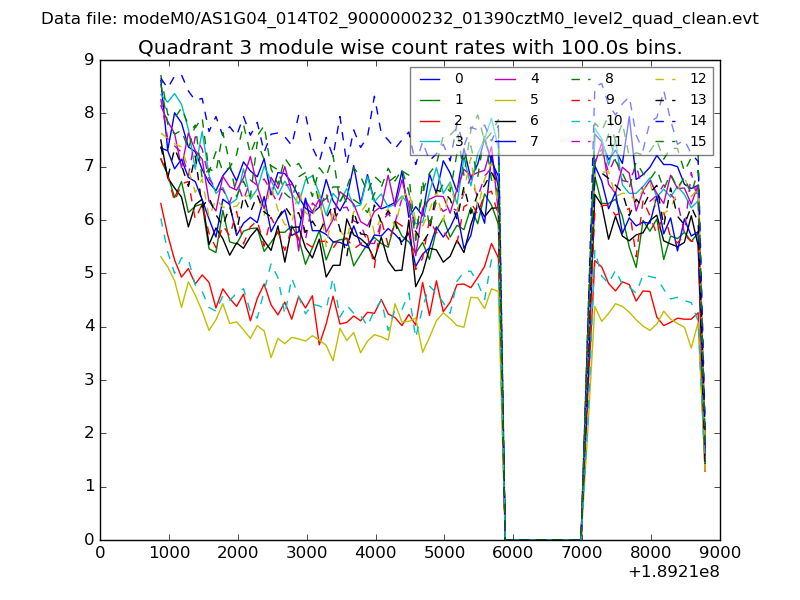 |
 |
| Parameter | Plot |
|---|---|
| CZT HV Monitor | 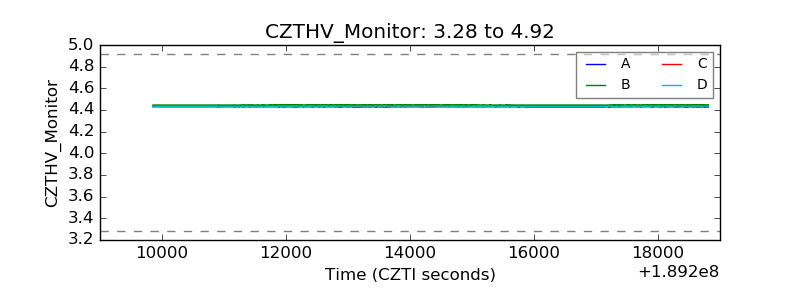 |
| D_VDD | 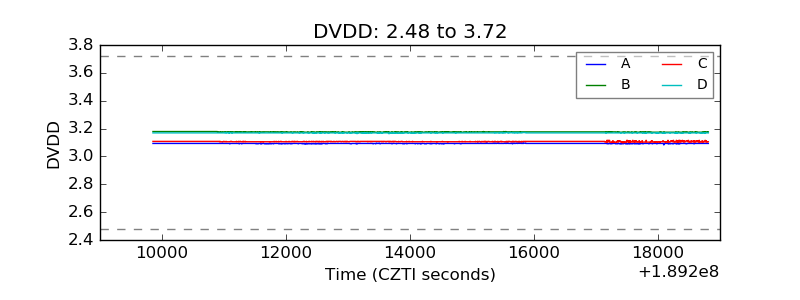 |
| Temperature 1 | 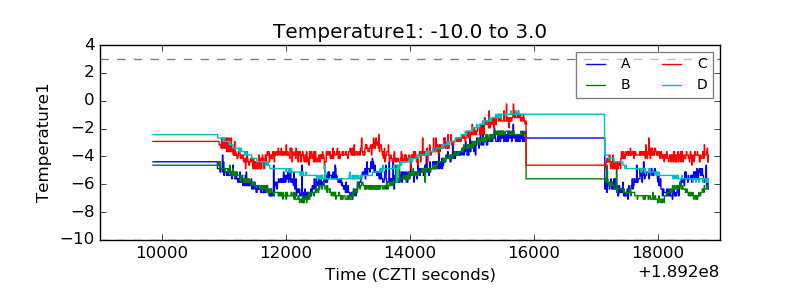 |
| Veto HV Monitor | 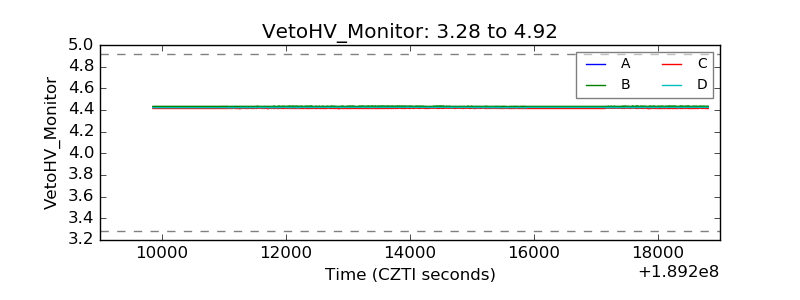 |
| Veto LLD | 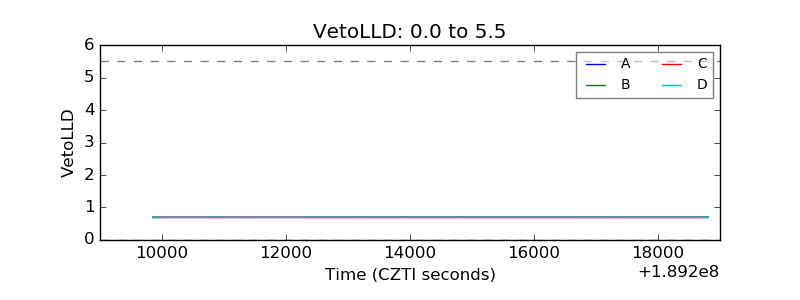 |
| Alpha Counter | 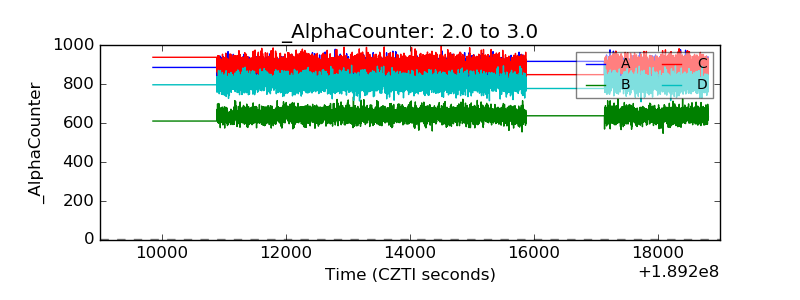 |
| _CPM_Rate | 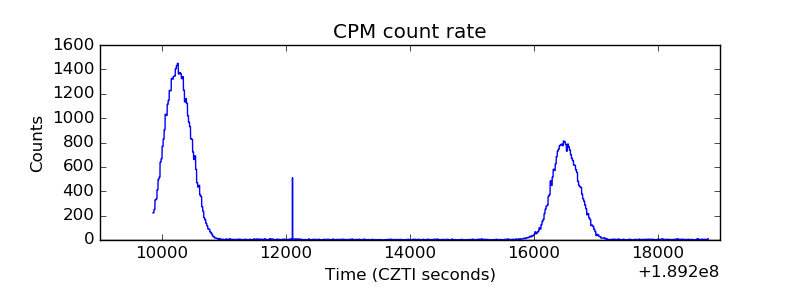 |
| CZT Counter | 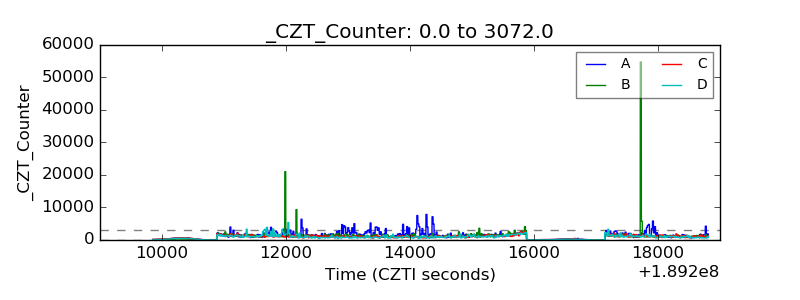 |
| +2.5 Volts monitor | 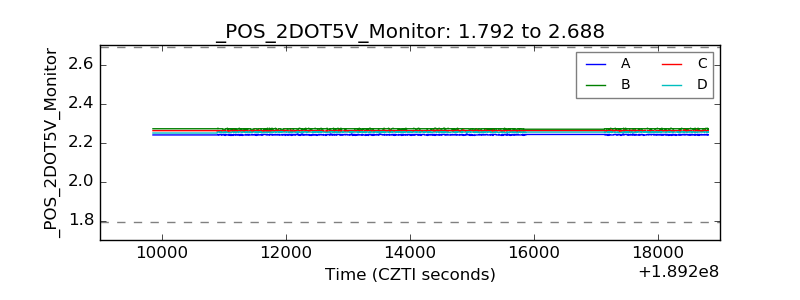 |
| +5 Volts monitor | 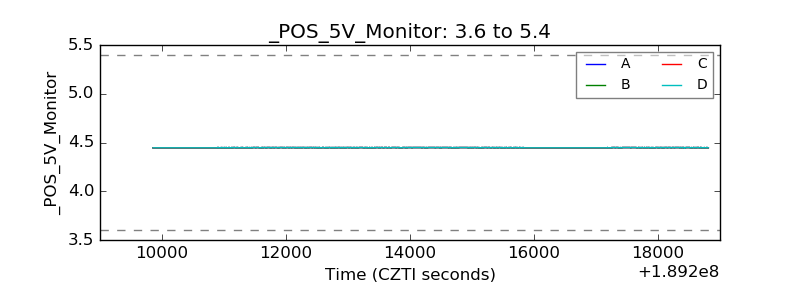 |
| _ROLL_ROT | 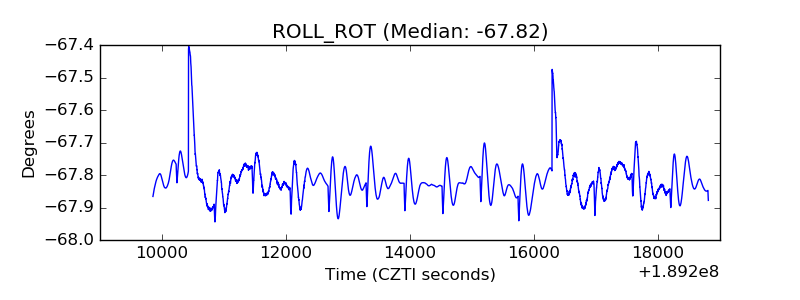 |
| _Roll_DEC | 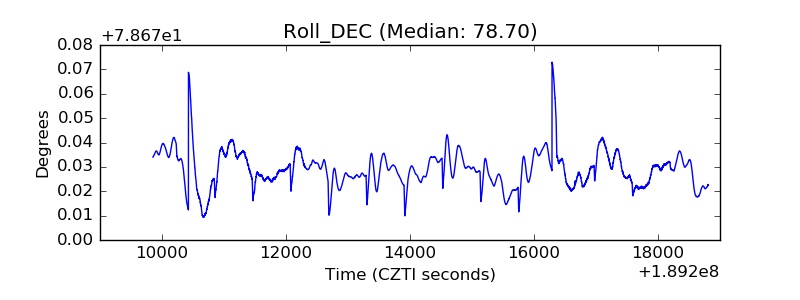 |
| _Roll_RA |  |
| Veto Counter | 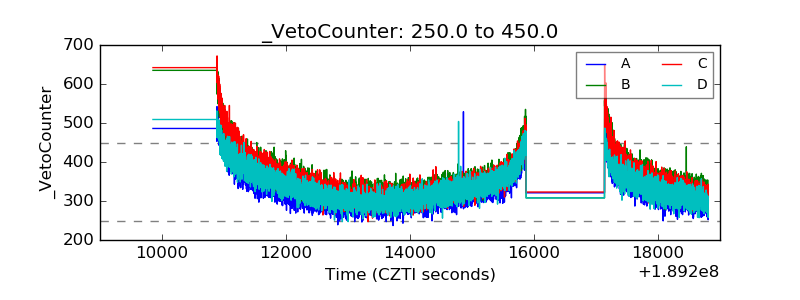 |