| Param | Original file | Final file |
|---|---|---|
| Filename | modeM0/AS1G04_014T02_9000000232_01391cztM0_level2.evt | modeM0/AS1G04_014T02_9000000232_01391cztM0_level2_quad_clean.evt |
| Size (bytes) | 1,231,591,680 | 101,154,240 |
| Size | 1.1 GB | 96.5 MB |
| Events in quadrant A | 12,706,196 | 604,621 |
| Events in quadrant B | 8,849,680 | 675,426 |
| Events in quadrant C | 7,784,162 | 664,940 |
| Events in quadrant D | 7,510,949 | 645,436 |
| Mode SS | |||
|---|---|---|---|
| Quadrant | BADHDUFLAG | Total packets | Discarded packets |
| A | 0 | 140 | 0 |
| B | 0 | 140 | 0 |
| C | 0 | 140 | 0 |
| D | 0 | 140 | 0 |
| Mode M0 | |||
|---|---|---|---|
| Quadrant | BADHDUFLAG | Total packets | Discarded packets |
| A | 0 | 42653 | 3 |
| B | 0 | 31061 | 2 |
| C | 0 | 27901 | 2 |
| D | 0 | 27167 | 2 |
| Mode M9 | |||
|---|---|---|---|
| Quadrant | BADHDUFLAG | Total packets | Discarded packets |
| A | 0 | 10 | 0 |
| B | 0 | 10 | 0 |
| C | 0 | 10 | 0 |
| D | 0 | 11 | 0 |
| Quadrant | Total seconds | Saturated seconds | Saturation percentage |
|---|---|---|---|
| A | 6772 | 1123 | 16.582989% |
| B | 6772 | 45 | 0.664501% |
| C | 6772 | 8 | 0.118133% |
| D | 6772 | 65 | 0.959835% |
Noise dominated data is calculated using 1-second bins in cleaned event files. If a bin has >2000 counts, and if more than 50% of those come from <1% of pixels, then it is considered to be noise-dominated and hence unusable.
| Quadrant | # 1 sec bins | Bins with >0 counts | Bins with >2000 counts | High rate bins dominated by noise | Noise dominated (total time) | Noise dominated (detector-on time) | Marked lightcurve |
|---|---|---|---|---|---|---|---|
| A | 7857 | 6772 | 2607 | 2607 | 33.18% | 38.50% | 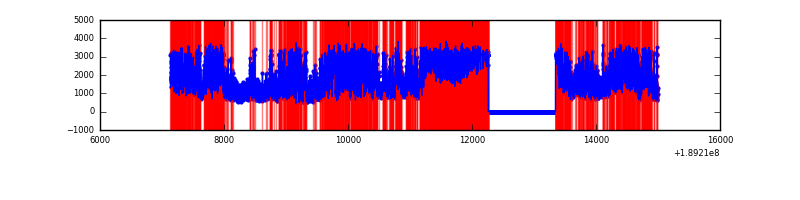 |
| B | 7857 | 6773 | 493 | 493 | 6.27% | 7.28% | 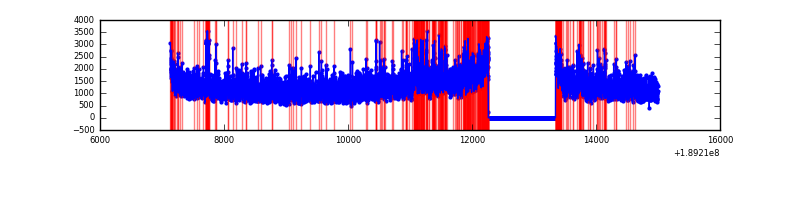 |
| C | 7857 | 6773 | 181 | 181 | 2.30% | 2.67% | 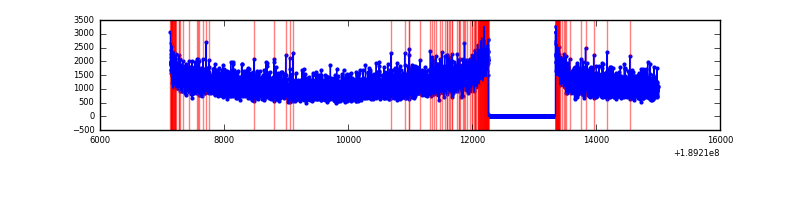 |
| D | 7857 | 6773 | 225 | 225 | 2.86% | 3.32% | 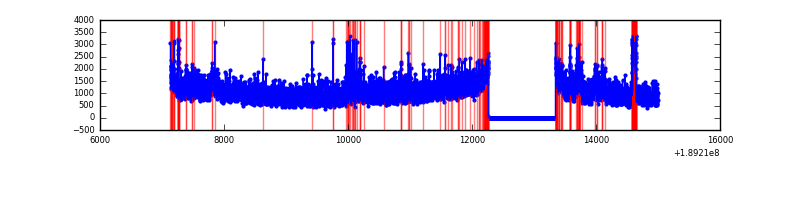 |
Top three noisy pixels from each quadrant. If the there are fewer than three noisy pixels in the level2.evt file, extra rows are filled as -1
| Pixel properties | Quadrant properties | ||||||
|---|---|---|---|---|---|---|---|
| Quadrant | DetID | PixID | Counts | Sigma | Mean | Median | Sigma |
| A | 15 | 127 | 5421719 | 12127.57 | 1873 | 1886 | 446.9 |
| A | 4 | 32 | 52054 | 112.26 | 1873 | 1886 | 446.9 |
| A | 12 | 243 | 21276 | 43.39 | 1873 | 1886 | 446.9 |
| B | 8 | 4 | 439692 | 886.11 | 2101 | 2112 | 493.8 |
| B | 12 | 52 | 125095 | 249.04 | 2101 | 2112 | 493.8 |
| B | 5 | 191 | 84347 | 166.53 | 2101 | 2112 | 493.8 |
| C | 15 | 241 | 237531 | 444.58 | 1906 | 1971 | 529.8 |
| C | 7 | 220 | 43600 | 78.57 | 1906 | 1971 | 529.8 |
| C | 3 | 111 | 22632 | 38.99 | 1906 | 1971 | 529.8 |
| D | 2 | 16 | 301209 | 564.14 | 1822 | 1862 | 530.6 |
| D | 1 | 83 | 169104 | 315.18 | 1822 | 1862 | 530.6 |
| D | 1 | 20 | 118025 | 218.92 | 1822 | 1862 | 530.6 |
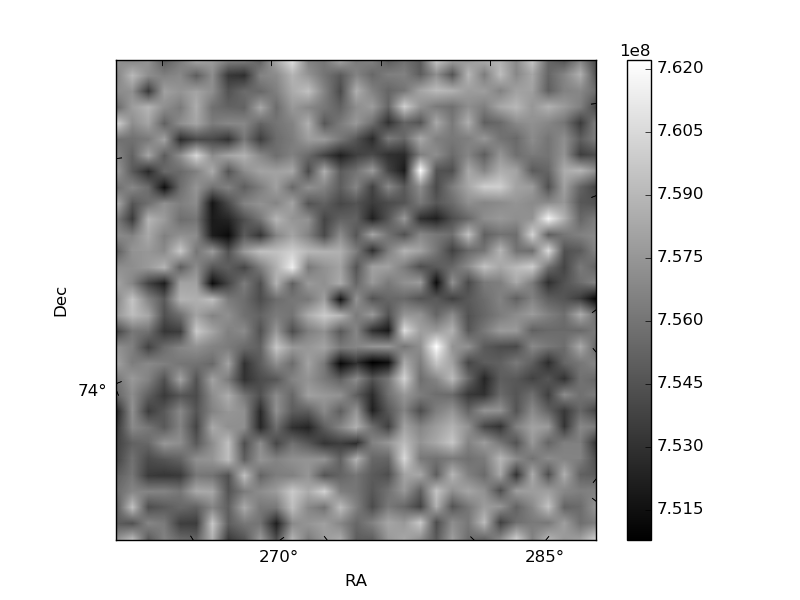
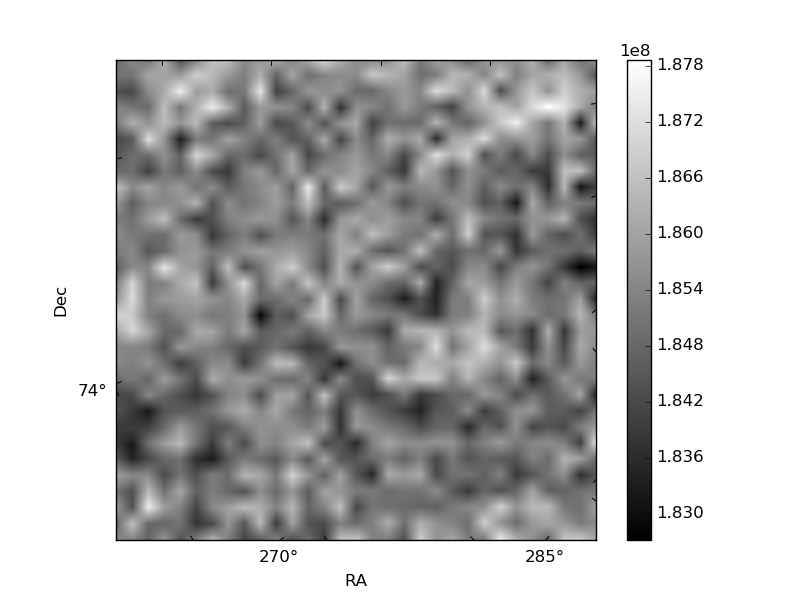
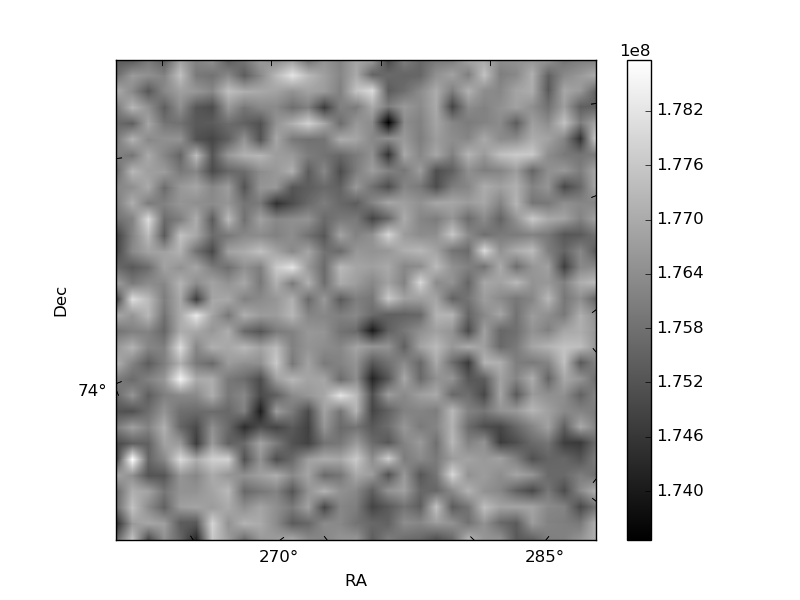
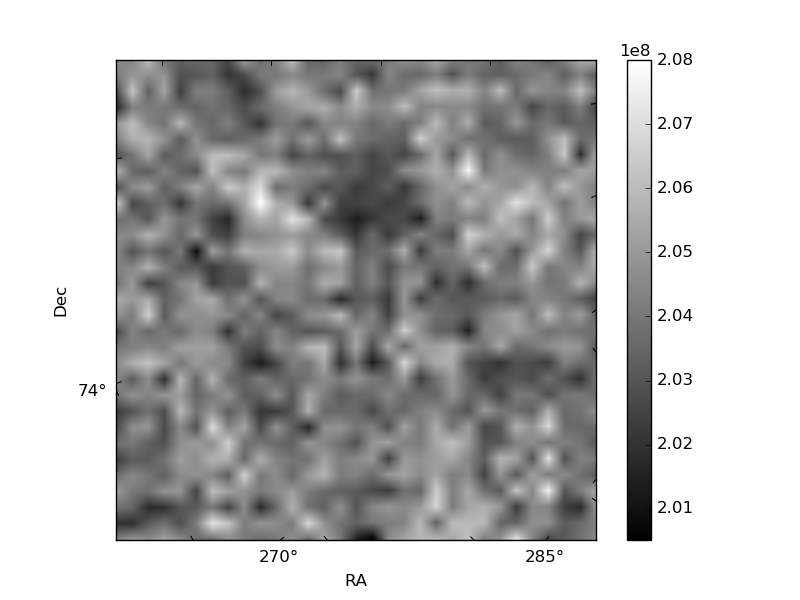
Histogram calculated using DETX and DETY for each event in the final _common_clean file
| Quadrant A | 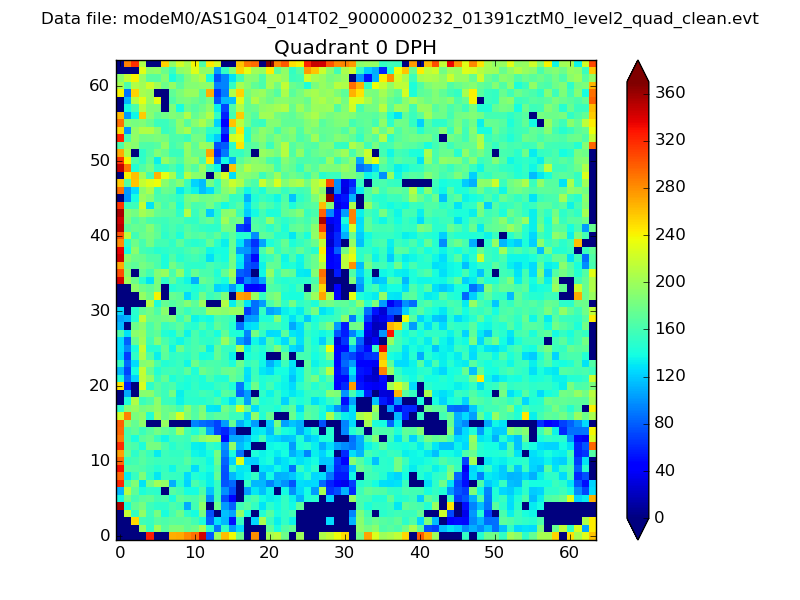 |
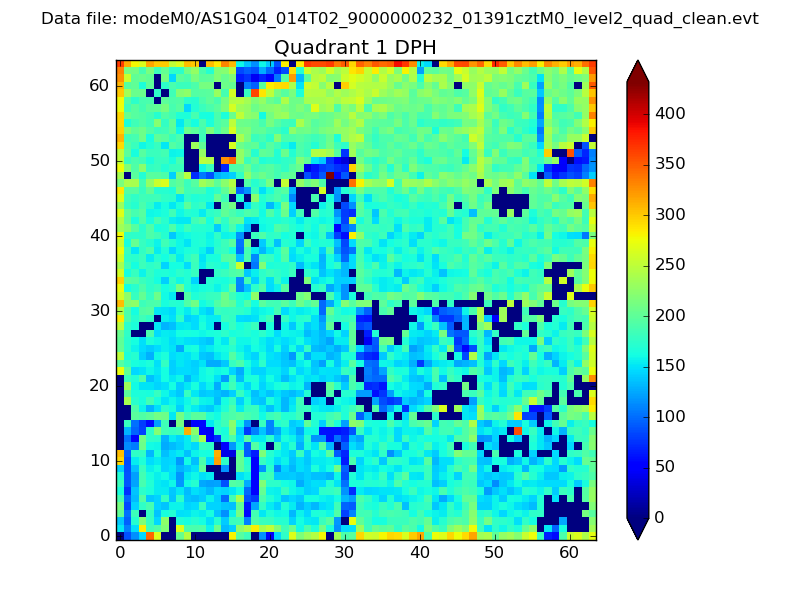 |
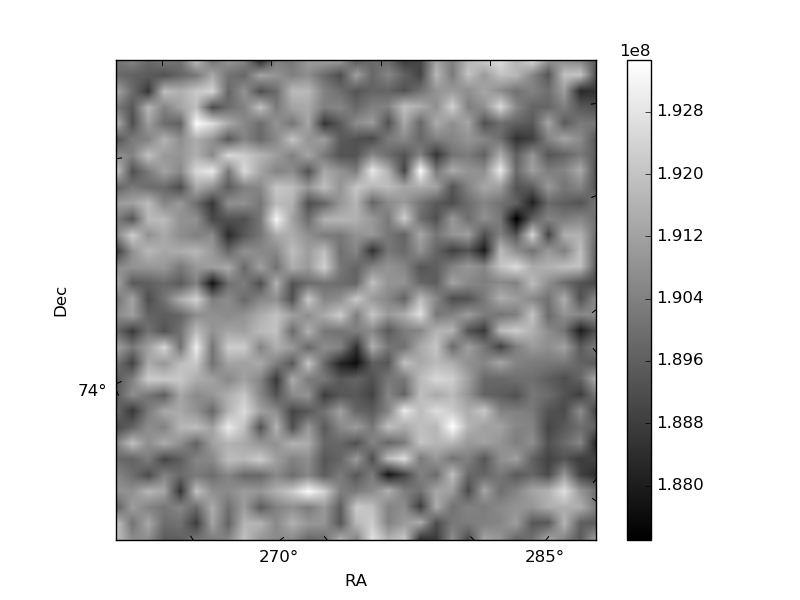
Quadrant B |
|---|---|---|---|
| Quadrant D | 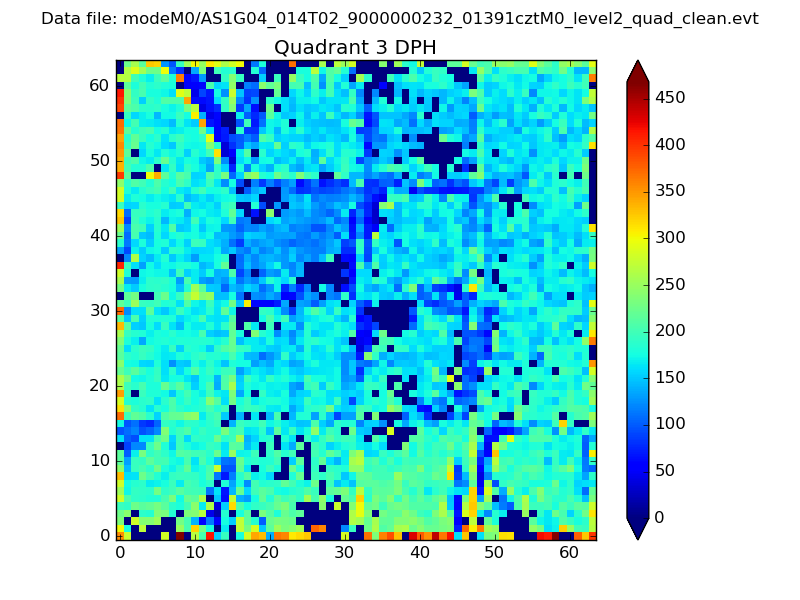 |
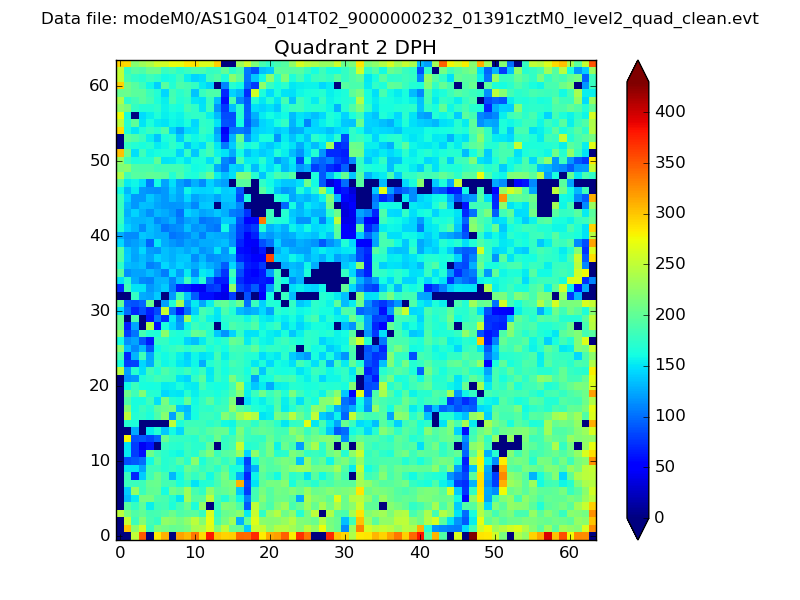 |
Quadrant C |
| Plot type | Count rate plots | Images |
|---|---|---|
| Comparison with Poisson distribution Blue bars denote a histogram of data divided into 1 sec bins. Red curve is a Poisson curve with rate = median count rate of data. |
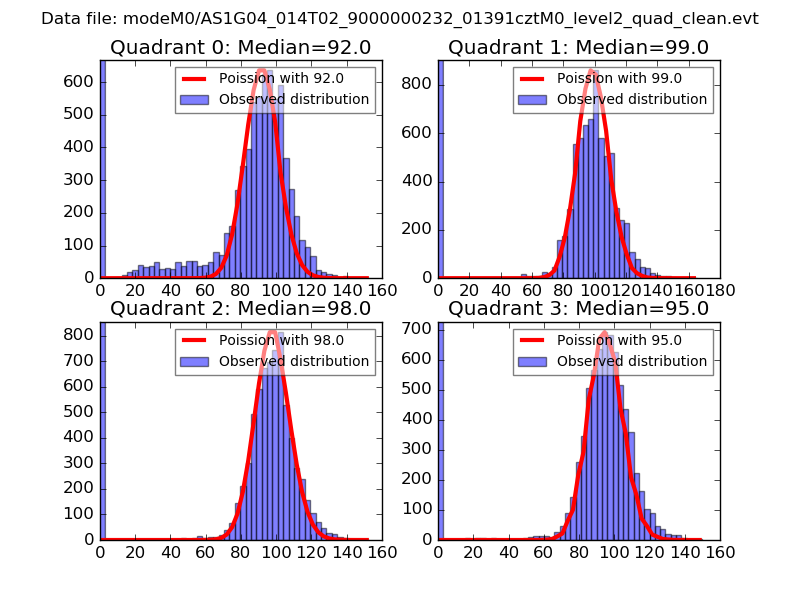 |
 |
| Quadrant-wise count rates Data is divided into 100 sec bins |
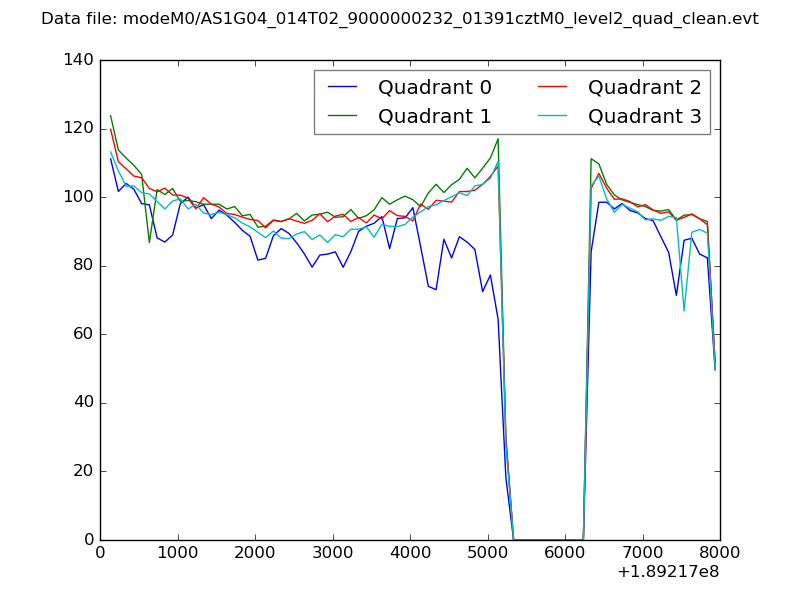 |
|
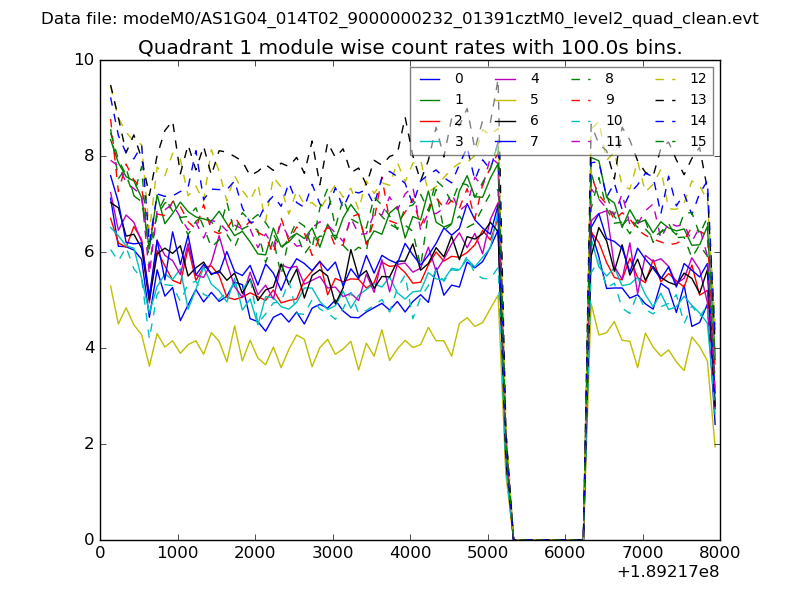
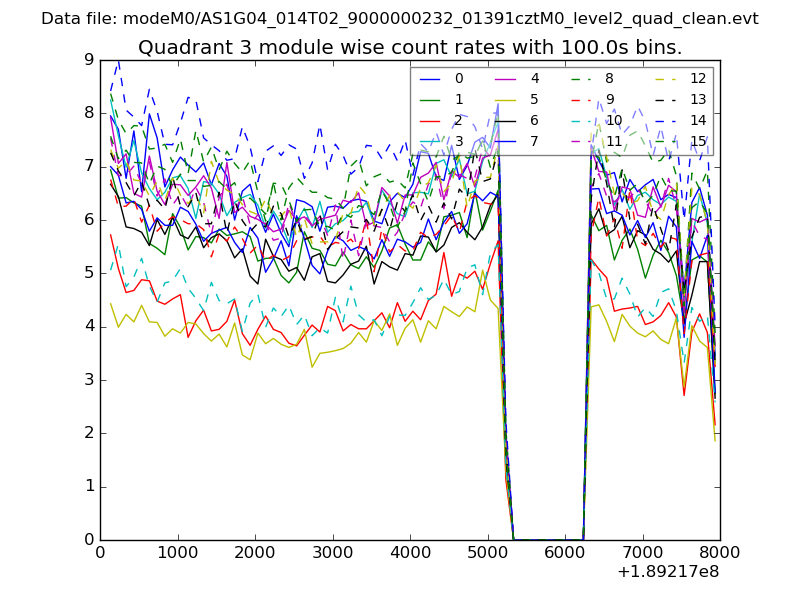
| Module-wise count rates for Quadrant A Data is divided into 100 sec bins |
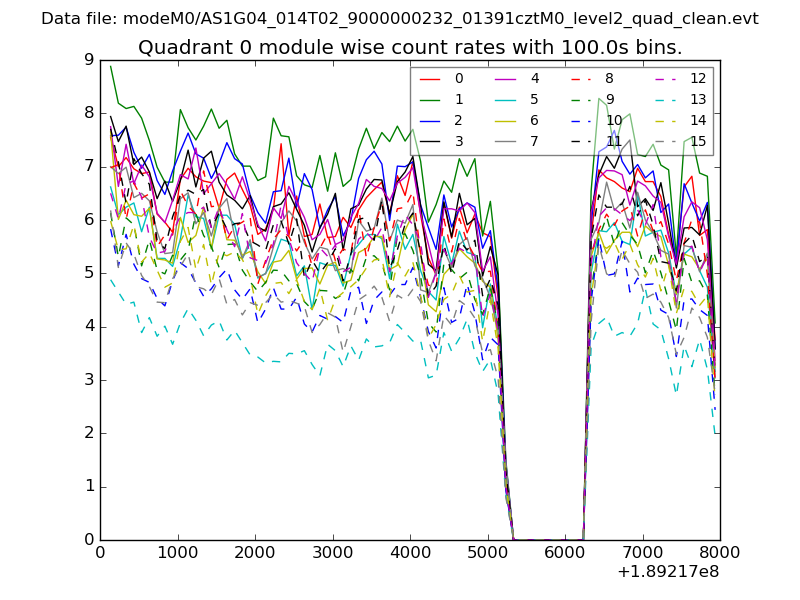 |
 |
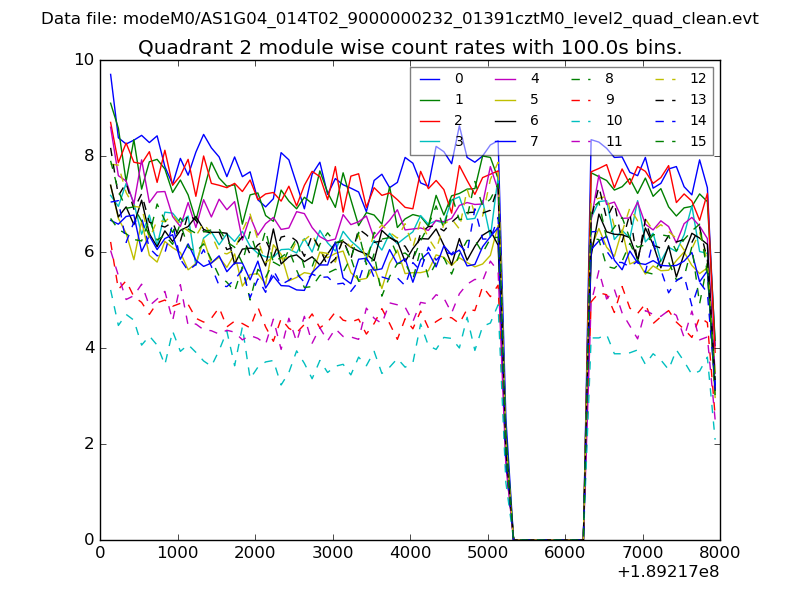
| Module-wise count rates for Quadrant B Data is divided into 100 sec bins |
 |
 |
| Module-wise count rates for Quadrant C Data is divided into 100 sec bins |
 |
 |
| Module-wise count rates for Quadrant D Data is divided into 100 sec bins |
 |
 |
| Parameter | Plot |
|---|---|
| CZT HV Monitor | 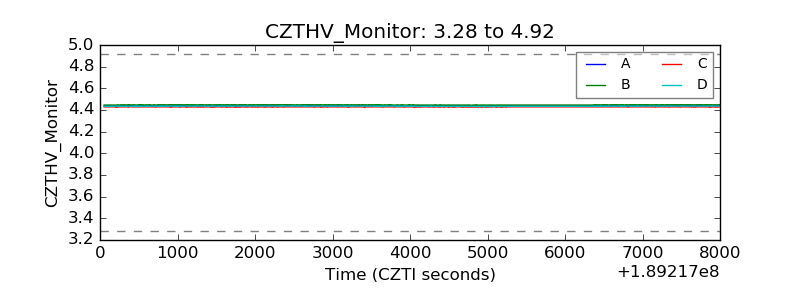 |
| D_VDD | 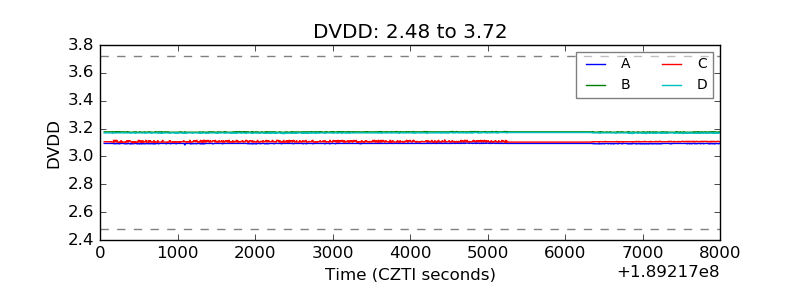 |
| Temperature 1 | 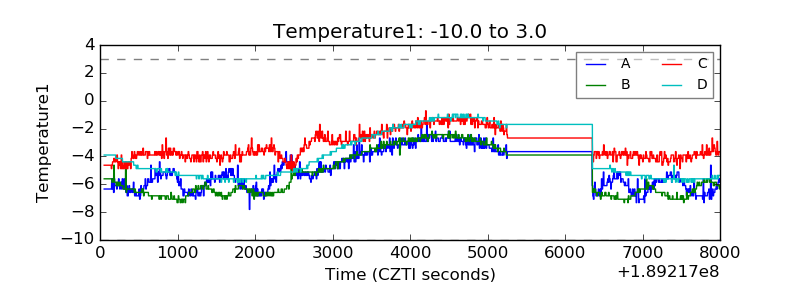 |
| Veto HV Monitor | 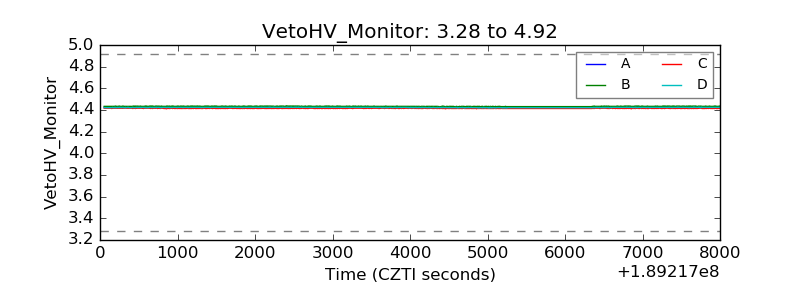 |
| Veto LLD | 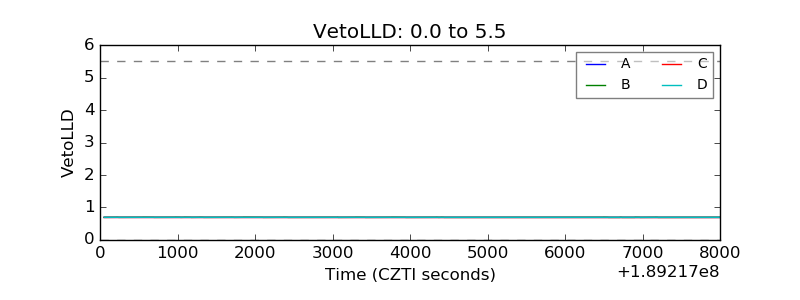 |
| Alpha Counter | 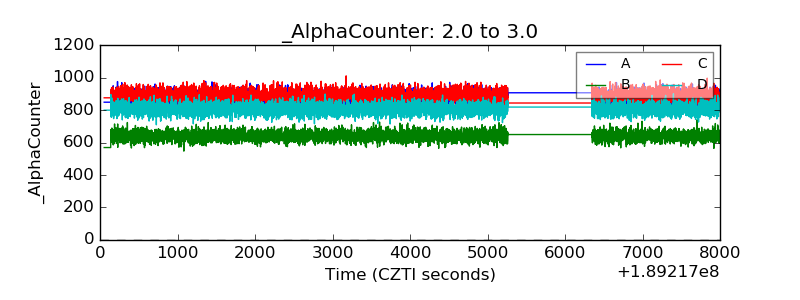 |
| _CPM_Rate | 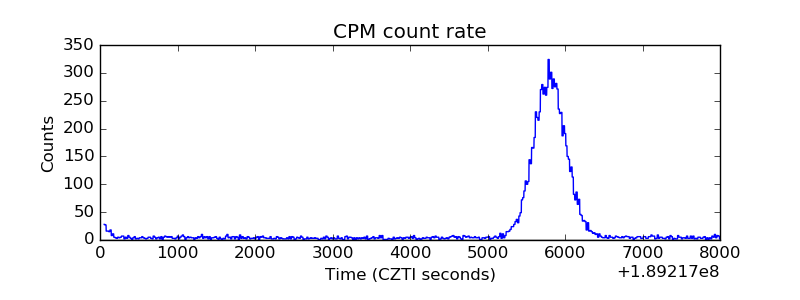 |
| CZT Counter | 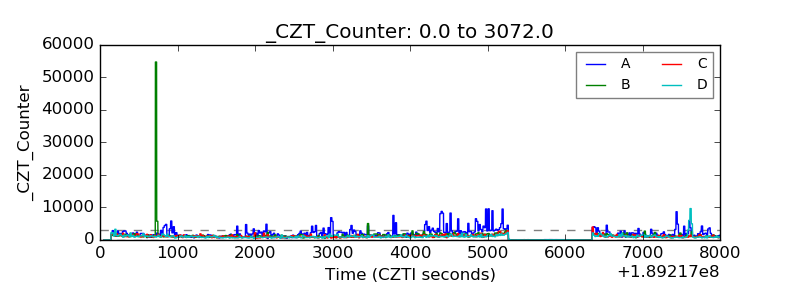 |
| +2.5 Volts monitor | 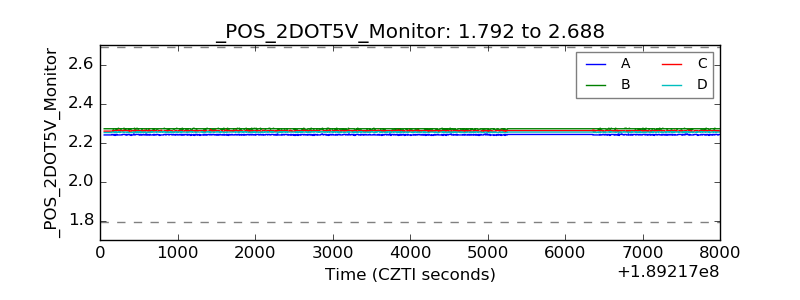 |
| +5 Volts monitor | 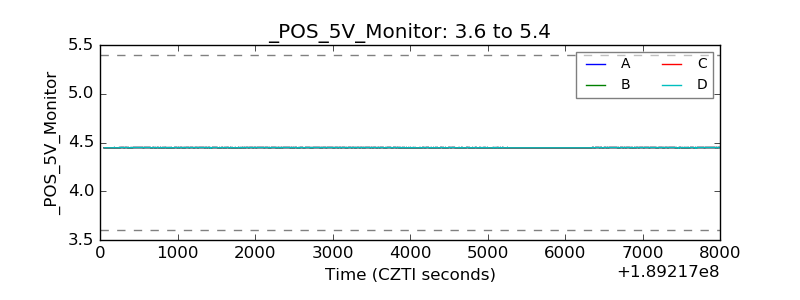 |
| _ROLL_ROT | 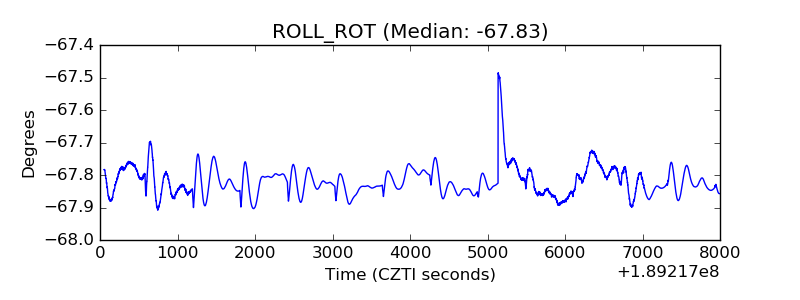 |
| _Roll_DEC | 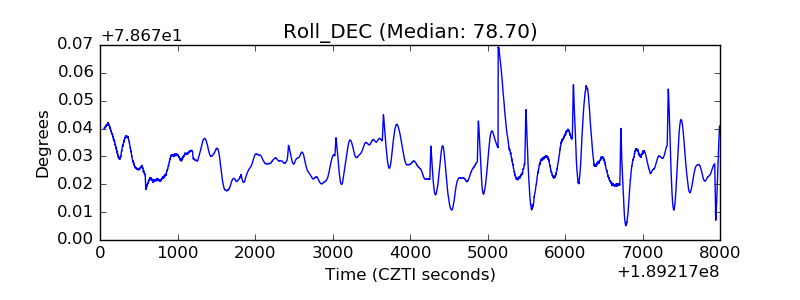 |
| _Roll_RA | 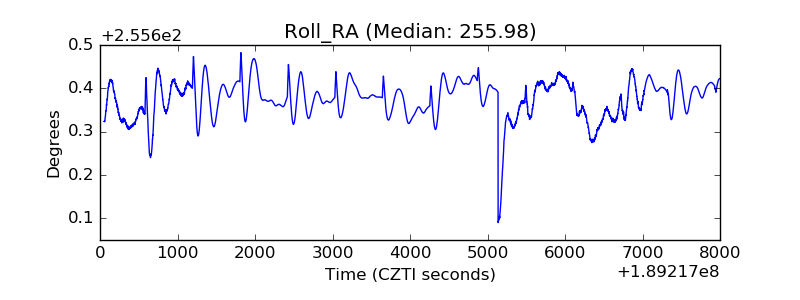 |
| Veto Counter | 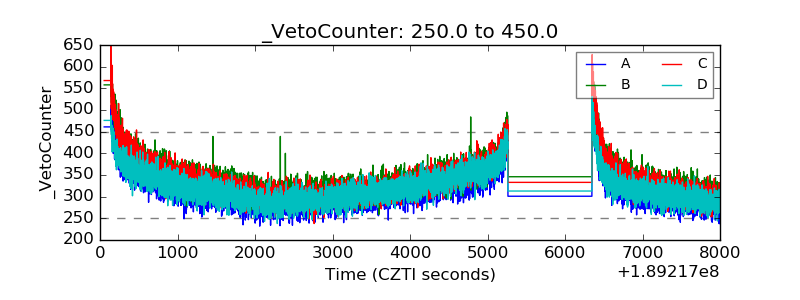 |