| Param | Original file | Final file |
|---|---|---|
| Filename | modeM0/AS1G04_014T02_9000000232_01392cztM0_level2.evt | modeM0/AS1G04_014T02_9000000232_01392cztM0_level2_quad_clean.evt |
| Size (bytes) | 1,116,622,080 | 94,798,080 |
| Size | 1.0 GB | 90.4 MB |
| Events in quadrant A | 11,036,611 | 585,900 |
| Events in quadrant B | 7,945,740 | 625,794 |
| Events in quadrant C | 7,252,357 | 612,949 |
| Events in quadrant D | 7,155,771 | 596,293 |
| Mode SS | |||
|---|---|---|---|
| Quadrant | BADHDUFLAG | Total packets | Discarded packets |
| A | 0 | 130 | 0 |
| B | 0 | 130 | 0 |
| C | 0 | 130 | 0 |
| D | 0 | 130 | 0 |
| Mode M0 | |||
|---|---|---|---|
| Quadrant | BADHDUFLAG | Total packets | Discarded packets |
| A | 0 | 37402 | 1 |
| B | 0 | 28172 | 0 |
| C | 0 | 26120 | 0 |
| D | 0 | 25887 | 0 |
| Mode M9 | |||
|---|---|---|---|
| Quadrant | BADHDUFLAG | Total packets | Discarded packets |
| A | 0 | 8 | 0 |
| B | 0 | 8 | 0 |
| C | 0 | 8 | 0 |
| D | 0 | 8 | 0 |
| Quadrant | Total seconds | Saturated seconds | Saturation percentage |
|---|---|---|---|
| A | 6450 | 551 | 8.542636% |
| B | 6450 | 14 | 0.217054% |
| C | 6450 | 3 | 0.046512% |
| D | 6450 | 70 | 1.085271% |
Noise dominated data is calculated using 1-second bins in cleaned event files. If a bin has >2000 counts, and if more than 50% of those come from <1% of pixels, then it is considered to be noise-dominated and hence unusable.
| Quadrant | # 1 sec bins | Bins with >0 counts | Bins with >2000 counts | High rate bins dominated by noise | Noise dominated (total time) | Noise dominated (detector-on time) | Marked lightcurve |
|---|---|---|---|---|---|---|---|
| A | 7185 | 6450 | 1708 | 1708 | 23.77% | 26.48% | 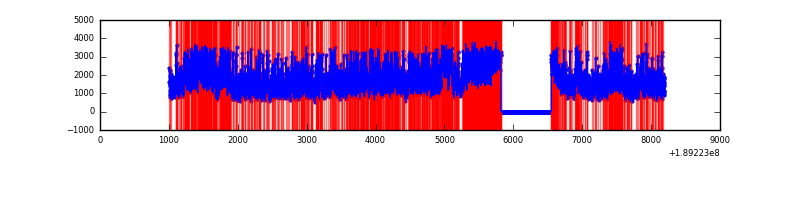 |
| B | 7185 | 6451 | 246 | 246 | 3.42% | 3.81% | 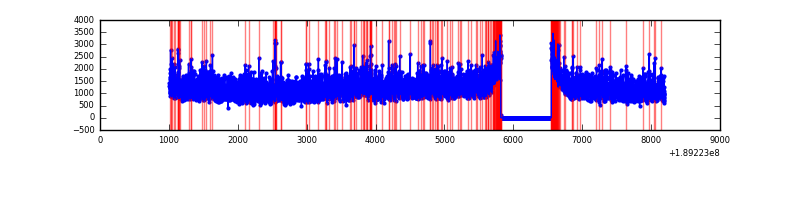 |
| C | 7185 | 6451 | 139 | 139 | 1.93% | 2.15% | 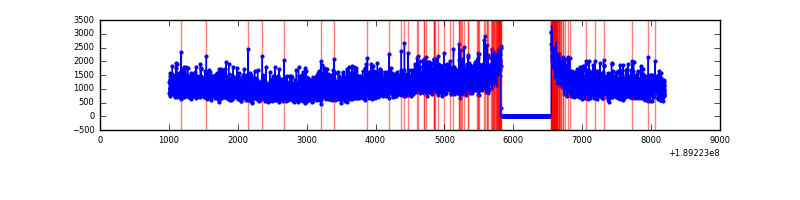 |
| D | 7185 | 6451 | 271 | 271 | 3.77% | 4.20% | 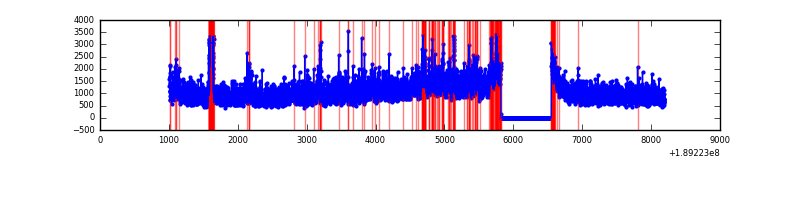 |
Top three noisy pixels from each quadrant. If the there are fewer than three noisy pixels in the level2.evt file, extra rows are filled as -1
| Pixel properties | Quadrant properties | ||||||
|---|---|---|---|---|---|---|---|
| Quadrant | DetID | PixID | Counts | Sigma | Mean | Median | Sigma |
| A | 15 | 127 | 3804326 | 8549.49 | 1854 | 1869 | 444.8 |
| A | 4 | 32 | 108327 | 239.36 | 1854 | 1869 | 444.8 |
| A | 3 | 80 | 8575 | 15.08 | 1854 | 1869 | 444.8 |
| B | 12 | 52 | 119132 | 246.5 | 1999 | 2009 | 475.1 |
| B | 6 | 53 | 61241 | 124.66 | 1999 | 2009 | 475.1 |
| B | 8 | 219 | 51958 | 105.13 | 1999 | 2009 | 475.1 |
| C | 15 | 241 | 227319 | 452.69 | 1784 | 1842 | 498.1 |
| C | 7 | 220 | 24812 | 46.12 | 1784 | 1842 | 498.1 |
| C | 3 | 111 | 20035 | 36.53 | 1784 | 1842 | 498.1 |
| D | 9 | 53 | 225345 | 429.21 | 1718 | 1770 | 520.9 |
| D | 2 | 16 | 212864 | 405.25 | 1718 | 1770 | 520.9 |
| D | 1 | 83 | 200683 | 381.86 | 1718 | 1770 | 520.9 |
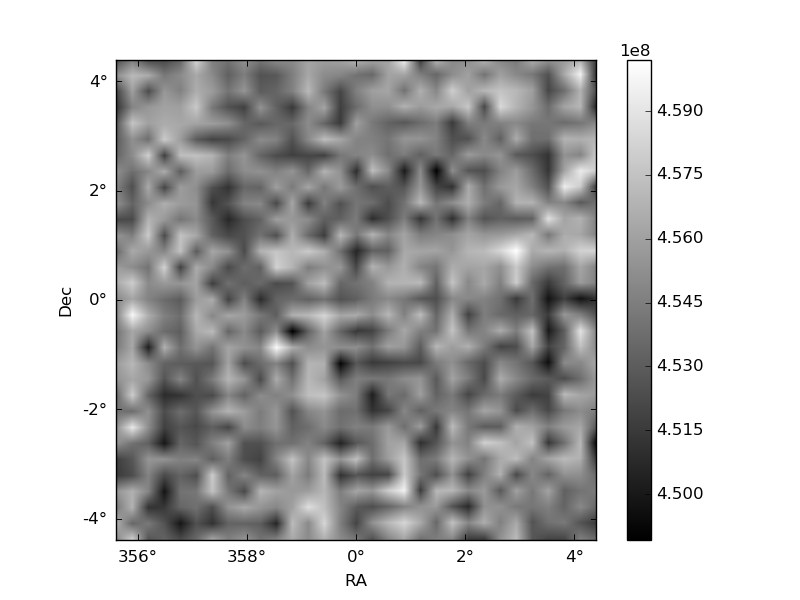
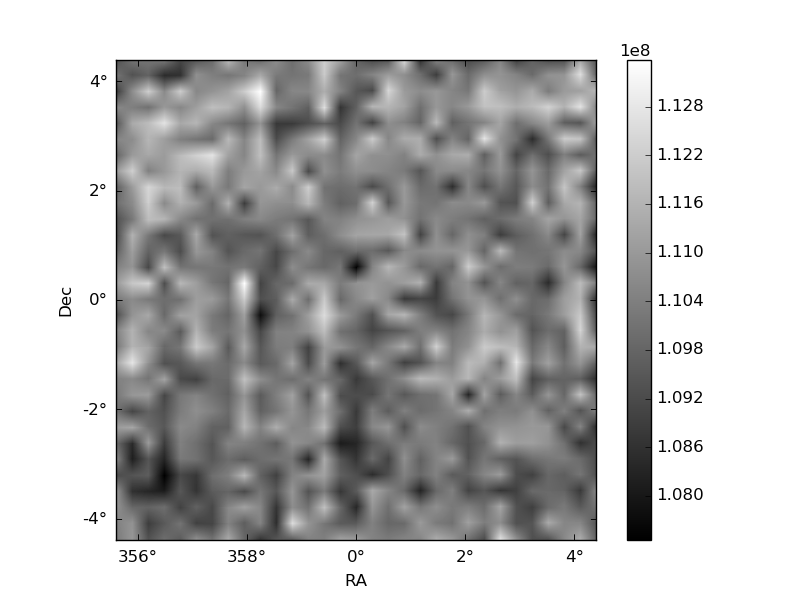
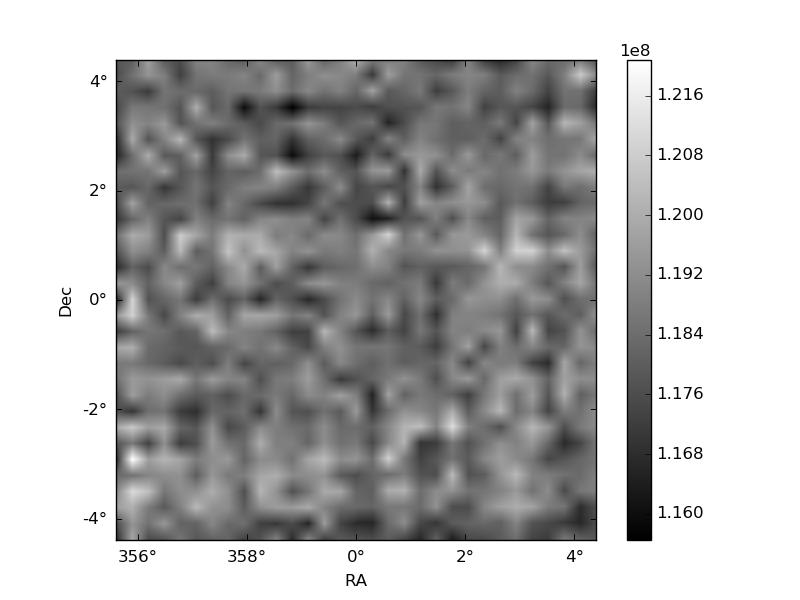
Histogram calculated using DETX and DETY for each event in the final _common_clean file
| Quadrant A | 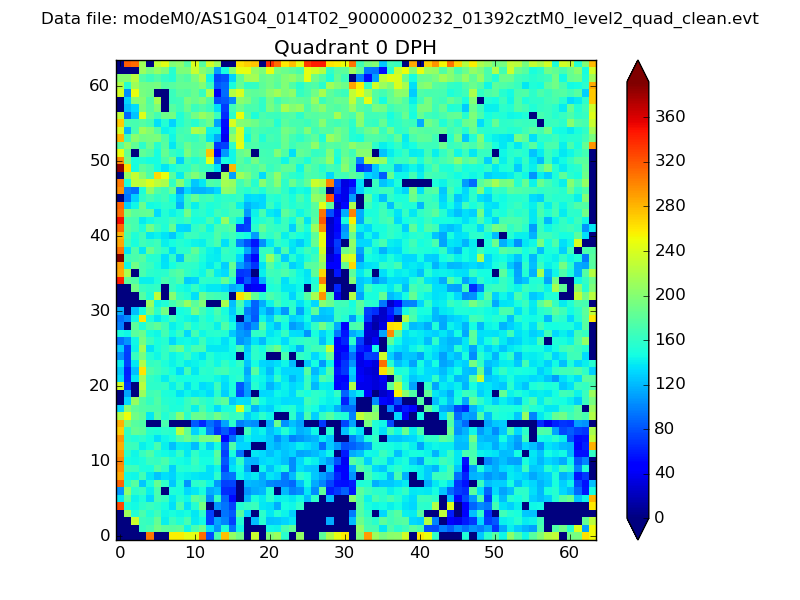 |
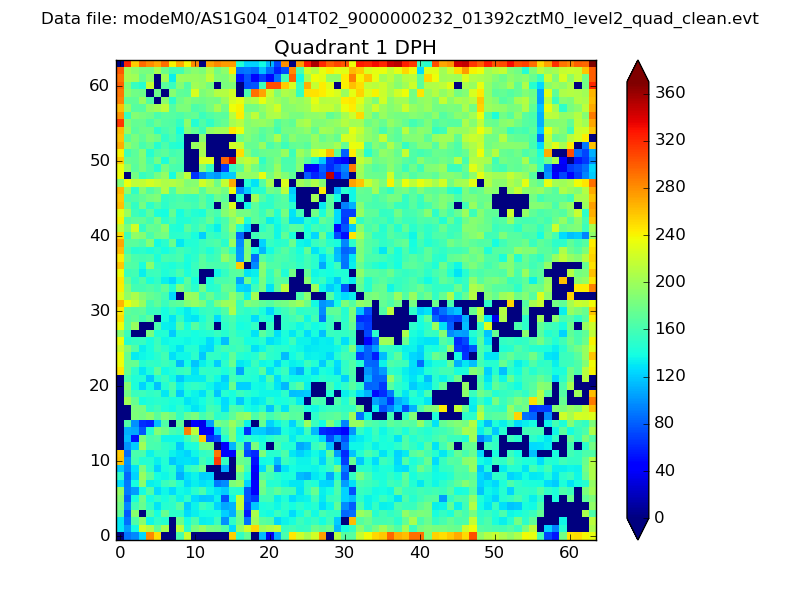 |
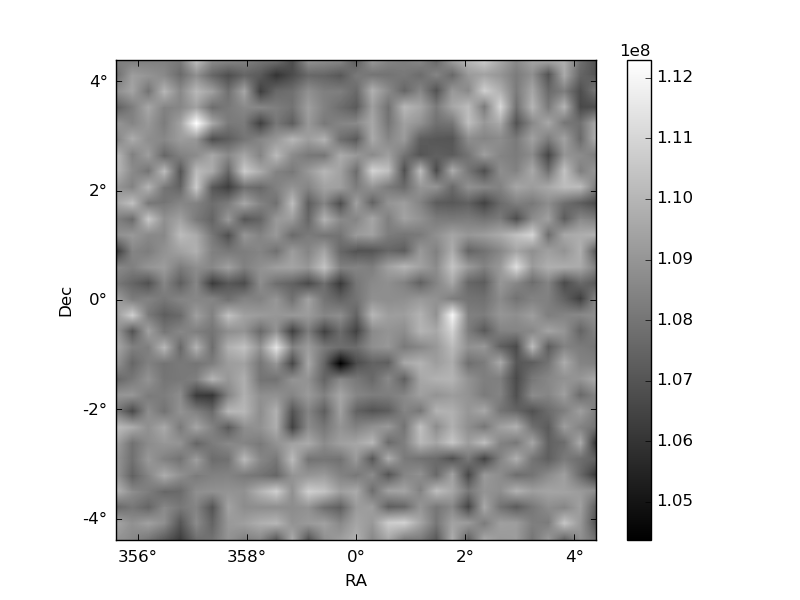
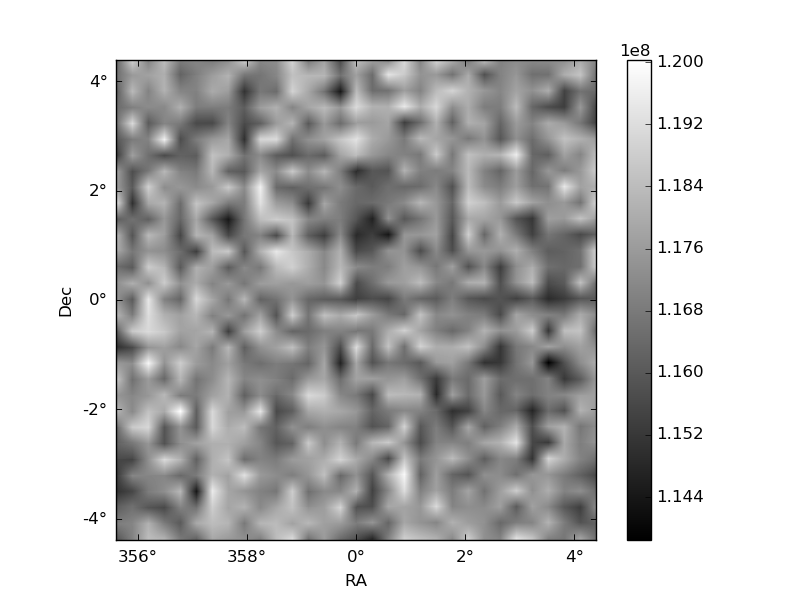
Quadrant B |
|---|---|---|---|
| Quadrant D | 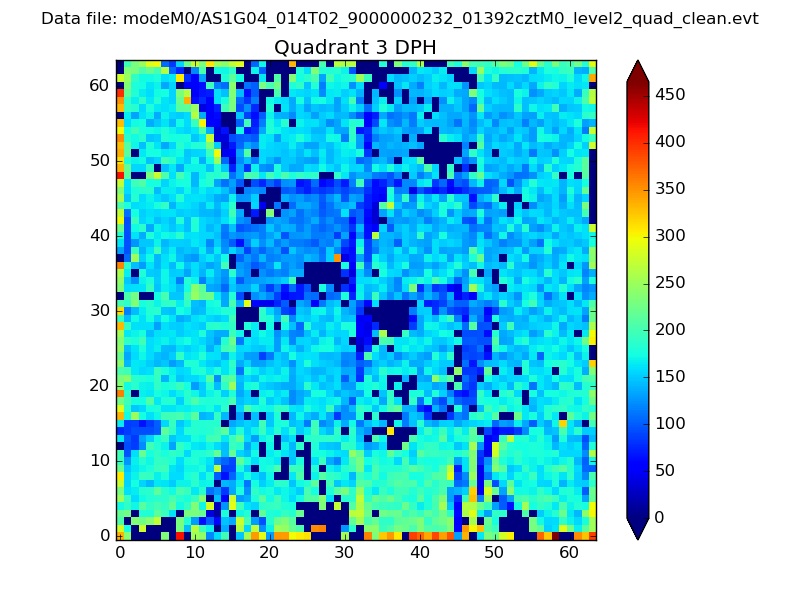 |
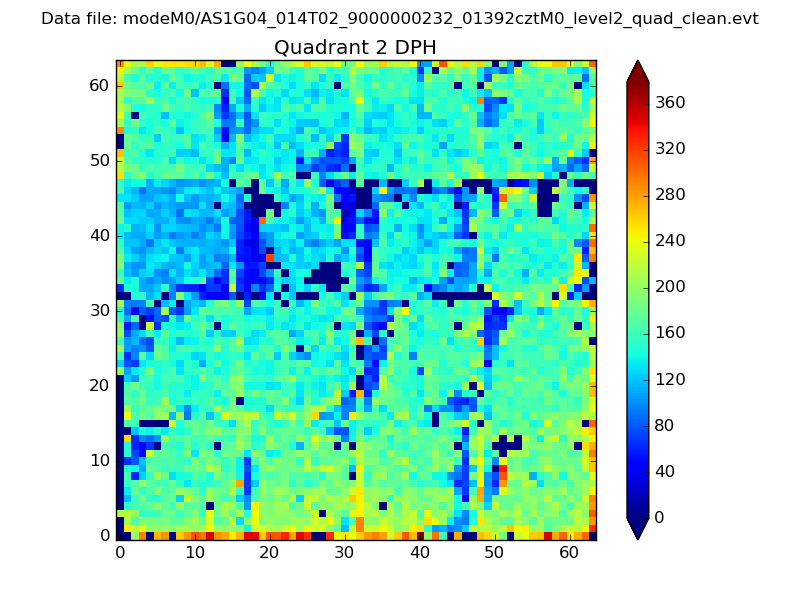 |
Quadrant C |
| Plot type | Count rate plots | Images |
|---|---|---|
| Comparison with Poisson distribution Blue bars denote a histogram of data divided into 1 sec bins. Red curve is a Poisson curve with rate = median count rate of data. |
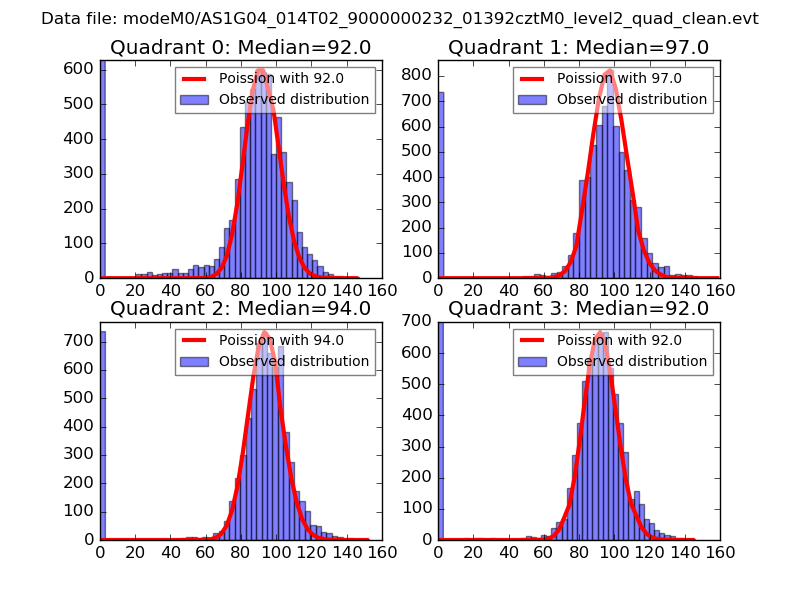 |
 |
| Quadrant-wise count rates Data is divided into 100 sec bins |
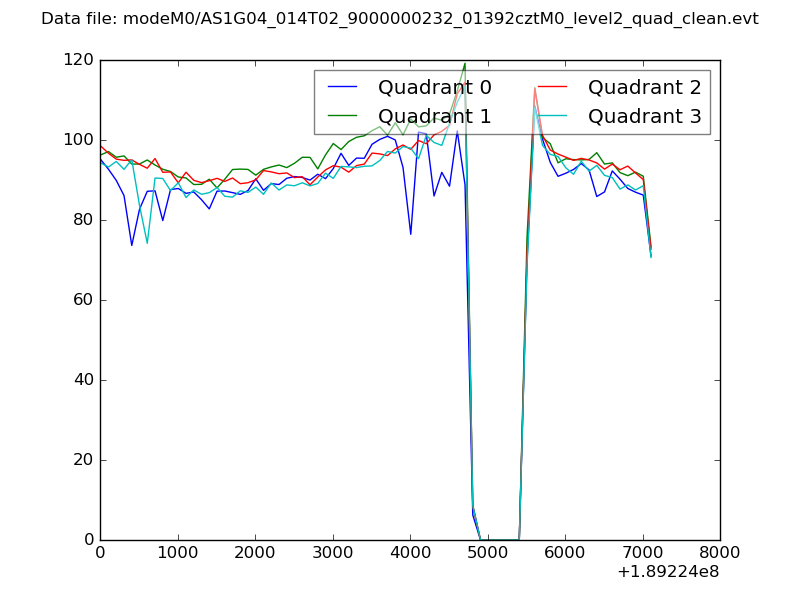 |
|
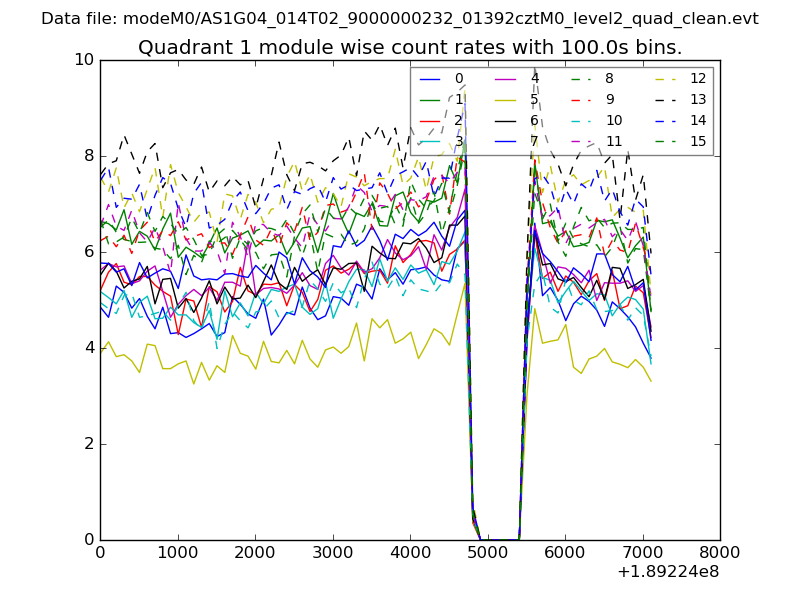
| Module-wise count rates for Quadrant A Data is divided into 100 sec bins |
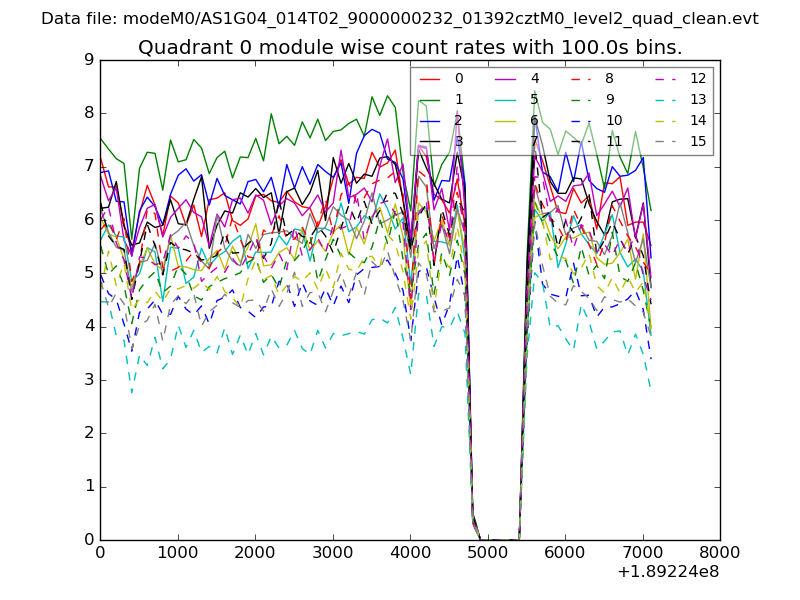 |
 |
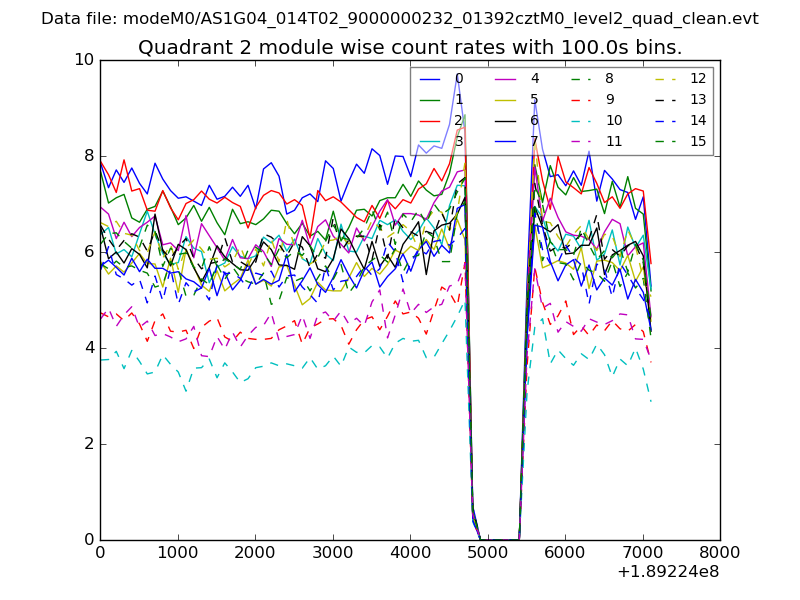
| Module-wise count rates for Quadrant B Data is divided into 100 sec bins |
 |
 |
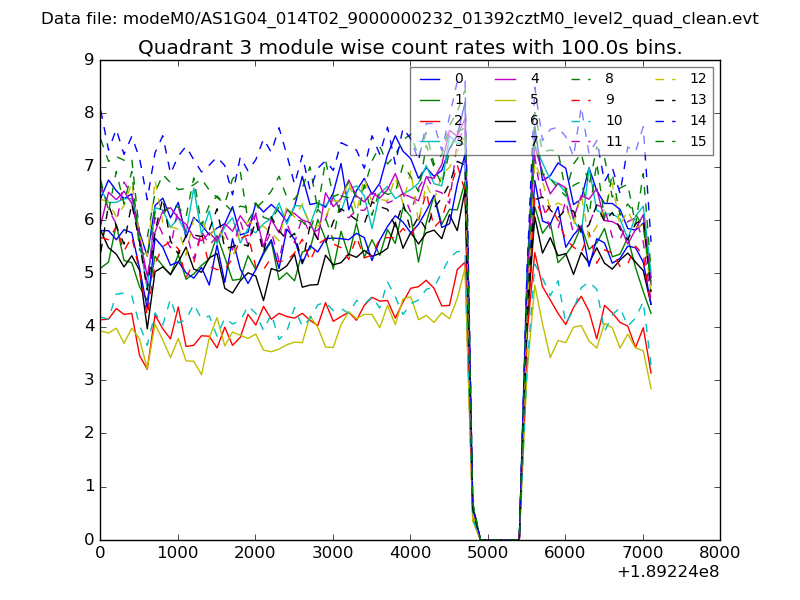
| Module-wise count rates for Quadrant C Data is divided into 100 sec bins |
 |
 |
| Module-wise count rates for Quadrant D Data is divided into 100 sec bins |
 |
 |
| Parameter | Plot |
|---|---|
| CZT HV Monitor | 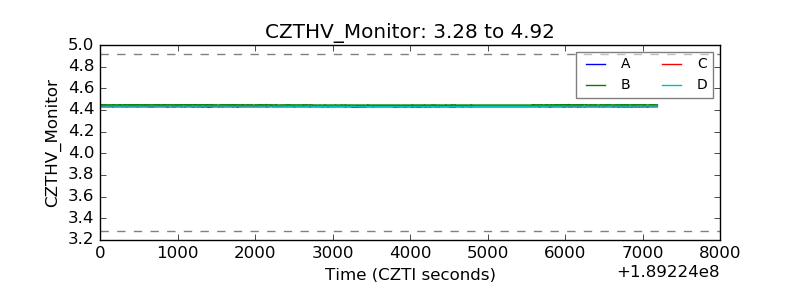 |
| D_VDD | 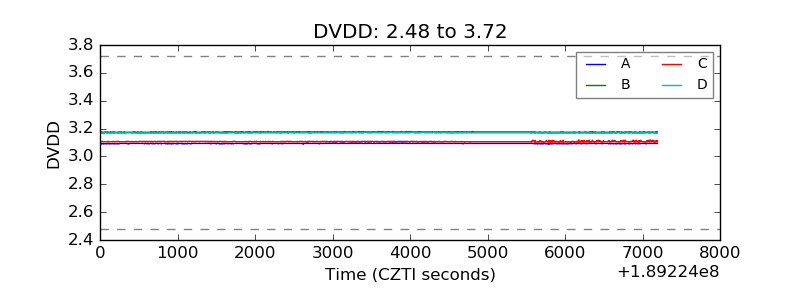 |
| Temperature 1 | 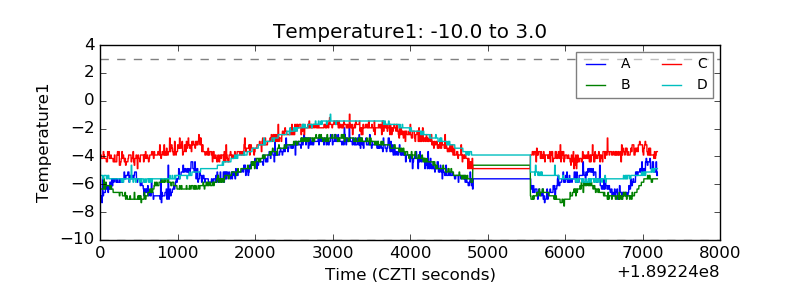 |
| Veto HV Monitor | 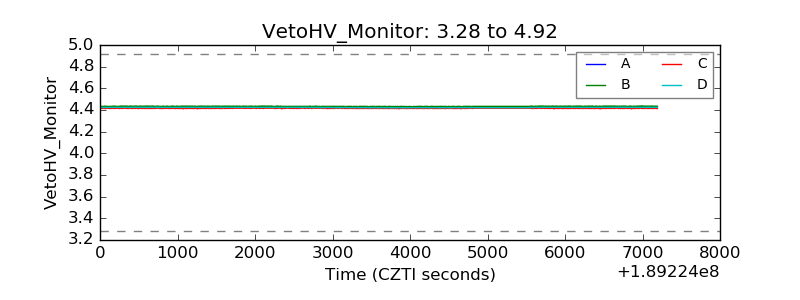 |
| Veto LLD | 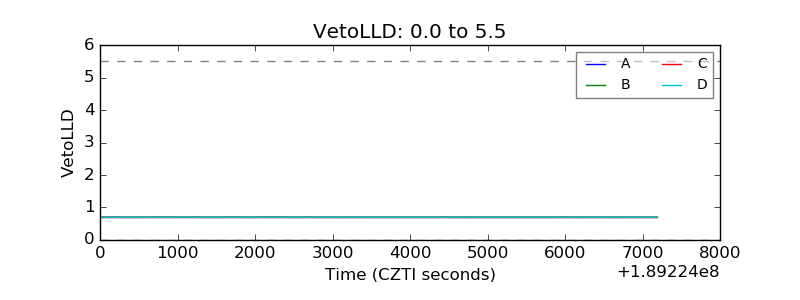 |
| Alpha Counter | 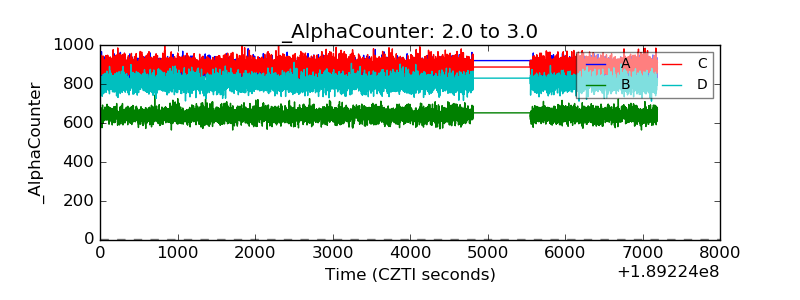 |
| _CPM_Rate | 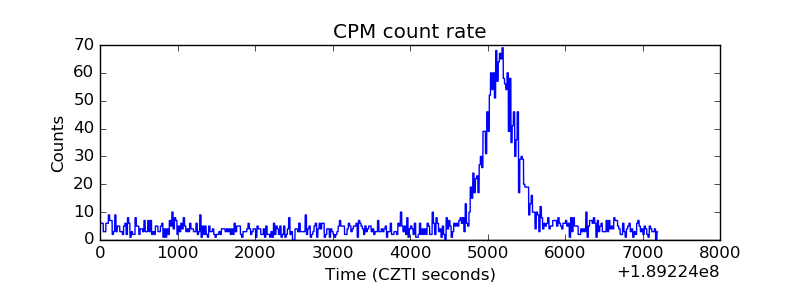 |
| CZT Counter | 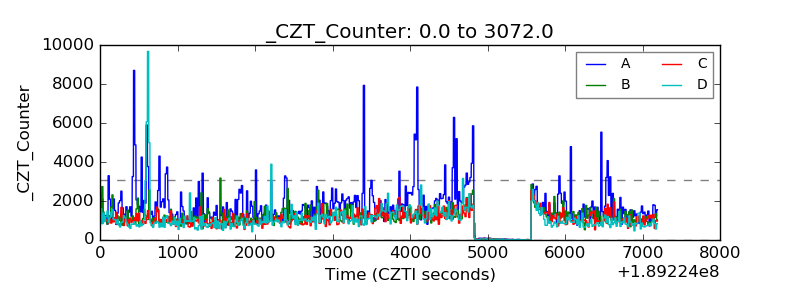 |
| +2.5 Volts monitor | 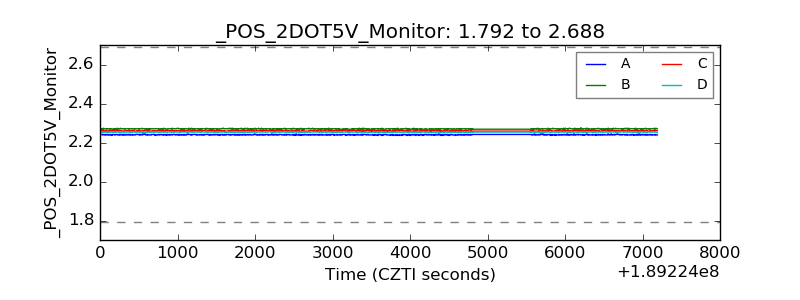 |
| +5 Volts monitor | 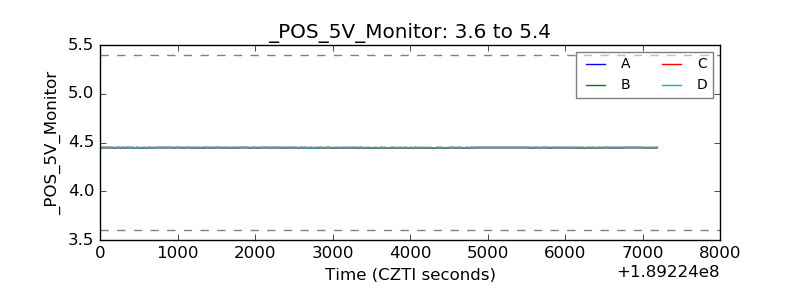 |
| _ROLL_ROT | 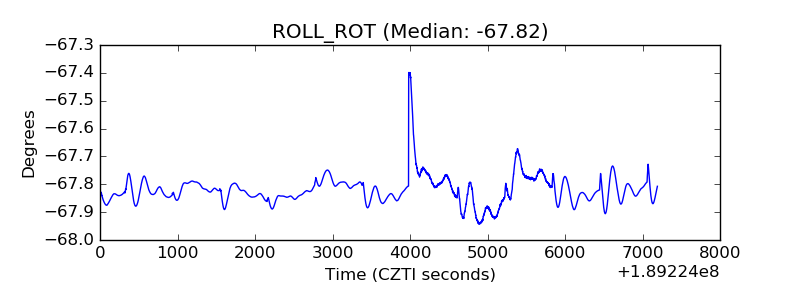 |
| _Roll_DEC | 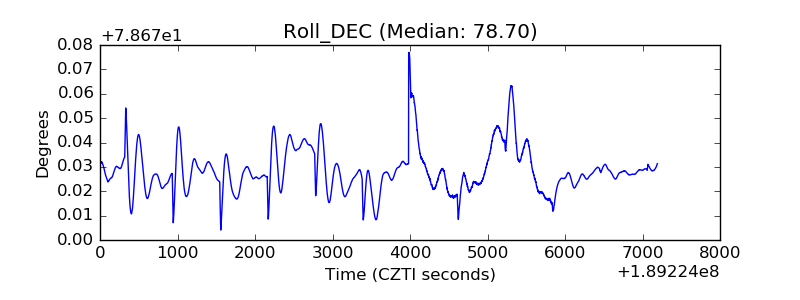 |
| _Roll_RA | 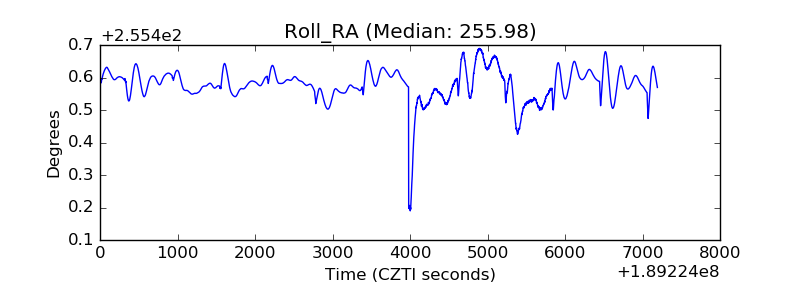 |
| Veto Counter | 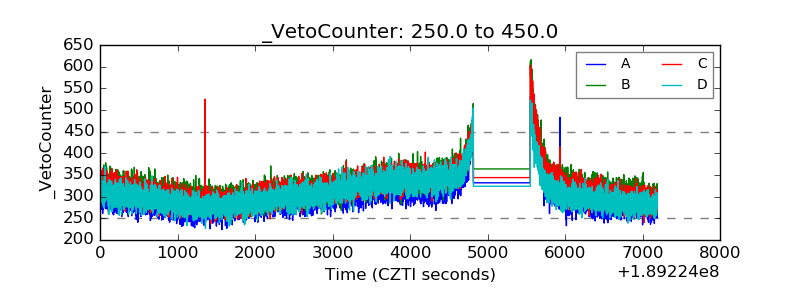 |