| Param | Original file | Final file |
|---|---|---|
| Filename | modeM0/AS1G04_014T02_9000000232_01393cztM0_level2.evt | modeM0/AS1G04_014T02_9000000232_01393cztM0_level2_quad_clean.evt |
| Size (bytes) | 1,367,838,720 | 108,204,480 |
| Size | 1.3 GB | 103.2 MB |
| Events in quadrant A | 14,212,442 | 644,715 |
| Events in quadrant B | 10,057,639 | 717,872 |
| Events in quadrant C | 8,686,550 | 705,957 |
| Events in quadrant D | 7,977,793 | 690,265 |
| Mode SS | |||
|---|---|---|---|
| Quadrant | BADHDUFLAG | Total packets | Discarded packets |
| A | 0 | 152 | 0 |
| B | 0 | 152 | 0 |
| C | 0 | 152 | 0 |
| D | 0 | 152 | 0 |
| Mode M0 | |||
|---|---|---|---|
| Quadrant | BADHDUFLAG | Total packets | Discarded packets |
| A | 0 | 47616 | 3 |
| B | 0 | 35157 | 2 |
| C | 0 | 31099 | 2 |
| D | 0 | 29012 | 2 |
| Mode M9 | |||
|---|---|---|---|
| Quadrant | BADHDUFLAG | Total packets | Discarded packets |
| A | 0 | 1 | 0 |
| B | 0 | 1 | 0 |
| C | 0 | 1 | 0 |
| D | 0 | 1 | 0 |
| Quadrant | Total seconds | Saturated seconds | Saturation percentage |
|---|---|---|---|
| A | 7433 | 1284 | 17.274317% |
| B | 7433 | 95 | 1.278084% |
| C | 7433 | 8 | 0.107628% |
| D | 7433 | 23 | 0.309431% |
Noise dominated data is calculated using 1-second bins in cleaned event files. If a bin has >2000 counts, and if more than 50% of those come from <1% of pixels, then it is considered to be noise-dominated and hence unusable.
| Quadrant | # 1 sec bins | Bins with >0 counts | Bins with >2000 counts | High rate bins dominated by noise | Noise dominated (total time) | Noise dominated (detector-on time) | Marked lightcurve |
|---|---|---|---|---|---|---|---|
| A | 7633 | 7433 | 2879 | 2879 | 37.72% | 38.73% | 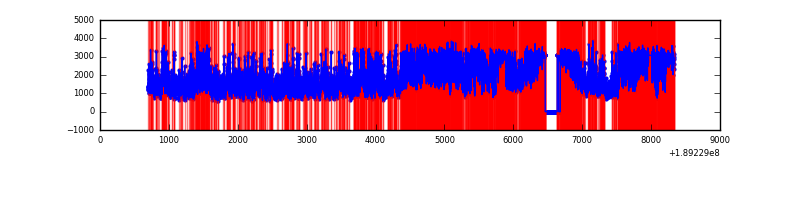 |
| B | 7633 | 7435 | 657 | 657 | 8.61% | 8.84% | 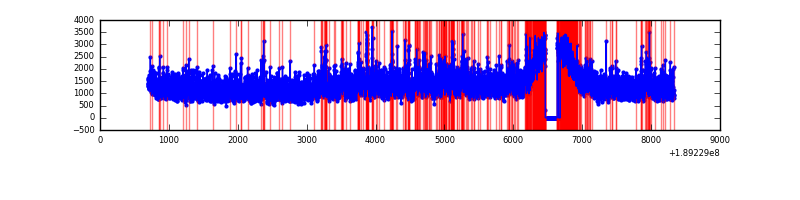 |
| C | 7633 | 7435 | 312 | 312 | 4.09% | 4.20% | 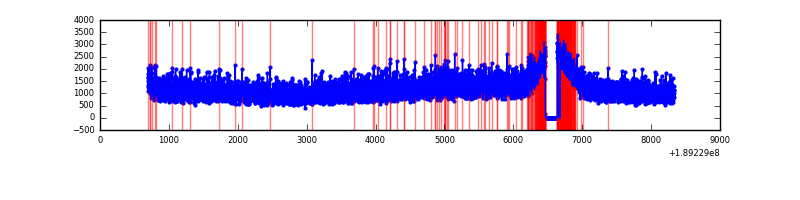 |
| D | 7633 | 7435 | 254 | 254 | 3.33% | 3.42% | 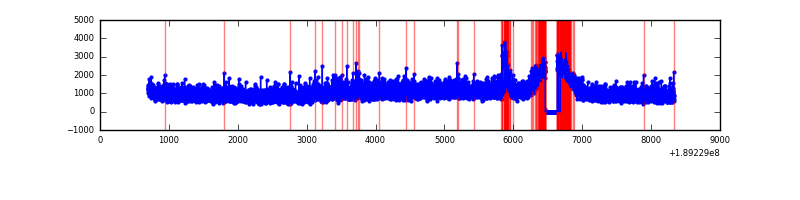 |
Top three noisy pixels from each quadrant. If the there are fewer than three noisy pixels in the level2.evt file, extra rows are filled as -1
| Pixel properties | Quadrant properties | ||||||
|---|---|---|---|---|---|---|---|
| Quadrant | DetID | PixID | Counts | Sigma | Mean | Median | Sigma |
| A | 15 | 127 | 4727979 | 9100.43 | 2158 | 2169 | 519.3 |
| A | 4 | 32 | 1165457 | 2240.13 | 2158 | 2169 | 519.3 |
| A | 13 | 17 | 29340 | 52.32 | 2158 | 2169 | 519.3 |
| B | 8 | 4 | 505342 | 874.99 | 2406 | 2421 | 574.8 |
| B | 6 | 53 | 176970 | 303.68 | 2406 | 2421 | 574.8 |
| B | 12 | 52 | 118616 | 202.16 | 2406 | 2421 | 574.8 |
| C | 15 | 241 | 260040 | 430.88 | 2139 | 2213 | 598.4 |
| C | 3 | 111 | 26785 | 41.06 | 2139 | 2213 | 598.4 |
| C | 7 | 220 | 26351 | 40.34 | 2139 | 2213 | 598.4 |
| D | 13 | 205 | 104048 | 157.45 | 2064 | 2139 | 647.2 |
| D | 9 | 53 | 98291 | 148.56 | 2064 | 2139 | 647.2 |
| D | 5 | 82 | 18726 | 25.63 | 2064 | 2139 | 647.2 |
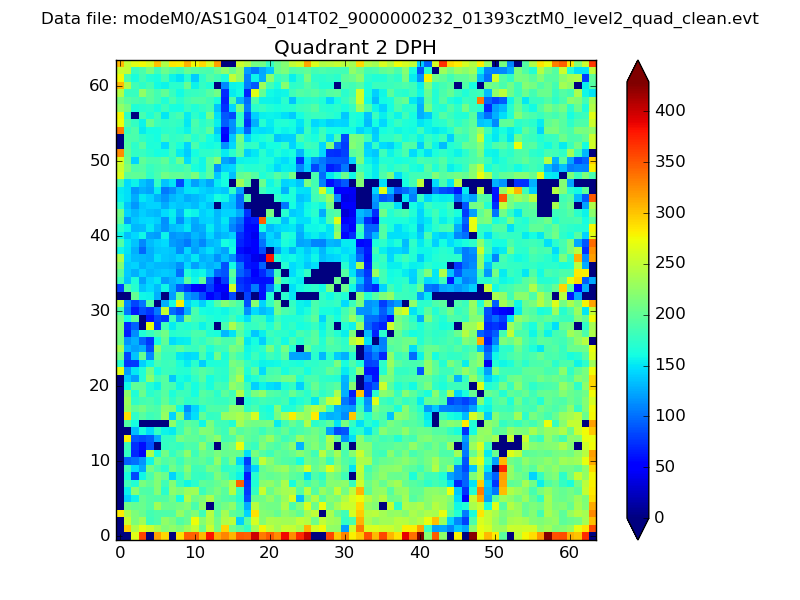
Histogram calculated using DETX and DETY for each event in the final _common_clean file
| Quadrant A | 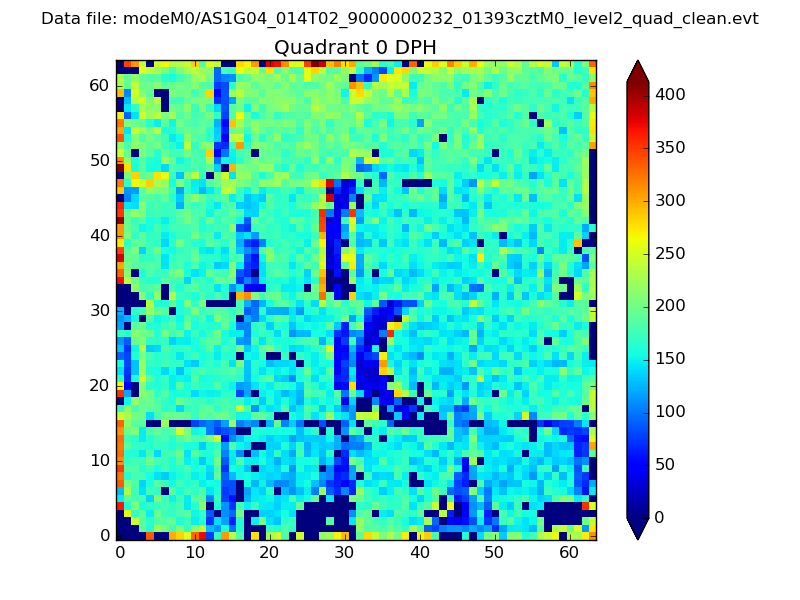 |
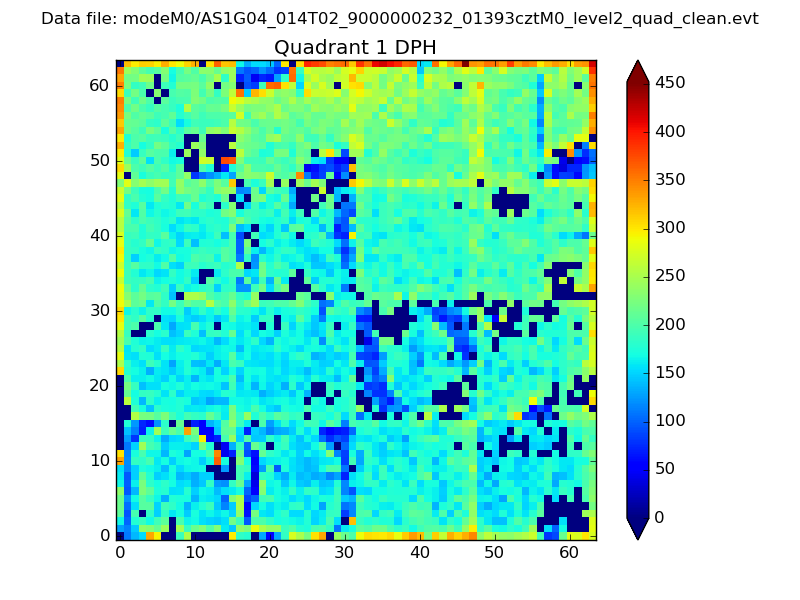 |
Quadrant B |
|---|---|---|---|
| Quadrant D | 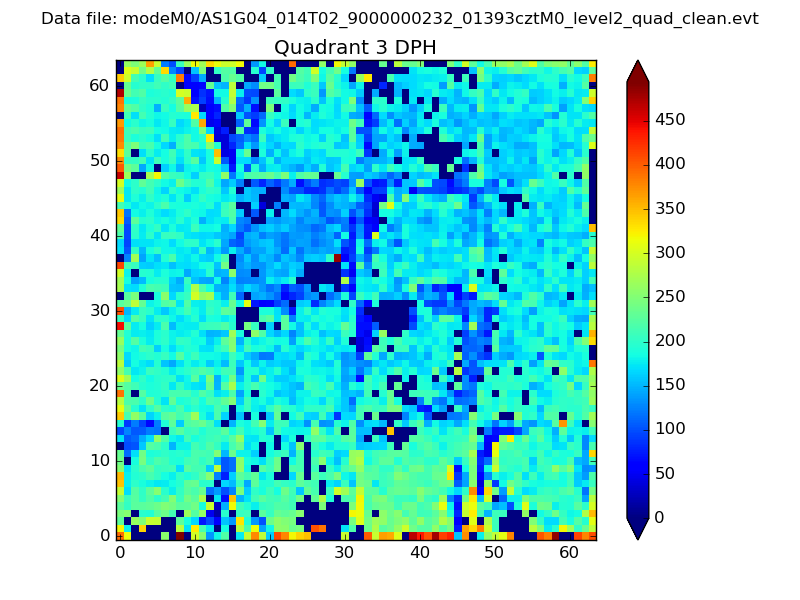 |
 |
Quadrant C |
| Plot type | Count rate plots | Images |
|---|---|---|
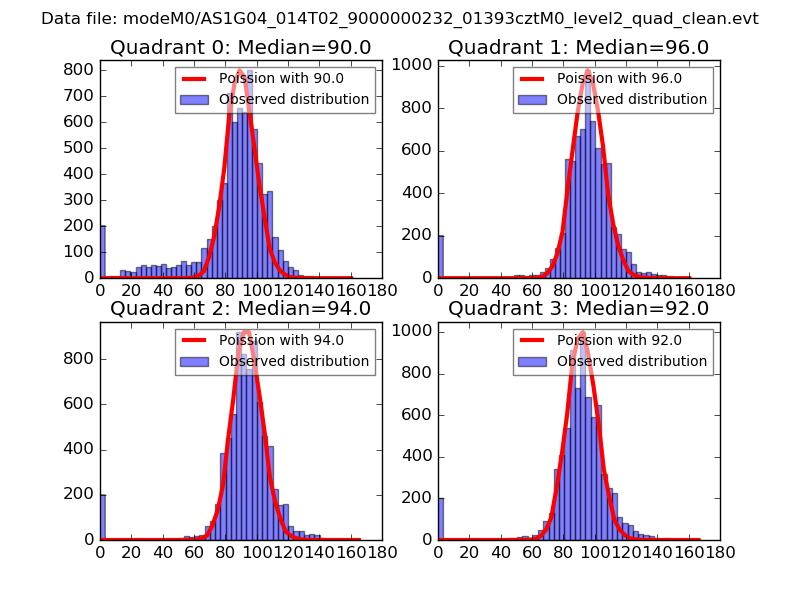
| Comparison with Poisson distribution Blue bars denote a histogram of data divided into 1 sec bins. Red curve is a Poisson curve with rate = median count rate of data. |
 |
 |
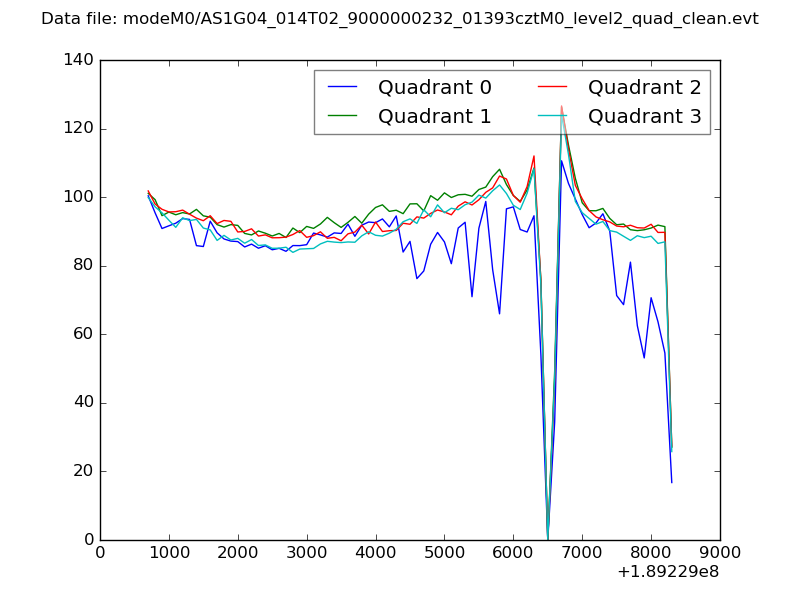
| Quadrant-wise count rates Data is divided into 100 sec bins |
 |
|
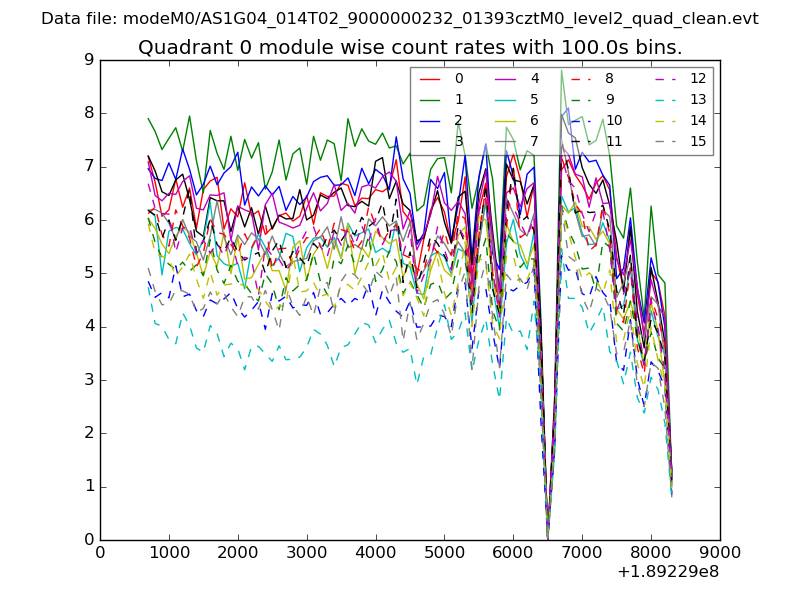
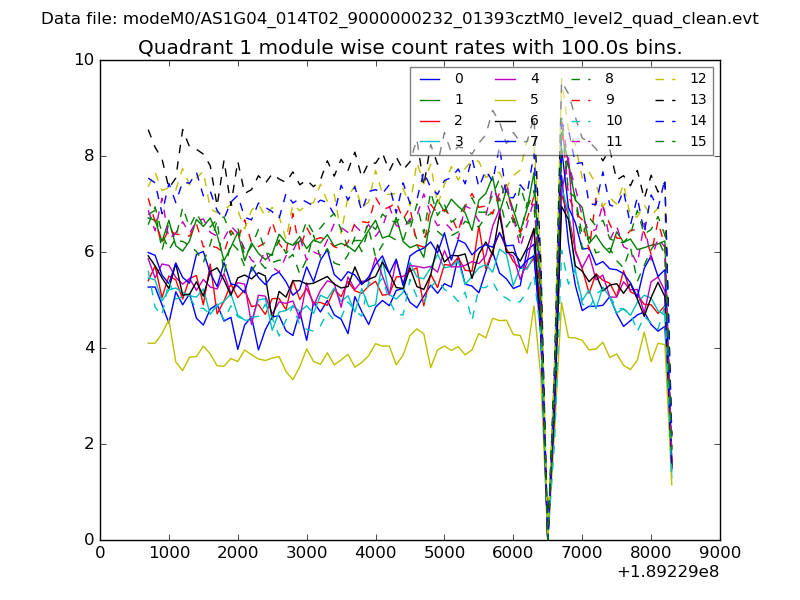
| Module-wise count rates for Quadrant A Data is divided into 100 sec bins |
 |
 |
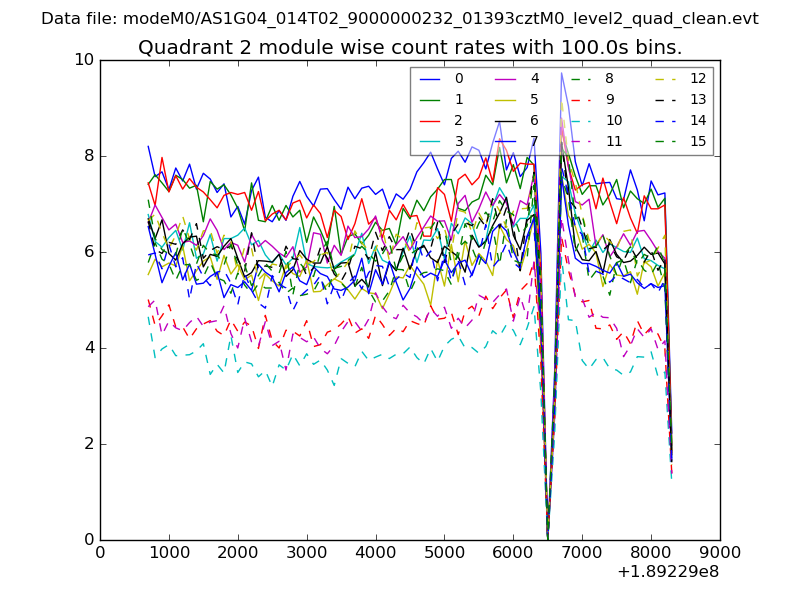
| Module-wise count rates for Quadrant B Data is divided into 100 sec bins |
 |
 |
| Module-wise count rates for Quadrant C Data is divided into 100 sec bins |
 |
 |
| Module-wise count rates for Quadrant D Data is divided into 100 sec bins |
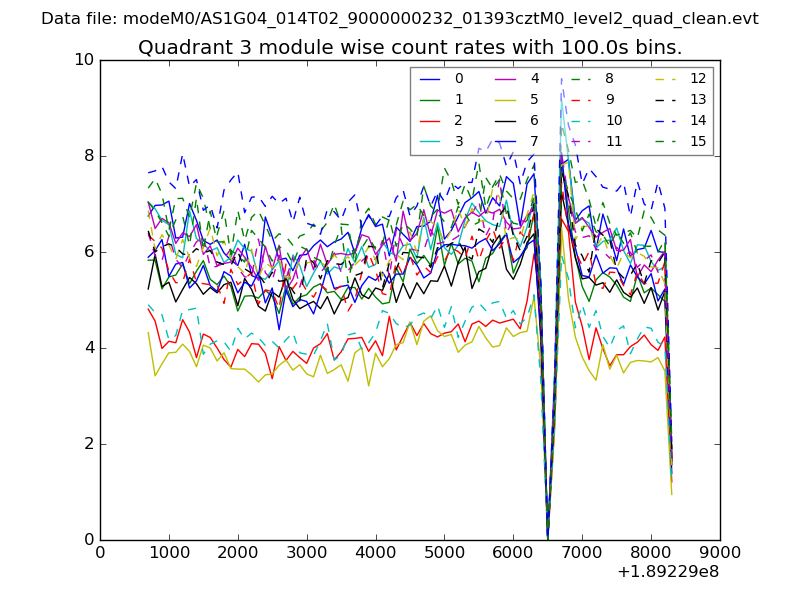 |
 |
| Parameter | Plot |
|---|---|
| CZT HV Monitor | 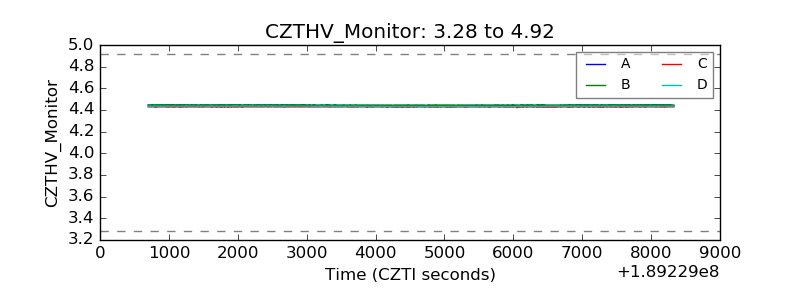 |
| D_VDD | 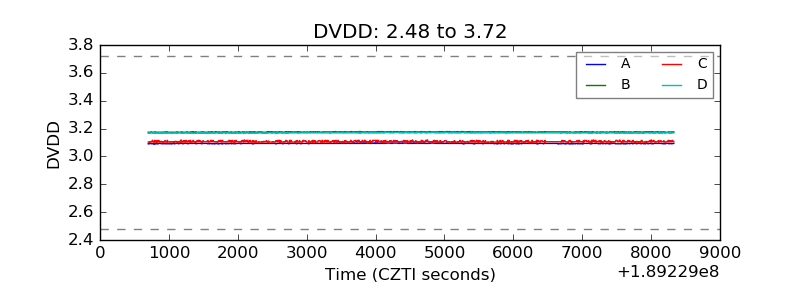 |
| Temperature 1 | 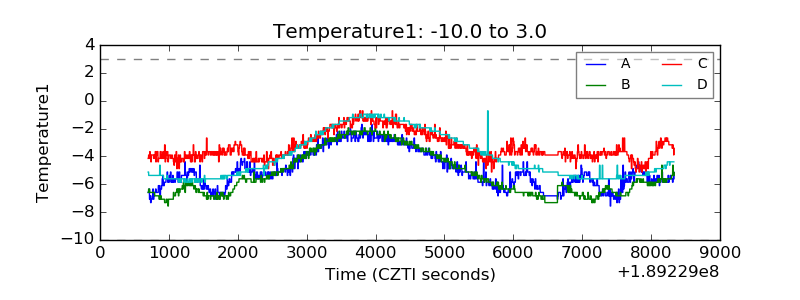 |
| Veto HV Monitor | 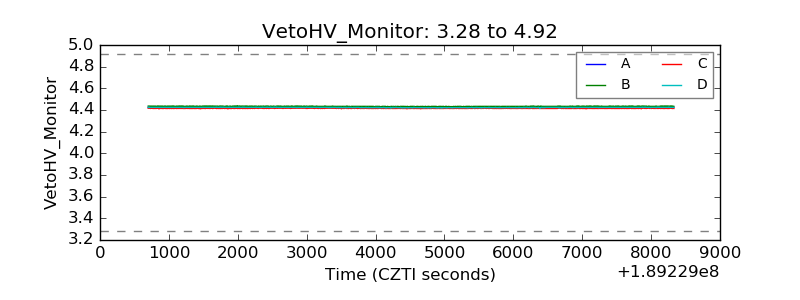 |
| Veto LLD | 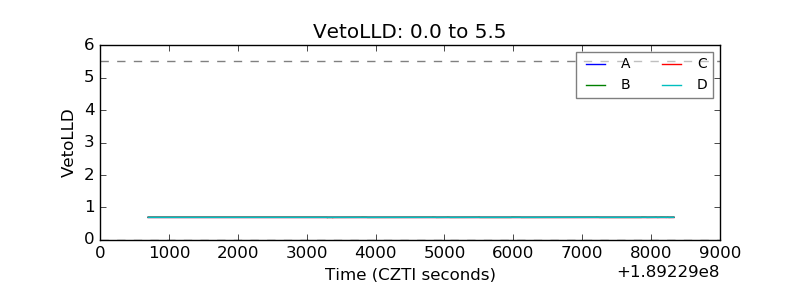 |
| Alpha Counter | 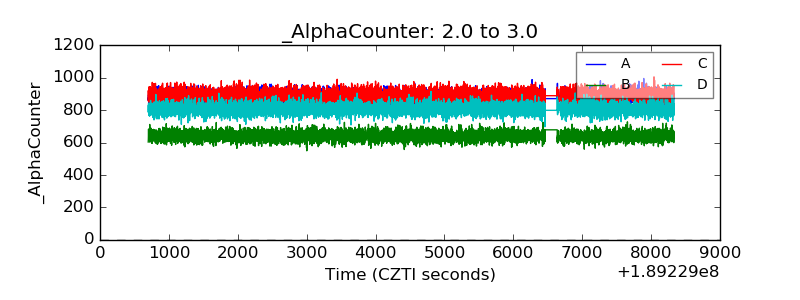 |
| _CPM_Rate | 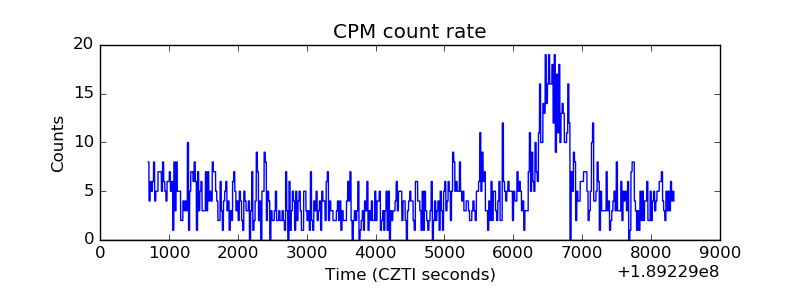 |
| CZT Counter | 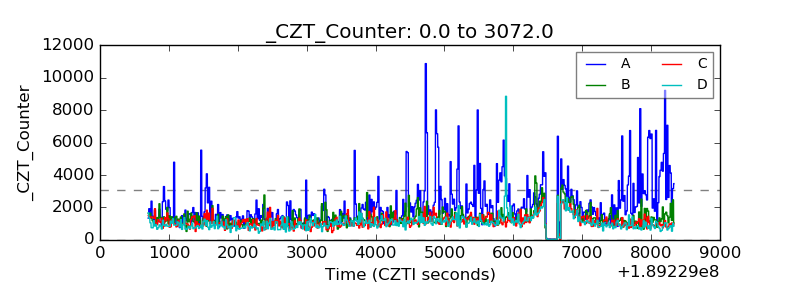 |
| +2.5 Volts monitor |  |
| +5 Volts monitor | 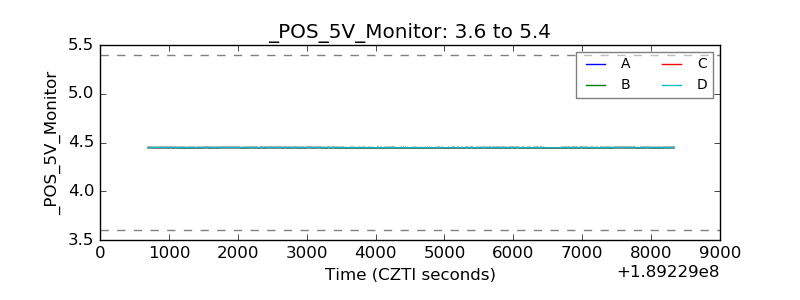 |
| _ROLL_ROT | 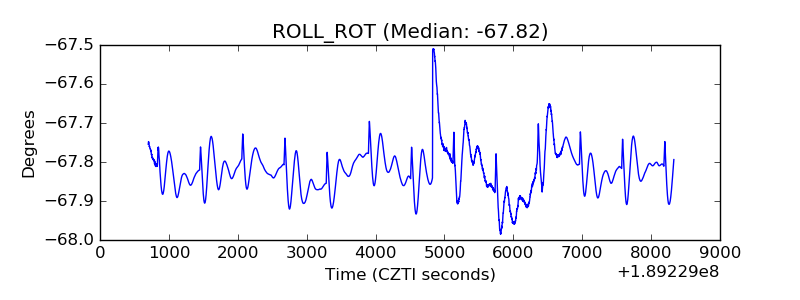 |
| _Roll_DEC | 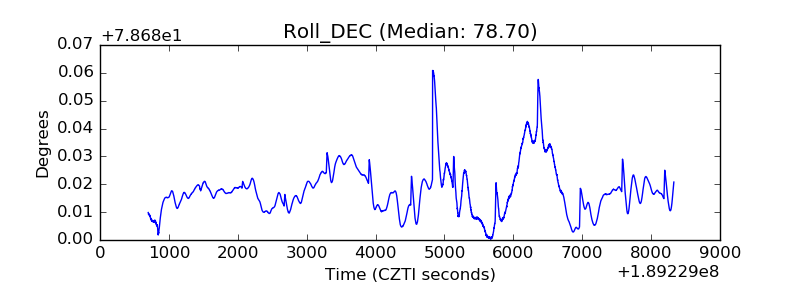 |
| _Roll_RA | 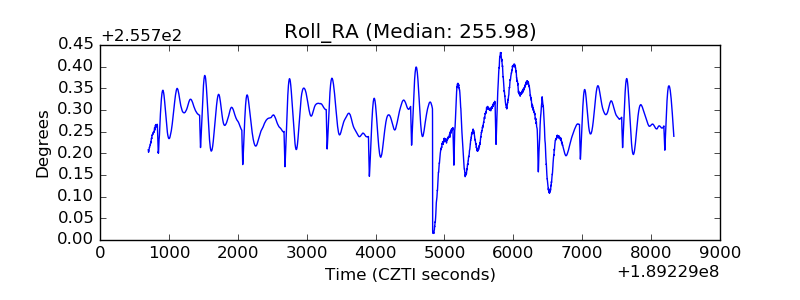 |
| Veto Counter | 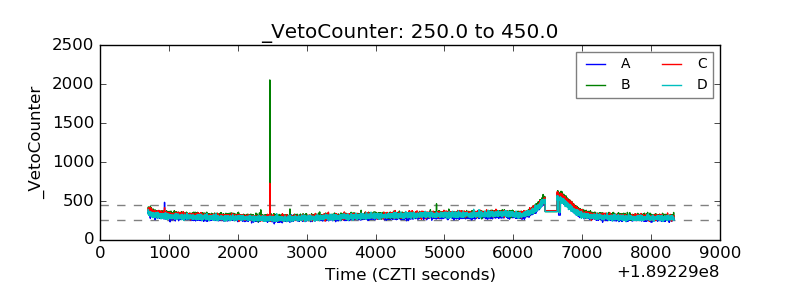 |