| Param | Original file | Final file |
|---|---|---|
| Filename | modeM0/AS1G04_014T02_9000000232_01394cztM0_level2.evt | modeM0/AS1G04_014T02_9000000232_01394cztM0_level2_quad_clean.evt |
| Size (bytes) | 1,391,912,640 | 98,328,960 |
| Size | 1.3 GB | 93.8 MB |
| Events in quadrant A | 16,293,289 | 548,597 |
| Events in quadrant B | 9,545,126 | 661,980 |
| Events in quadrant C | 8,153,465 | 649,838 |
| Events in quadrant D | 7,707,039 | 634,586 |
| Mode SS | |||
|---|---|---|---|
| Quadrant | BADHDUFLAG | Total packets | Discarded packets |
| A | 0 | 138 | 0 |
| B | 0 | 138 | 0 |
| C | 0 | 138 | 0 |
| D | 0 | 138 | 0 |
| Mode M0 | |||
|---|---|---|---|
| Quadrant | BADHDUFLAG | Total packets | Discarded packets |
| A | 0 | 53550 | 1 |
| B | 0 | 33256 | 0 |
| C | 0 | 29155 | 0 |
| D | 0 | 27830 | 0 |
| Quadrant | Total seconds | Saturated seconds | Saturation percentage |
|---|---|---|---|
| A | 6913 | 2213 | 32.012151% |
| B | 6913 | 131 | 1.894980% |
| C | 6913 | 6 | 0.086793% |
| D | 6913 | 45 | 0.650947% |
Noise dominated data is calculated using 1-second bins in cleaned event files. If a bin has >2000 counts, and if more than 50% of those come from <1% of pixels, then it is considered to be noise-dominated and hence unusable.
| Quadrant | # 1 sec bins | Bins with >0 counts | Bins with >2000 counts | High rate bins dominated by noise | Noise dominated (total time) | Noise dominated (detector-on time) | Marked lightcurve |
|---|---|---|---|---|---|---|---|
| A | 6913 | 6913 | 4471 | 4471 | 64.68% | 64.68% |  |
| B | 6913 | 6913 | 722 | 722 | 10.44% | 10.44% | 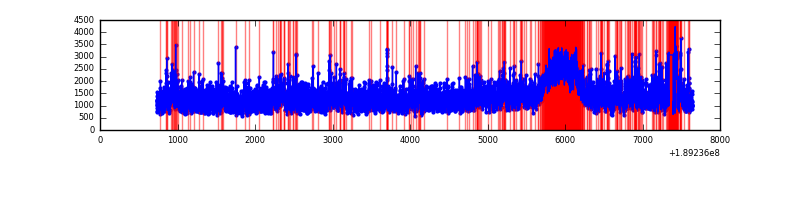 |
| C | 6913 | 6913 | 318 | 318 | 4.60% | 4.60% | 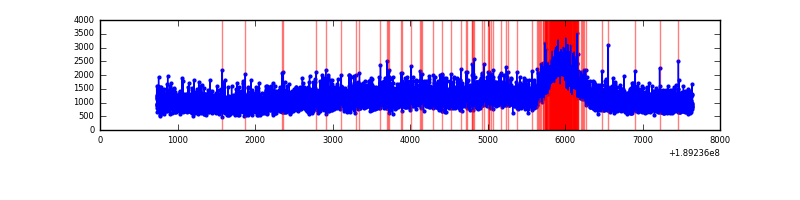 |
| D | 6913 | 6913 | 354 | 354 | 5.12% | 5.12% | 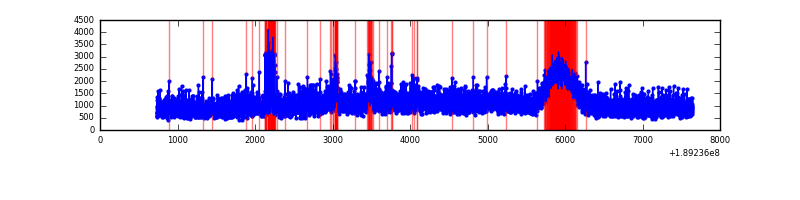 |
Top three noisy pixels from each quadrant. If the there are fewer than three noisy pixels in the level2.evt file, extra rows are filled as -1
| Pixel properties | Quadrant properties | ||||||
|---|---|---|---|---|---|---|---|
| Quadrant | DetID | PixID | Counts | Sigma | Mean | Median | Sigma |
| A | 15 | 127 | 5889436 | 12412.27 | 1947 | 1959 | 474.3 |
| A | 4 | 32 | 2830550 | 5963.37 | 1947 | 1959 | 474.3 |
| A | 12 | 243 | 65122 | 133.16 | 1947 | 1959 | 474.3 |
| B | 8 | 4 | 456470 | 851.55 | 2230 | 2243 | 533.4 |
| B | 5 | 249 | 268196 | 498.59 | 2230 | 2243 | 533.4 |
| B | 12 | 52 | 152009 | 280.77 | 2230 | 2243 | 533.4 |
| C | 15 | 241 | 242516 | 429.43 | 2001 | 2069 | 559.9 |
| C | 7 | 220 | 38052 | 64.26 | 2001 | 2069 | 559.9 |
| C | 3 | 111 | 28736 | 47.63 | 2001 | 2069 | 559.9 |
| D | 9 | 53 | 161041 | 276.87 | 1993 | 2038 | 574.3 |
| D | 2 | 16 | 34855 | 57.14 | 1993 | 2038 | 574.3 |
| D | 5 | 82 | 33307 | 54.45 | 1993 | 2038 | 574.3 |
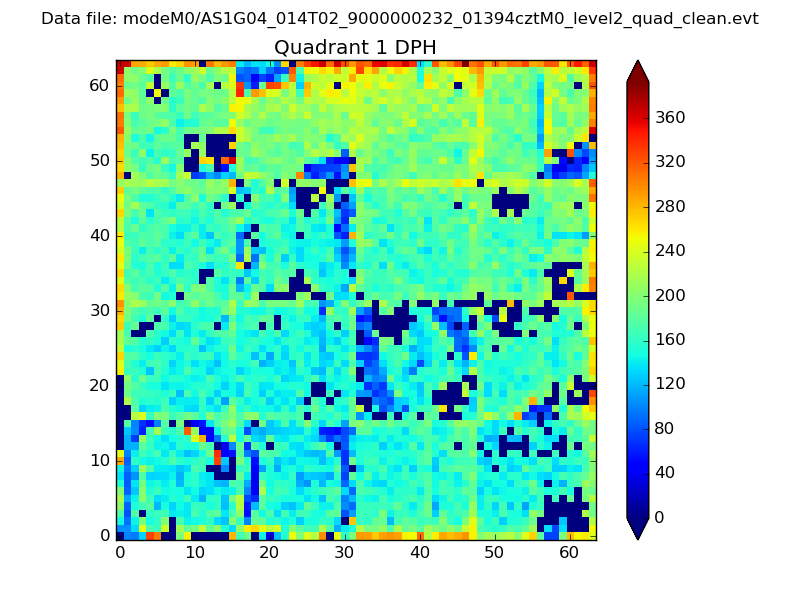
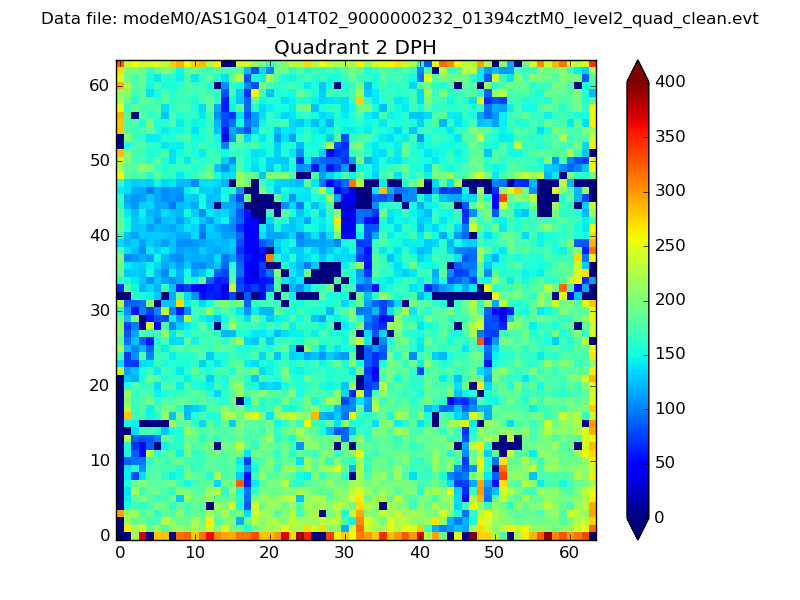
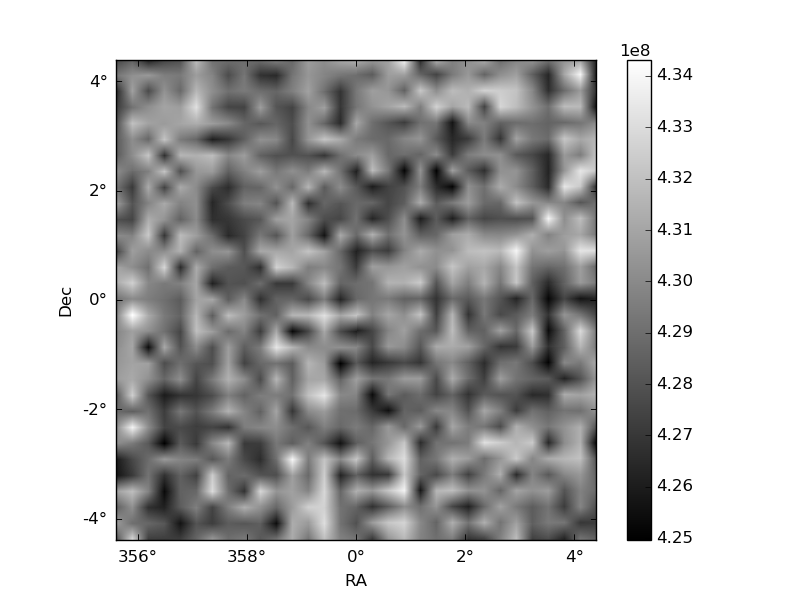
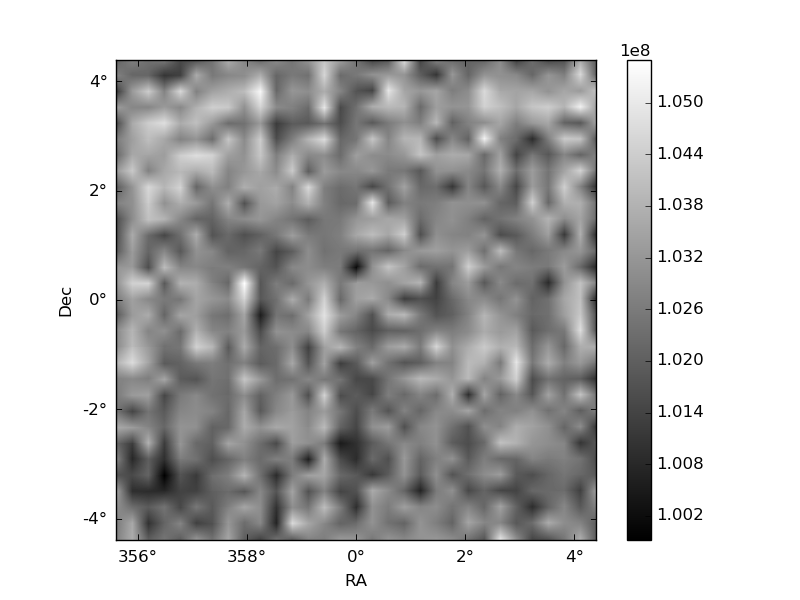
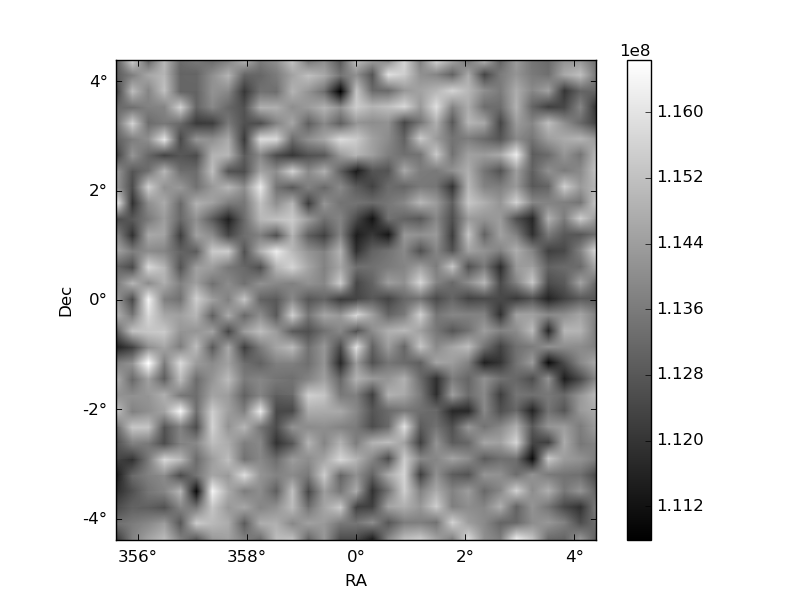
Histogram calculated using DETX and DETY for each event in the final _common_clean file
| Quadrant A | 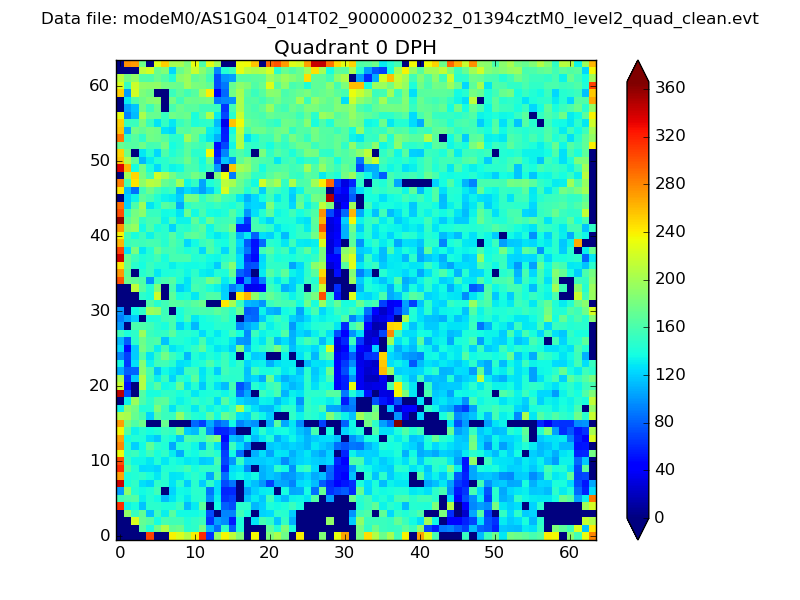 |
 |
Quadrant B |
|---|---|---|---|
| Quadrant D | 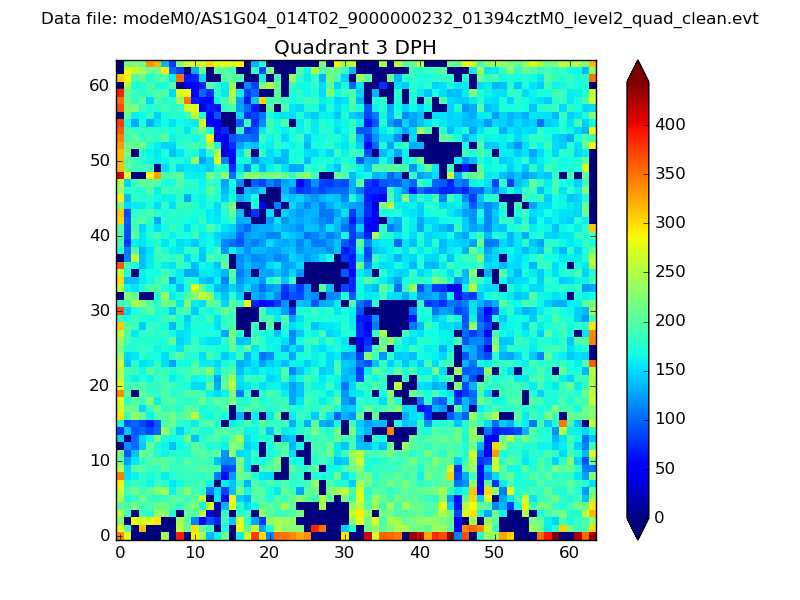 |
 |
Quadrant C |
| Plot type | Count rate plots | Images |
|---|---|---|
| Comparison with Poisson distribution Blue bars denote a histogram of data divided into 1 sec bins. Red curve is a Poisson curve with rate = median count rate of data. |
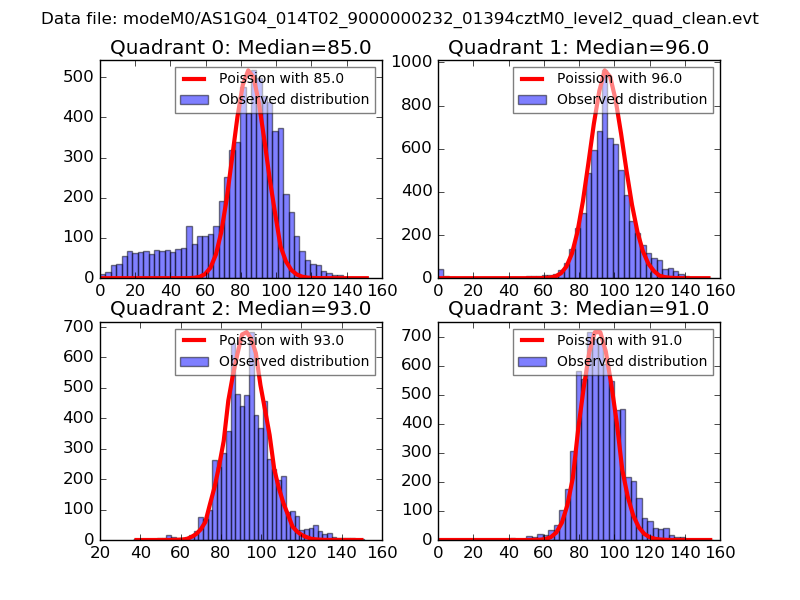 |
 |
| Quadrant-wise count rates Data is divided into 100 sec bins |
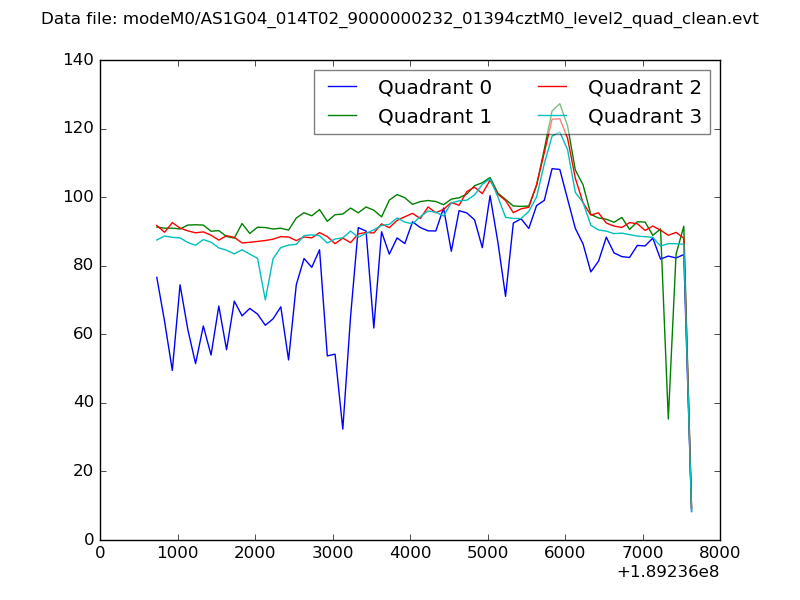 |
|
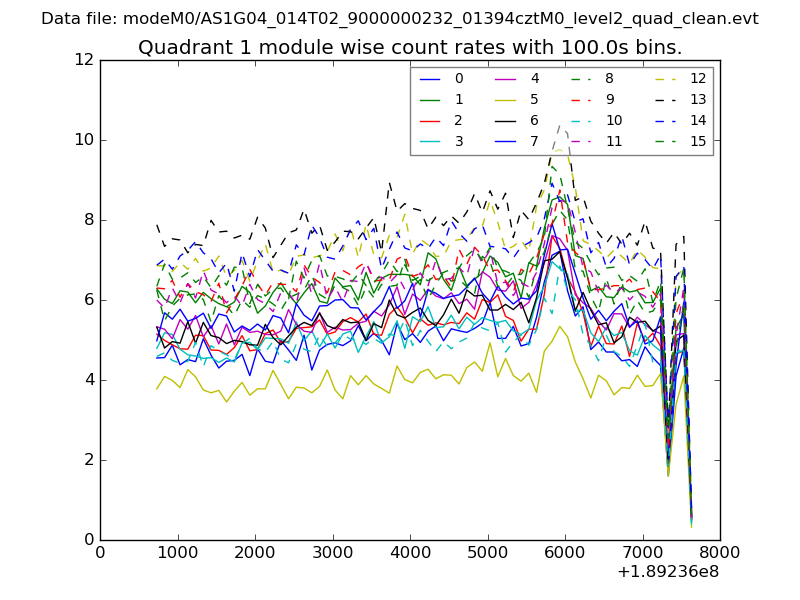
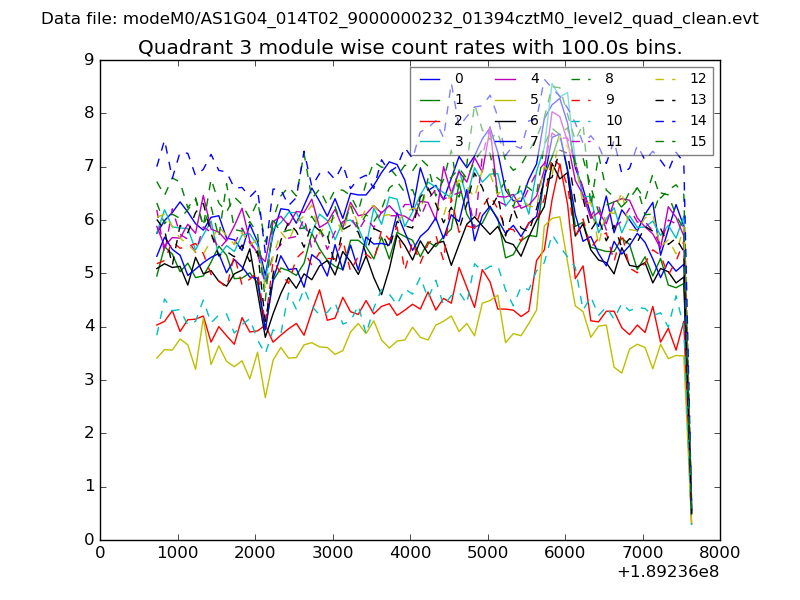
| Module-wise count rates for Quadrant A Data is divided into 100 sec bins |
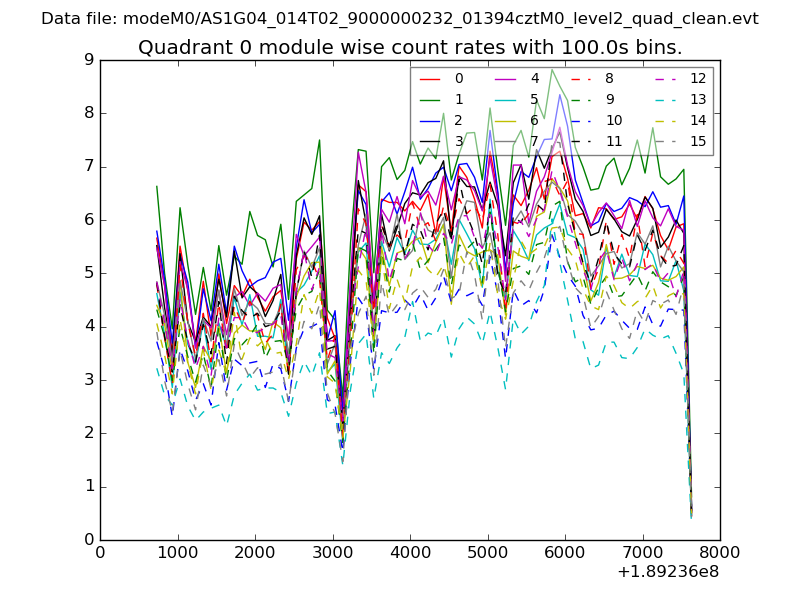 |
 |
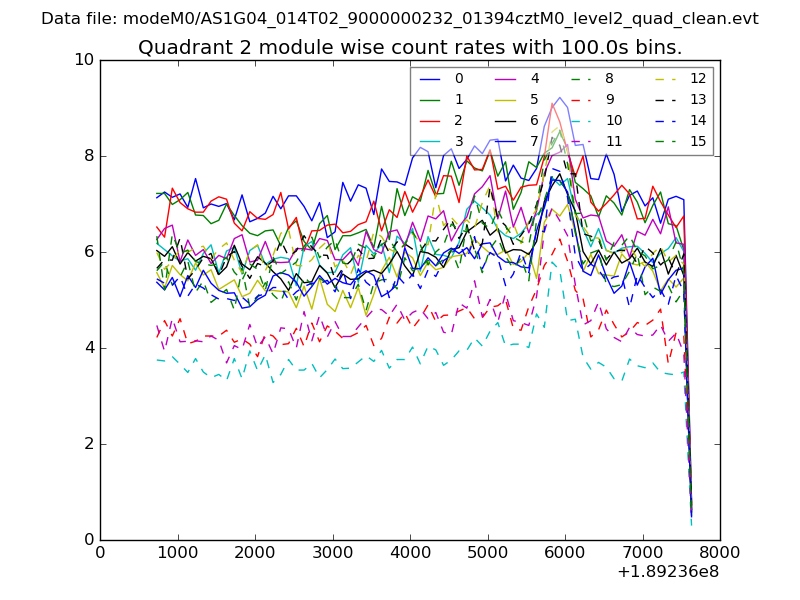
| Module-wise count rates for Quadrant B Data is divided into 100 sec bins |
 |
 |
| Module-wise count rates for Quadrant C Data is divided into 100 sec bins |
 |
 |
| Module-wise count rates for Quadrant D Data is divided into 100 sec bins |
 |
 |
| Parameter | Plot |
|---|---|
| CZT HV Monitor | 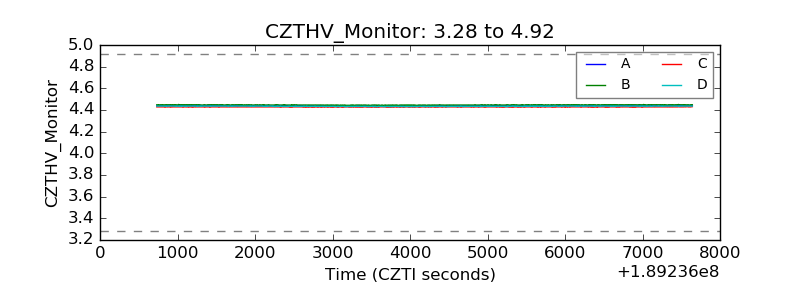 |
| D_VDD | 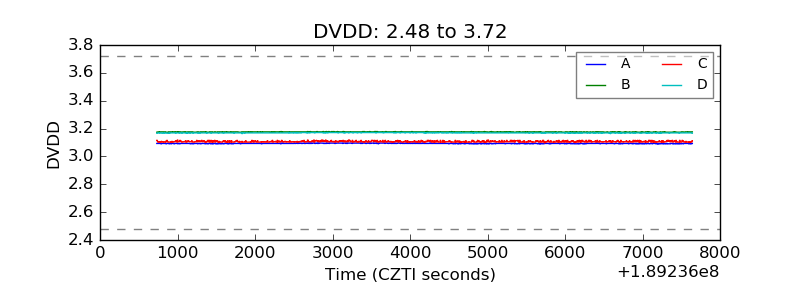 |
| Temperature 1 | 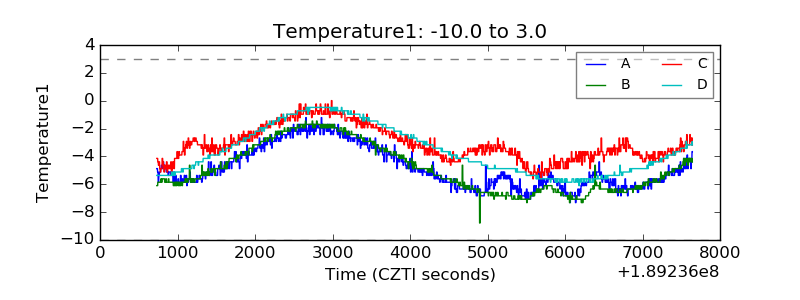 |
| Veto HV Monitor | 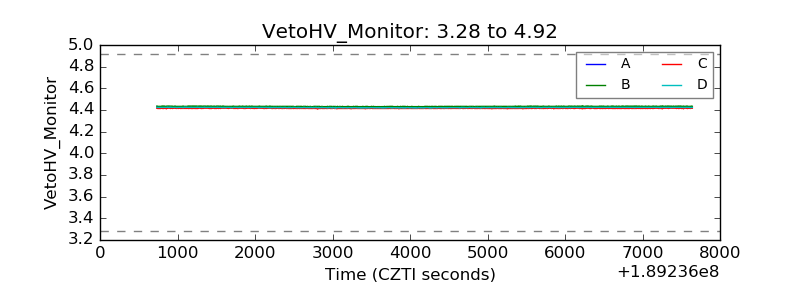 |
| Veto LLD | 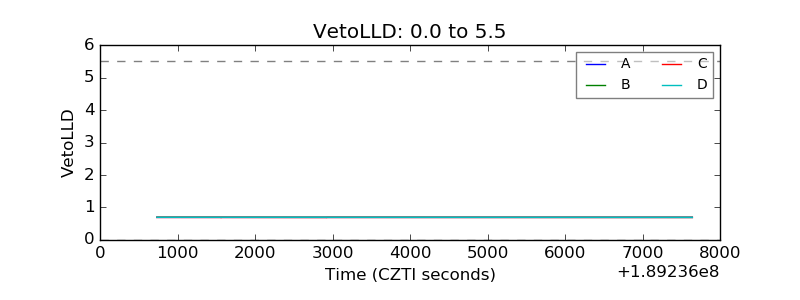 |
| Alpha Counter | 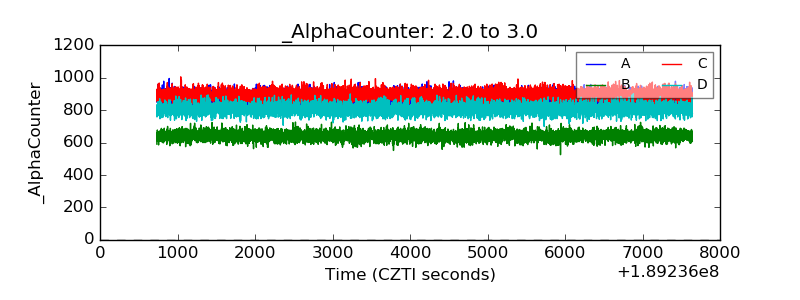 |
| _CPM_Rate | 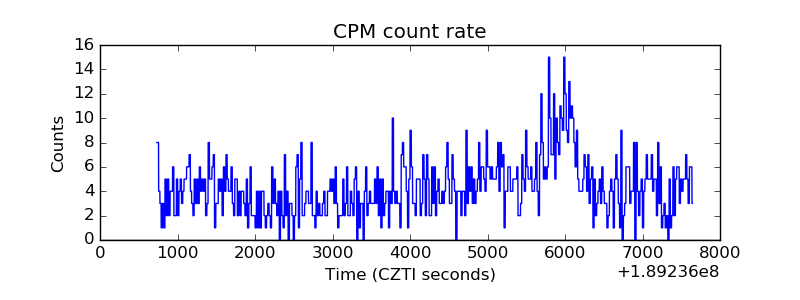 |
| CZT Counter | 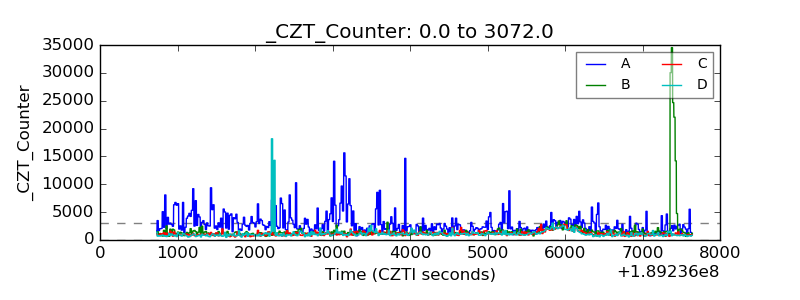 |
| +2.5 Volts monitor |  |
| +5 Volts monitor |  |
| _ROLL_ROT | 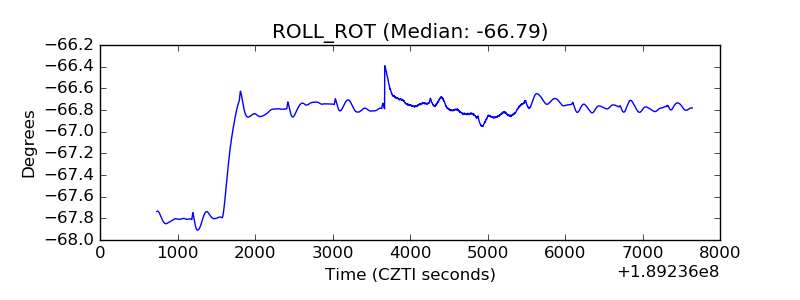 |
| _Roll_DEC | 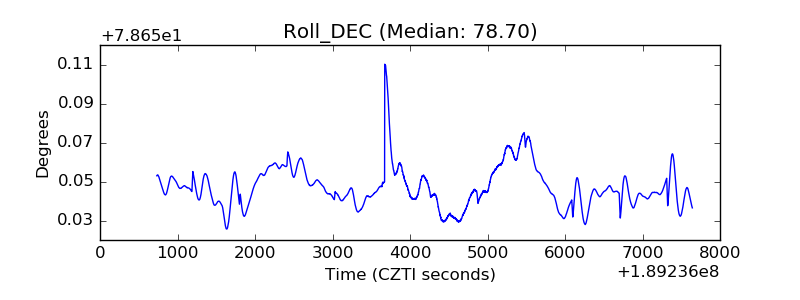 |
| _Roll_RA | 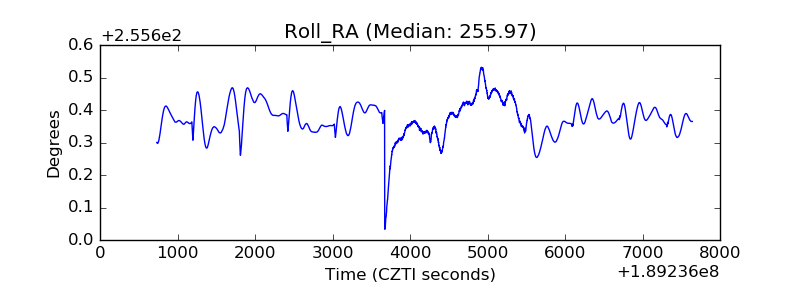 |
| Veto Counter | 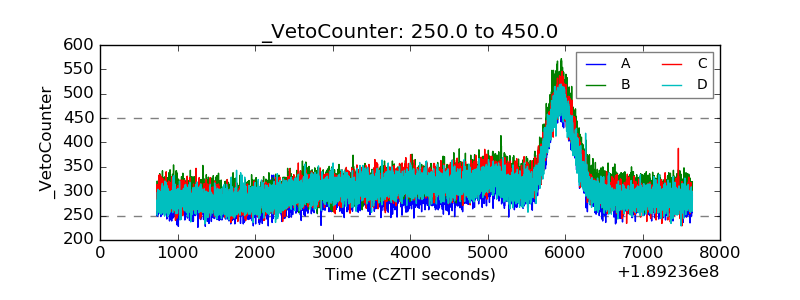 |