| Param | Original file | Final file |
|---|---|---|
| Filename | modeM0/AS1G04_014T02_9000000232_01395cztM0_level2.evt | modeM0/AS1G04_014T02_9000000232_01395cztM0_level2_quad_clean.evt |
| Size (bytes) | 1,335,358,080 | 104,713,920 |
| Size | 1.2 GB | 99.9 MB |
| Events in quadrant A | 13,377,428 | 645,228 |
| Events in quadrant B | 10,410,266 | 684,236 |
| Events in quadrant C | 8,382,715 | 674,143 |
| Events in quadrant D | 7,794,806 | 664,404 |
| Mode SS | |||
|---|---|---|---|
| Quadrant | BADHDUFLAG | Total packets | Discarded packets |
| A | 0 | 148 | 0 |
| B | 0 | 148 | 0 |
| C | 0 | 148 | 0 |
| D | 0 | 148 | 0 |
| Mode M0 | |||
|---|---|---|---|
| Quadrant | BADHDUFLAG | Total packets | Discarded packets |
| A | 0 | 44895 | 2 |
| B | 0 | 36059 | 1 |
| C | 0 | 30060 | 1 |
| D | 0 | 28305 | 1 |
| Mode M9 | |||
|---|---|---|---|
| Quadrant | BADHDUFLAG | Total packets | Discarded packets |
| A | 0 | 2 | 0 |
| B | 0 | 2 | 0 |
| C | 0 | 2 | 0 |
| D | 0 | 2 | 0 |
| Quadrant | Total seconds | Saturated seconds | Saturation percentage |
|---|---|---|---|
| A | 7224 | 813 | 11.254153% |
| B | 7224 | 181 | 2.505537% |
| C | 7224 | 31 | 0.429125% |
| D | 7224 | 72 | 0.996678% |
Noise dominated data is calculated using 1-second bins in cleaned event files. If a bin has >2000 counts, and if more than 50% of those come from <1% of pixels, then it is considered to be noise-dominated and hence unusable.
| Quadrant | # 1 sec bins | Bins with >0 counts | Bins with >2000 counts | High rate bins dominated by noise | Noise dominated (total time) | Noise dominated (detector-on time) | Marked lightcurve |
|---|---|---|---|---|---|---|---|
| A | 7434 | 7224 | 2527 | 2527 | 33.99% | 34.98% | 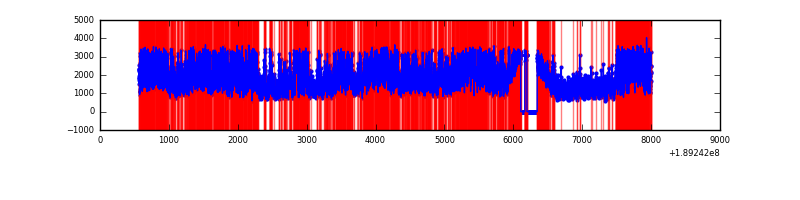 |
| B | 7434 | 7225 | 815 | 815 | 10.96% | 11.28% | 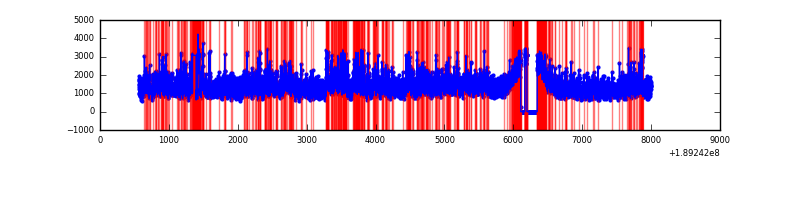 |
| C | 7434 | 7226 | 237 | 237 | 3.19% | 3.28% | 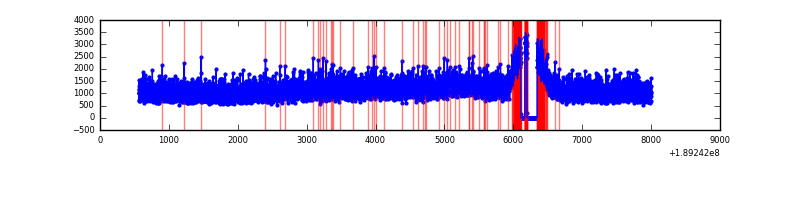 |
| D | 7434 | 7226 | 244 | 244 | 3.28% | 3.38% | 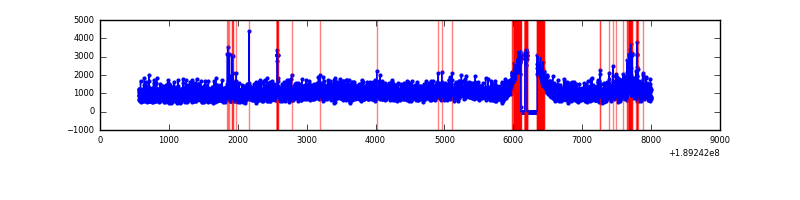 |
Top three noisy pixels from each quadrant. If the there are fewer than three noisy pixels in the level2.evt file, extra rows are filled as -1
| Pixel properties | Quadrant properties | ||||||
|---|---|---|---|---|---|---|---|
| Quadrant | DetID | PixID | Counts | Sigma | Mean | Median | Sigma |
| A | 15 | 127 | 3004079 | 5667.01 | 2178 | 2189 | 529.7 |
| A | 4 | 32 | 1777358 | 3351.19 | 2178 | 2189 | 529.7 |
| A | 3 | 80 | 229473 | 429.07 | 2178 | 2189 | 529.7 |
| B | 8 | 4 | 1101650 | 2020.83 | 2283 | 2296 | 544.0 |
| B | 5 | 249 | 277199 | 505.33 | 2283 | 2296 | 544.0 |
| B | 12 | 52 | 183489 | 333.07 | 2283 | 2296 | 544.0 |
| C | 15 | 241 | 254699 | 438.89 | 2058 | 2128 | 575.5 |
| C | 3 | 79 | 30481 | 49.27 | 2058 | 2128 | 575.5 |
| C | 3 | 111 | 29951 | 48.35 | 2058 | 2128 | 575.5 |
| D | 13 | 205 | 55918 | 89.61 | 2054 | 2102 | 600.6 |
| D | 13 | 73 | 32111 | 49.97 | 2054 | 2102 | 600.6 |
| D | 5 | 82 | 10342 | 13.72 | 2054 | 2102 | 600.6 |
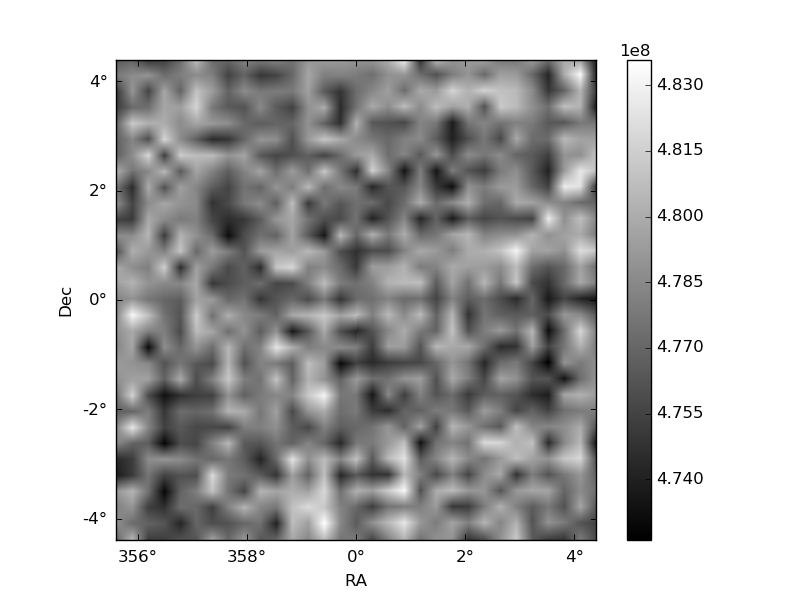
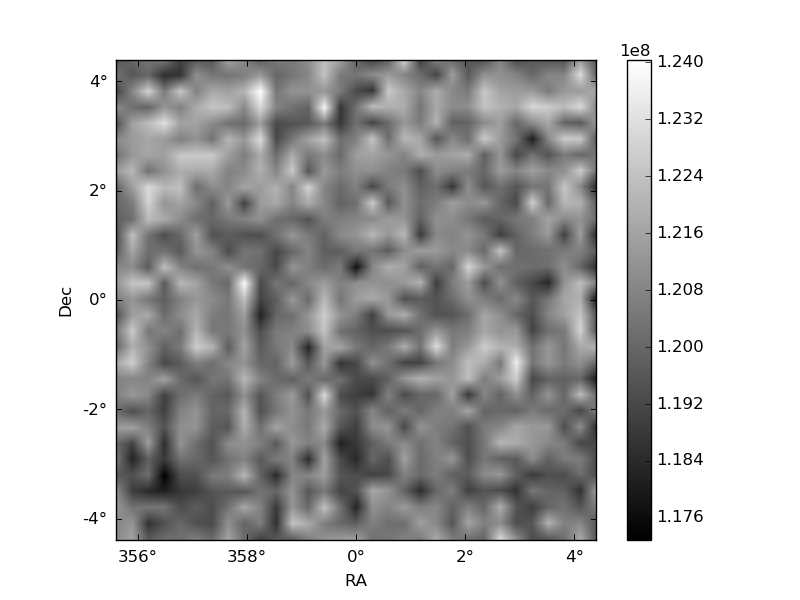
Histogram calculated using DETX and DETY for each event in the final _common_clean file
| Quadrant A | 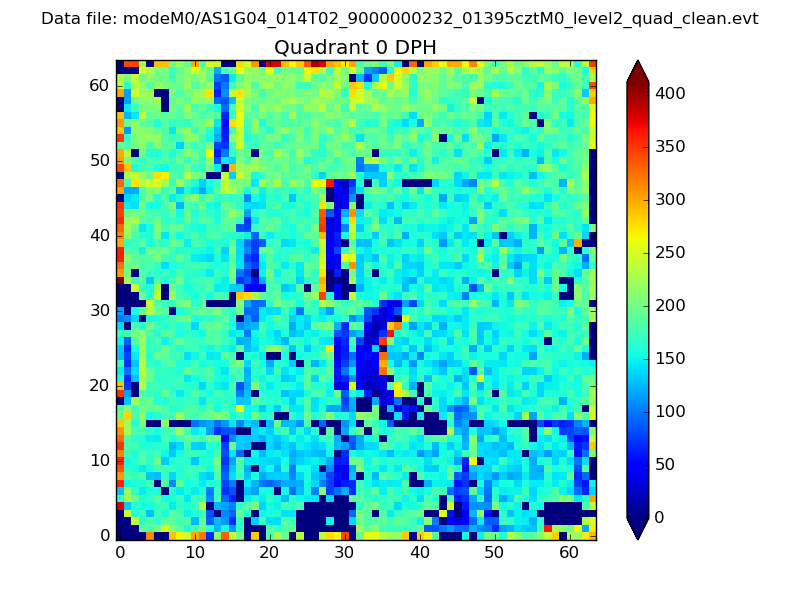 |
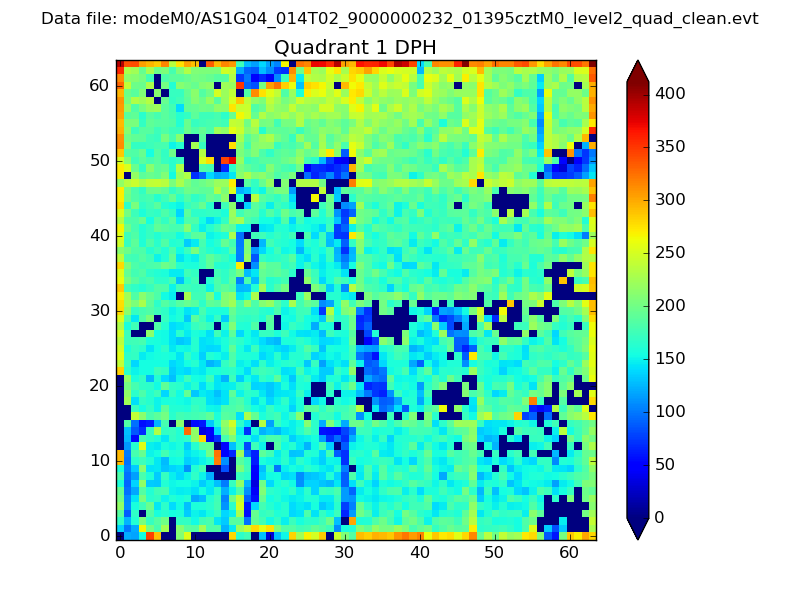 |
Quadrant B |
|---|---|---|---|
| Quadrant D | 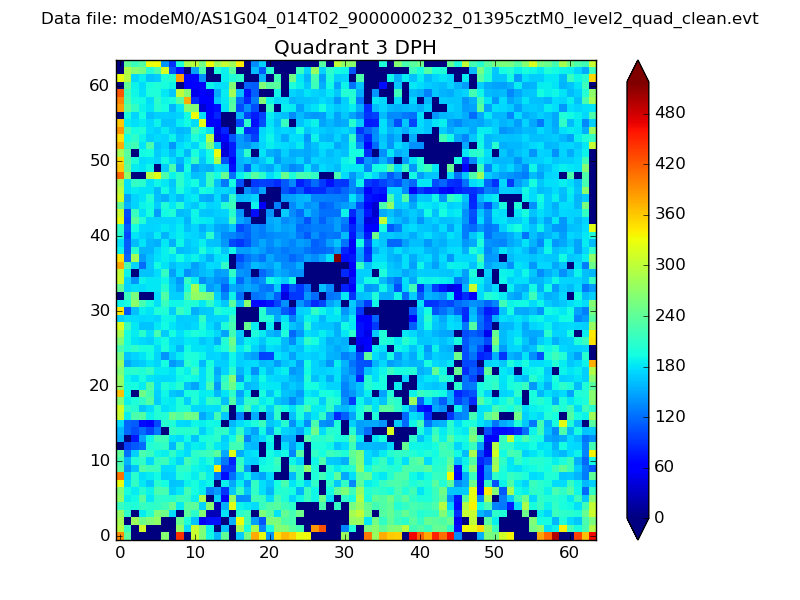 |
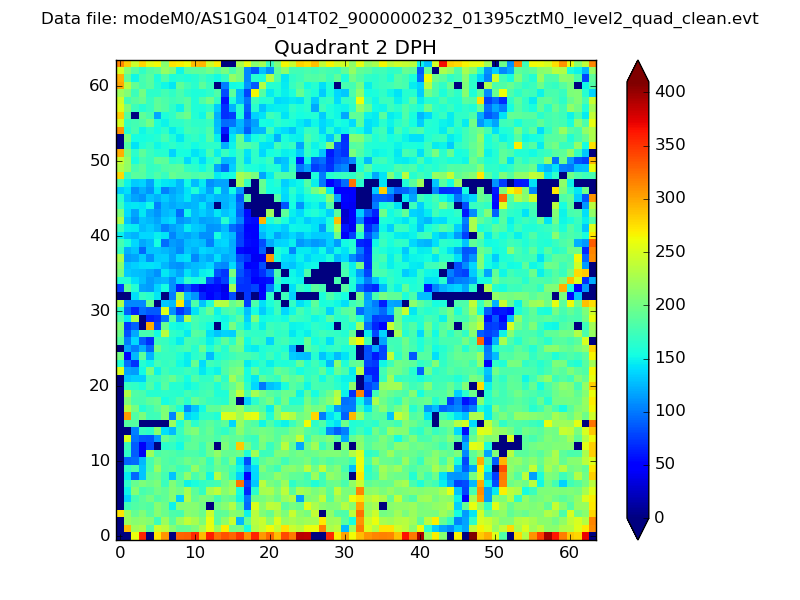 |
Quadrant C |
| Plot type | Count rate plots | Images |
|---|---|---|
| Comparison with Poisson distribution Blue bars denote a histogram of data divided into 1 sec bins. Red curve is a Poisson curve with rate = median count rate of data. |
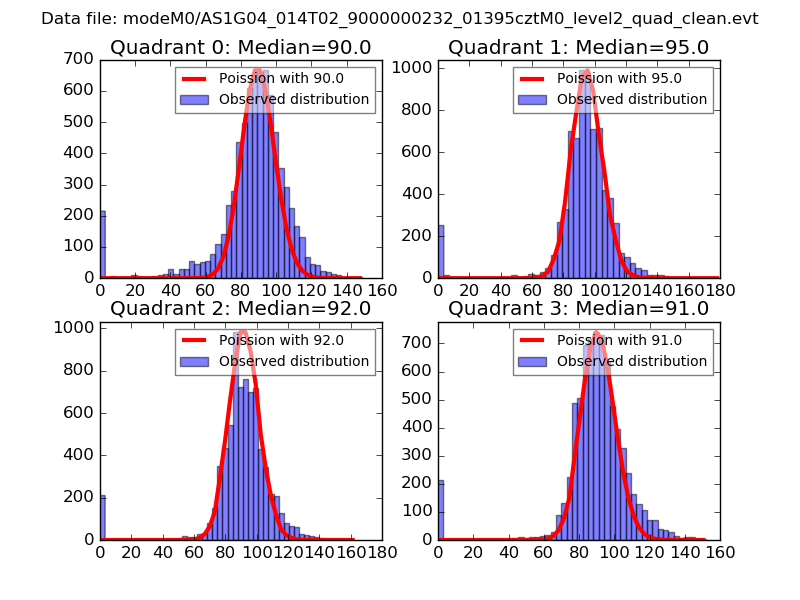 |
 |
| Quadrant-wise count rates Data is divided into 100 sec bins |
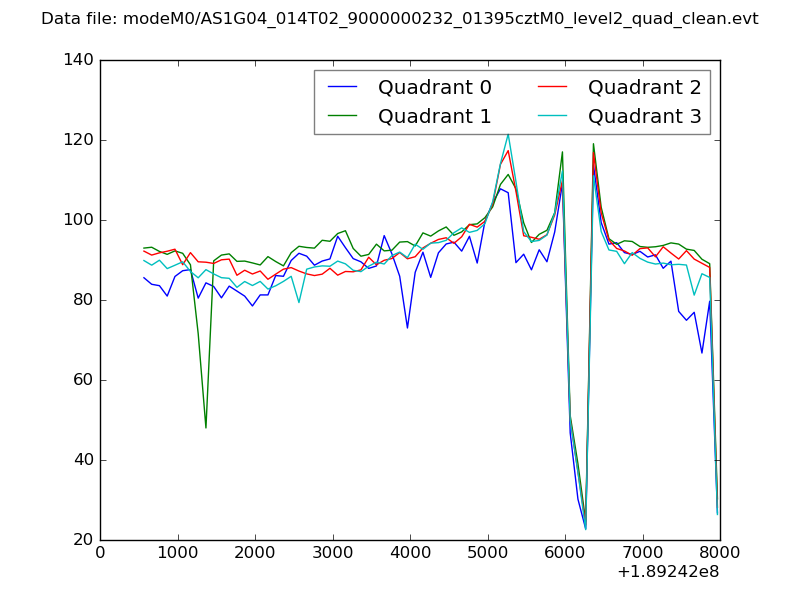 |
|
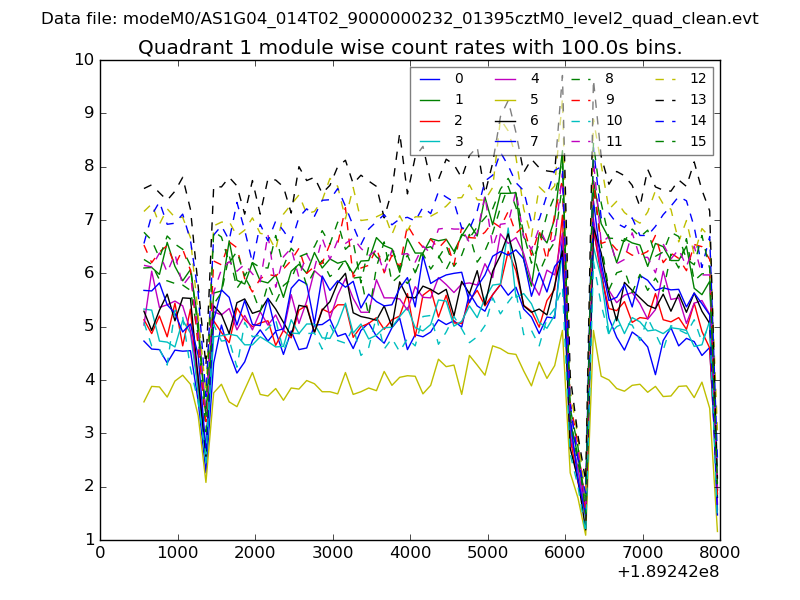
| Module-wise count rates for Quadrant A Data is divided into 100 sec bins |
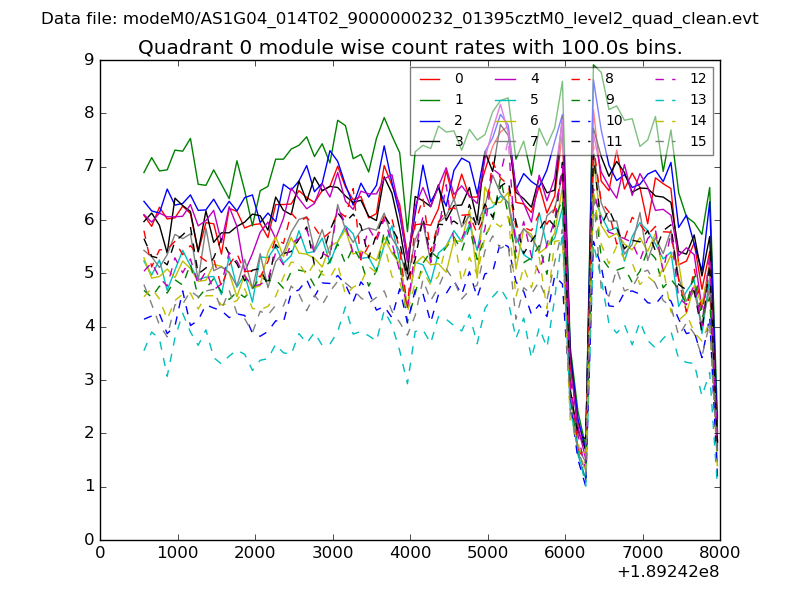 |
 |
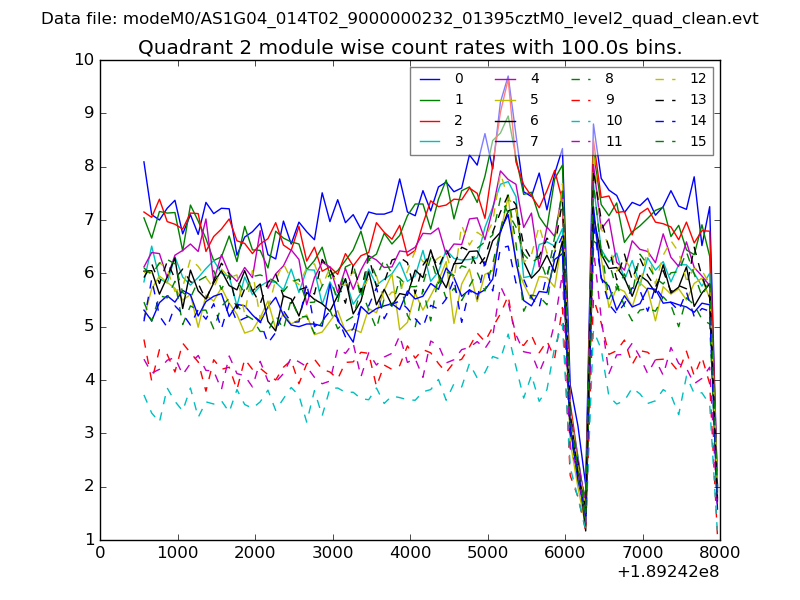
| Module-wise count rates for Quadrant B Data is divided into 100 sec bins |
 |
 |
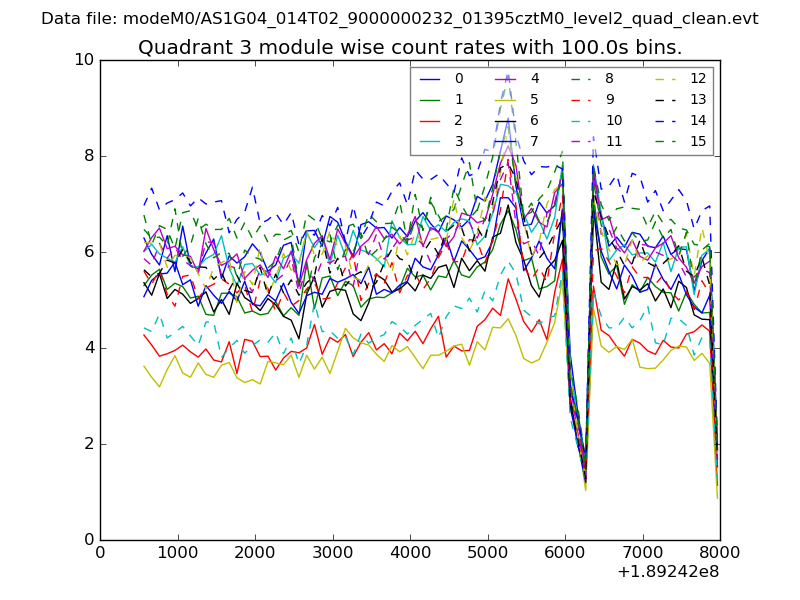
| Module-wise count rates for Quadrant C Data is divided into 100 sec bins |
 |
 |
| Module-wise count rates for Quadrant D Data is divided into 100 sec bins |
 |
 |
| Parameter | Plot |
|---|---|
| CZT HV Monitor | 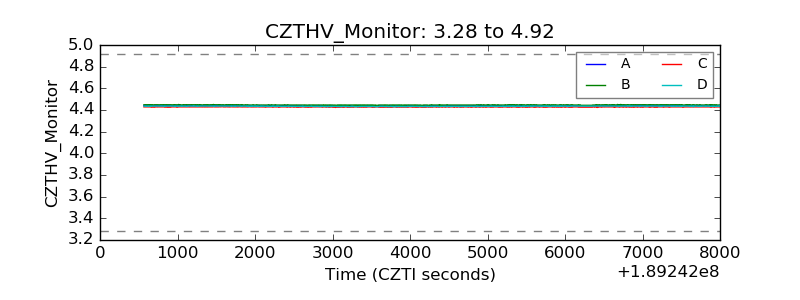 |
| D_VDD | 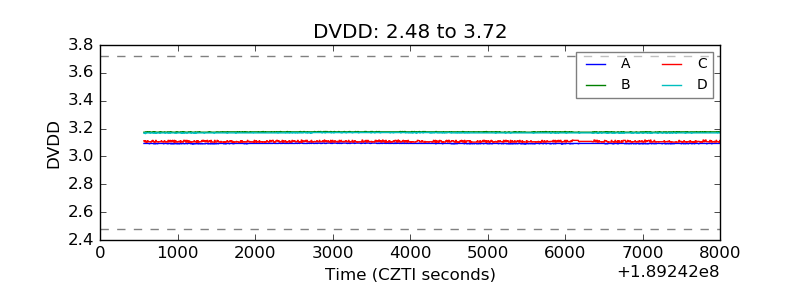 |
| Temperature 1 | 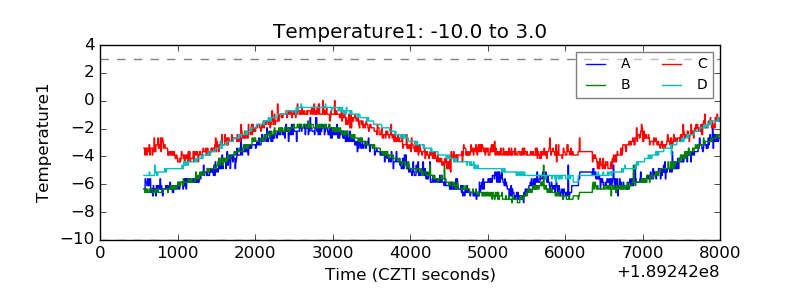 |
| Veto HV Monitor | 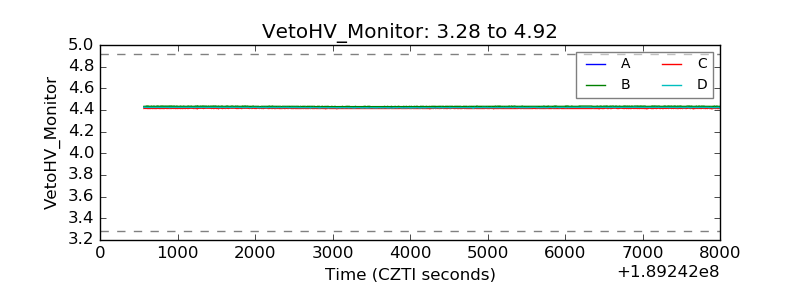 |
| Veto LLD | 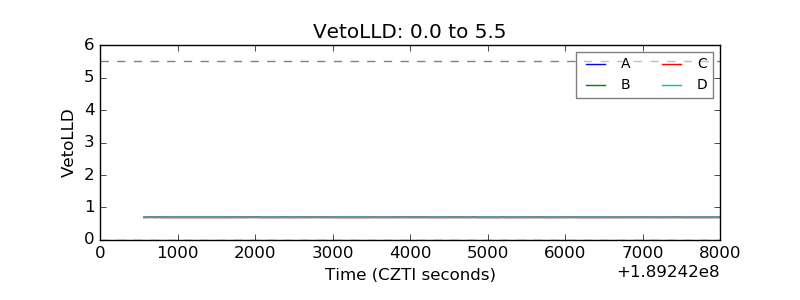 |
| Alpha Counter | 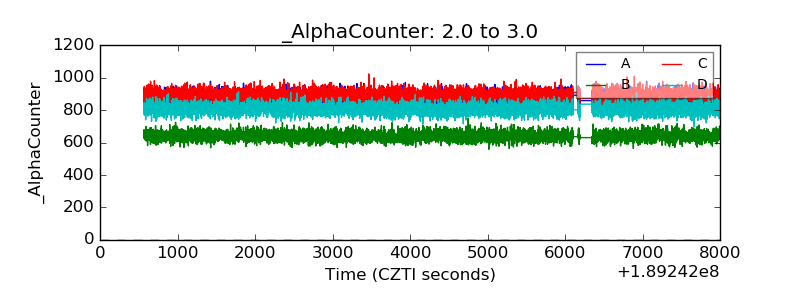 |
| _CPM_Rate | 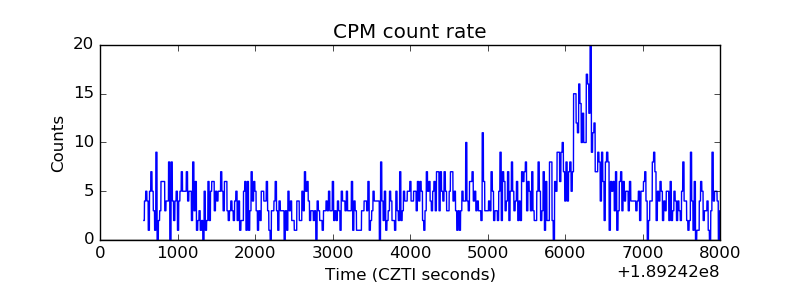 |
| CZT Counter | 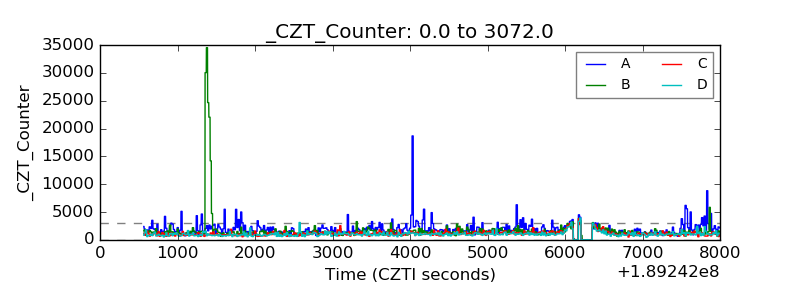 |
| +2.5 Volts monitor |  |
| +5 Volts monitor |  |
| _ROLL_ROT | 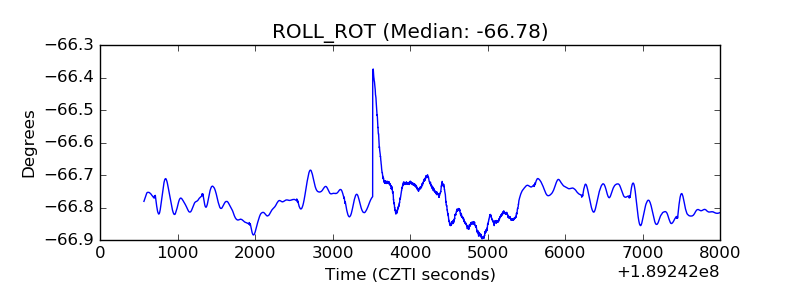 |
| _Roll_DEC | 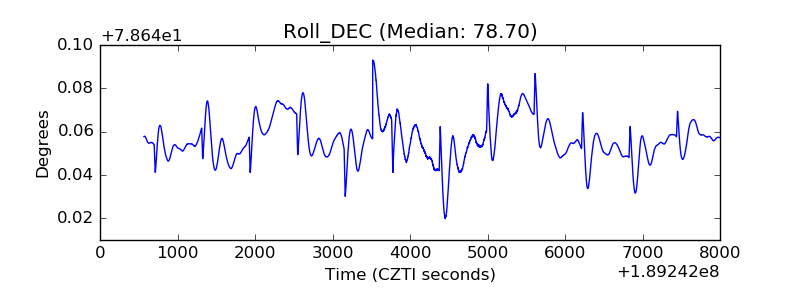 |
| _Roll_RA | 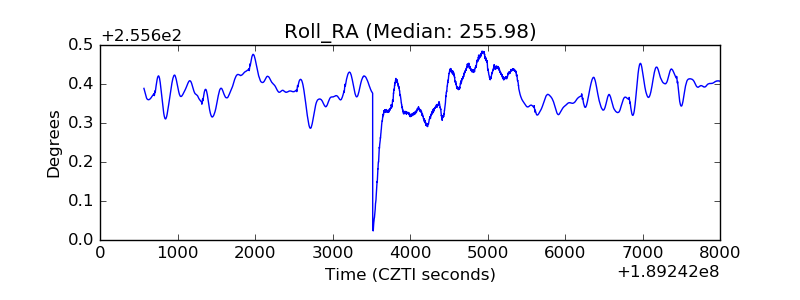 |
| Veto Counter | 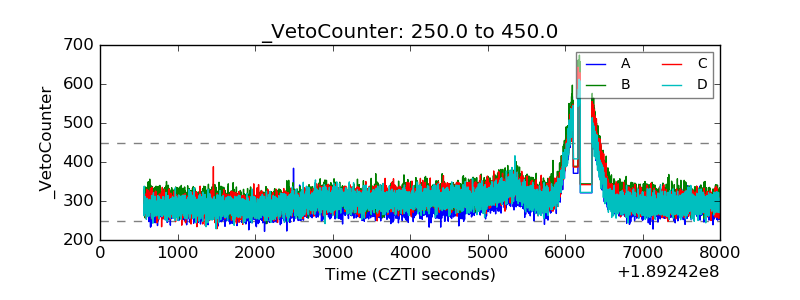 |