| Param | Original file | Final file |
|---|---|---|
| Filename | modeM0/AS1G04_014T02_9000000232_01396cztM0_level2.evt | modeM0/AS1G04_014T02_9000000232_01396cztM0_level2_quad_clean.evt |
| Size (bytes) | 1,256,875,200 | 93,839,040 |
| Size | 1.2 GB | 89.5 MB |
| Events in quadrant A | 13,525,574 | 543,909 |
| Events in quadrant B | 9,189,601 | 626,456 |
| Events in quadrant C | 7,637,102 | 611,852 |
| Events in quadrant D | 7,278,320 | 600,222 |
| Mode SS | |||
|---|---|---|---|
| Quadrant | BADHDUFLAG | Total packets | Discarded packets |
| A | 0 | 134 | 0 |
| B | 0 | 134 | 0 |
| C | 0 | 134 | 0 |
| D | 0 | 134 | 0 |
| Mode M0 | |||
|---|---|---|---|
| Quadrant | BADHDUFLAG | Total packets | Discarded packets |
| A | 0 | 45053 | 2 |
| B | 0 | 31975 | 1 |
| C | 0 | 27367 | 1 |
| D | 0 | 26299 | 1 |
| Mode M9 | |||
|---|---|---|---|
| Quadrant | BADHDUFLAG | Total packets | Discarded packets |
| A | 0 | 4 | 0 |
| B | 0 | 4 | 0 |
| C | 0 | 4 | 0 |
| D | 0 | 4 | 0 |
| Quadrant | Total seconds | Saturated seconds | Saturation percentage |
|---|---|---|---|
| A | 6574 | 1500 | 22.817159% |
| B | 6574 | 144 | 2.190447% |
| C | 6574 | 30 | 0.456343% |
| D | 6574 | 53 | 0.806206% |
Noise dominated data is calculated using 1-second bins in cleaned event files. If a bin has >2000 counts, and if more than 50% of those come from <1% of pixels, then it is considered to be noise-dominated and hence unusable.
| Quadrant | # 1 sec bins | Bins with >0 counts | Bins with >2000 counts | High rate bins dominated by noise | Noise dominated (total time) | Noise dominated (detector-on time) | Marked lightcurve |
|---|---|---|---|---|---|---|---|
| A | 6978 | 6573 | 3060 | 3060 | 43.85% | 46.55% | 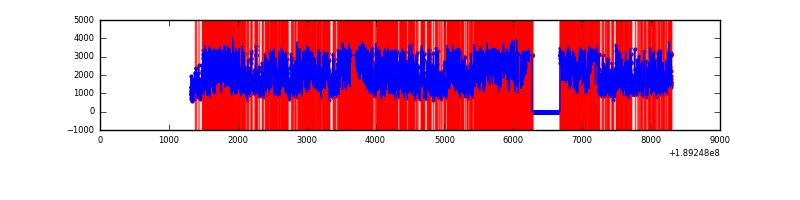 |
| B | 6978 | 6574 | 603 | 603 | 8.64% | 9.17% | 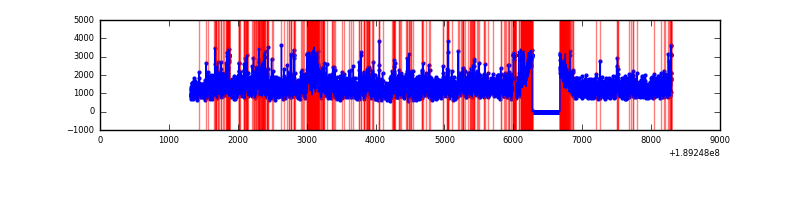 |
| C | 6979 | 6574 | 171 | 171 | 2.45% | 2.60% | 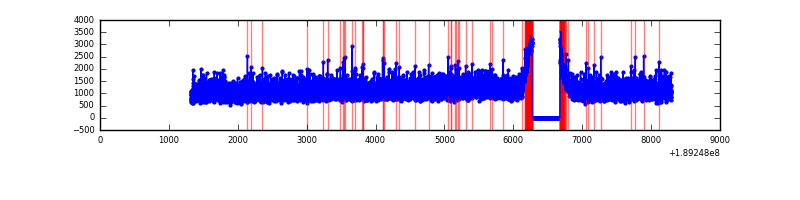 |
| D | 6979 | 6574 | 196 | 196 | 2.81% | 2.98% | 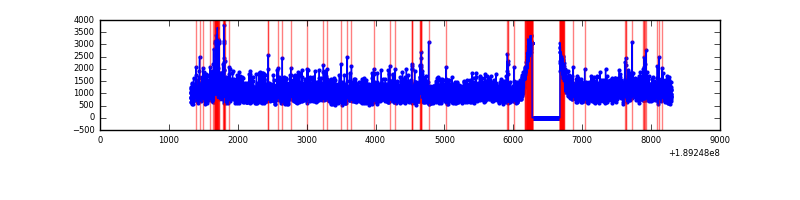 |
Top three noisy pixels from each quadrant. If the there are fewer than three noisy pixels in the level2.evt file, extra rows are filled as -1
| Pixel properties | Quadrant properties | ||||||
|---|---|---|---|---|---|---|---|
| Quadrant | DetID | PixID | Counts | Sigma | Mean | Median | Sigma |
| A | 4 | 32 | 4240954 | 9490.7 | 1846 | 1855 | 446.7 |
| A | 15 | 127 | 2073882 | 4638.95 | 1846 | 1855 | 446.7 |
| A | 3 | 80 | 121770 | 268.47 | 1846 | 1855 | 446.7 |
| B | 8 | 4 | 583347 | 1181.05 | 2063 | 2074 | 492.2 |
| B | 12 | 52 | 220695 | 444.2 | 2063 | 2074 | 492.2 |
| B | 5 | 191 | 214063 | 430.73 | 2063 | 2074 | 492.2 |
| C | 15 | 241 | 236881 | 446.04 | 1876 | 1937 | 526.7 |
| C | 3 | 79 | 33619 | 60.15 | 1876 | 1937 | 526.7 |
| C | 3 | 111 | 28451 | 50.34 | 1876 | 1937 | 526.7 |
| D | 13 | 205 | 86438 | 153.4 | 1884 | 1935 | 550.9 |
| D | 9 | 53 | 82324 | 145.93 | 1884 | 1935 | 550.9 |
| D | 2 | 16 | 30102 | 51.13 | 1884 | 1935 | 550.9 |
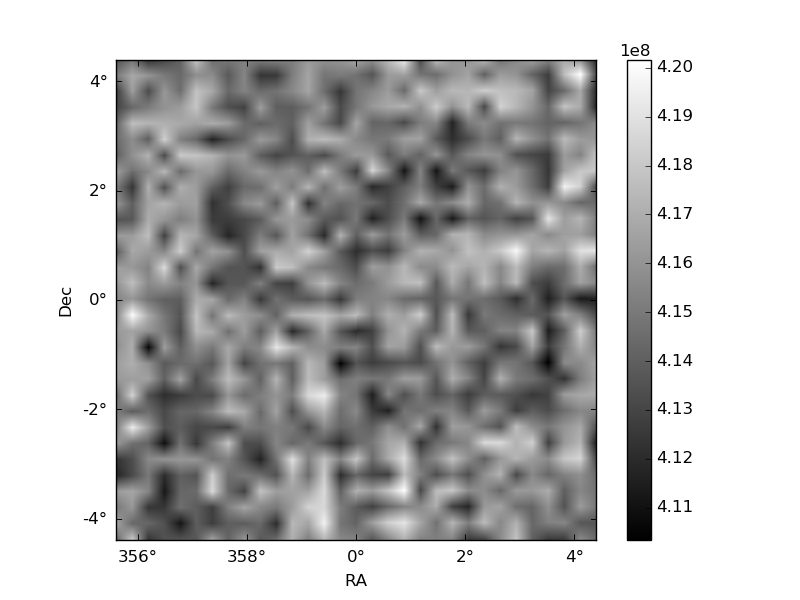
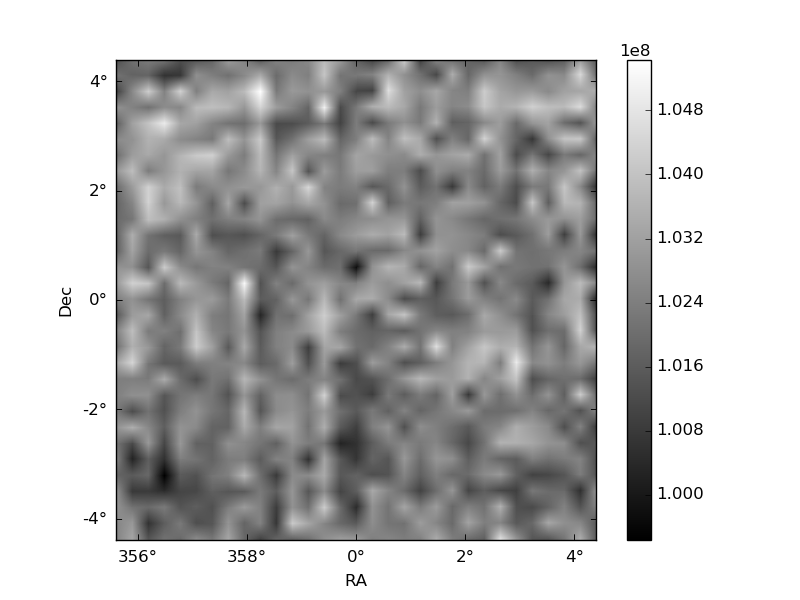
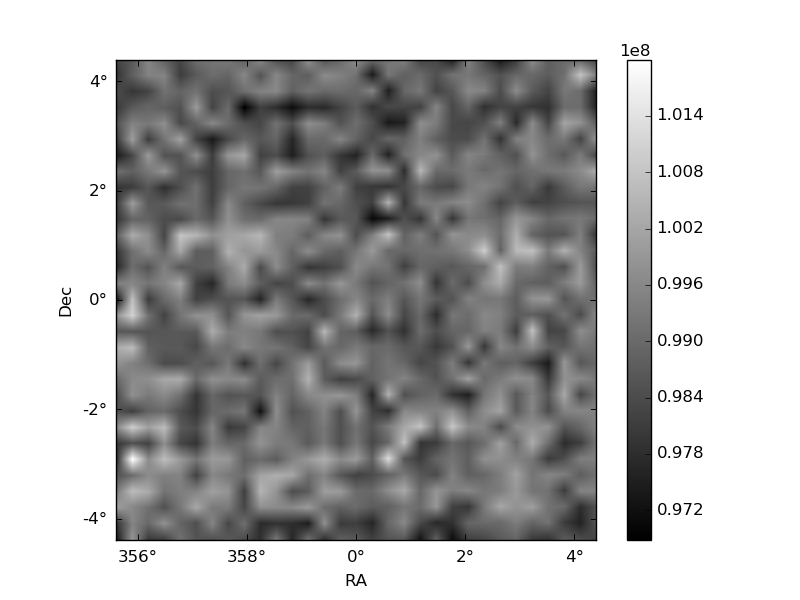
Histogram calculated using DETX and DETY for each event in the final _common_clean file
| Quadrant A | 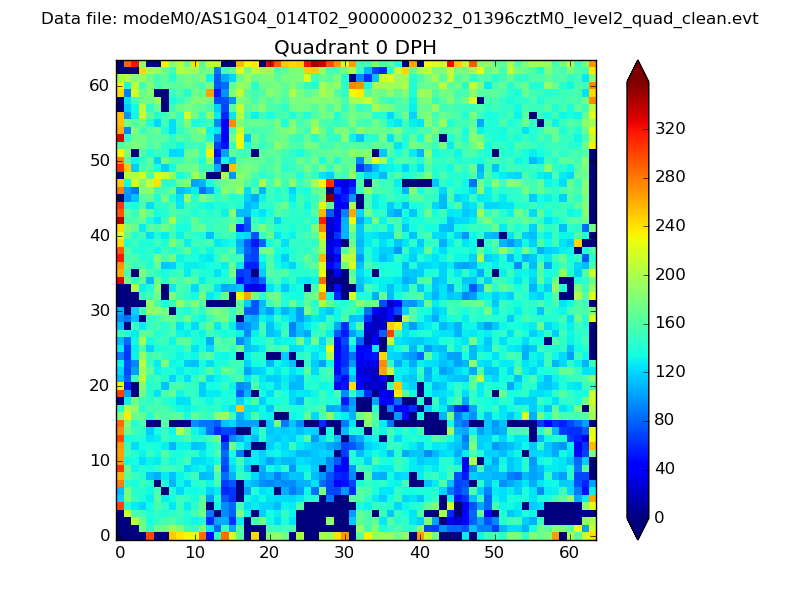 |
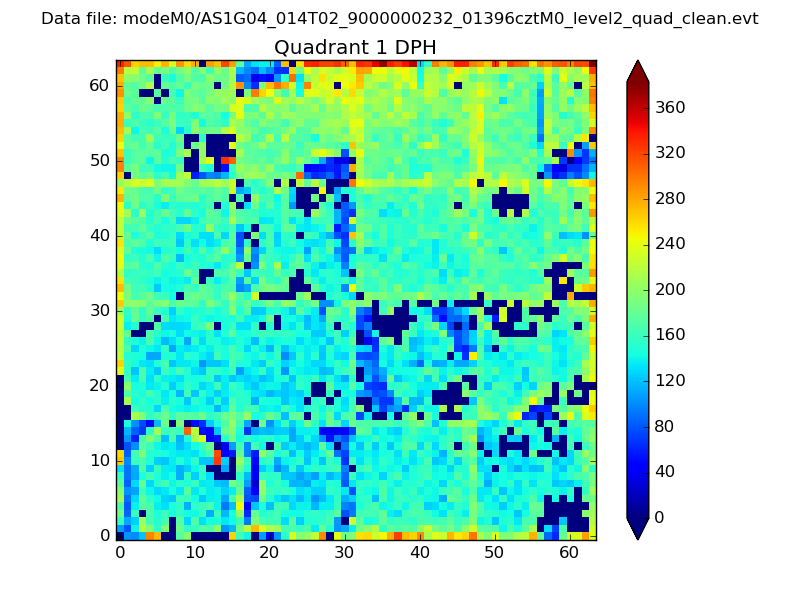 |
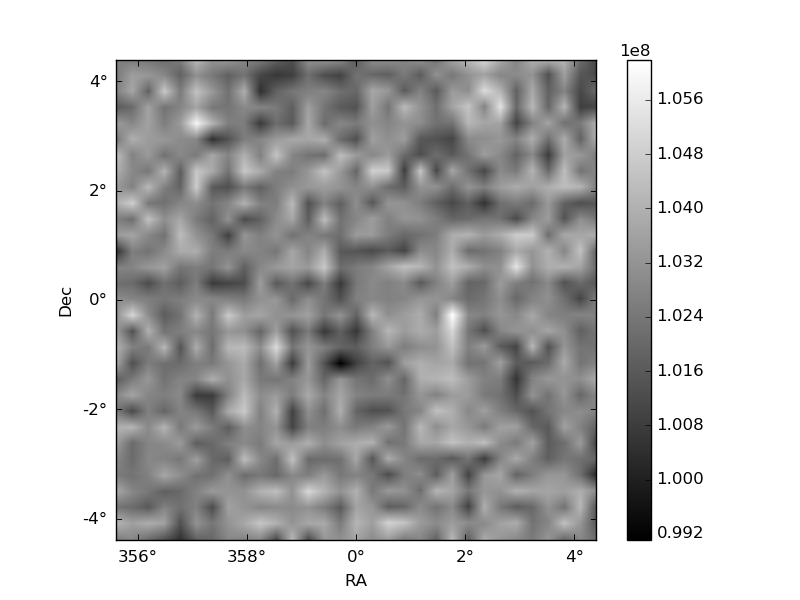
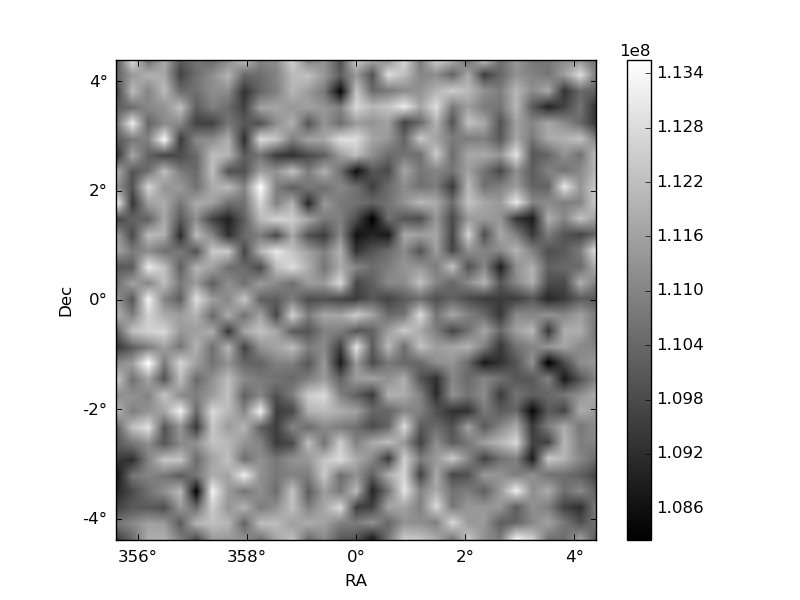
Quadrant B |
|---|---|---|---|
| Quadrant D | 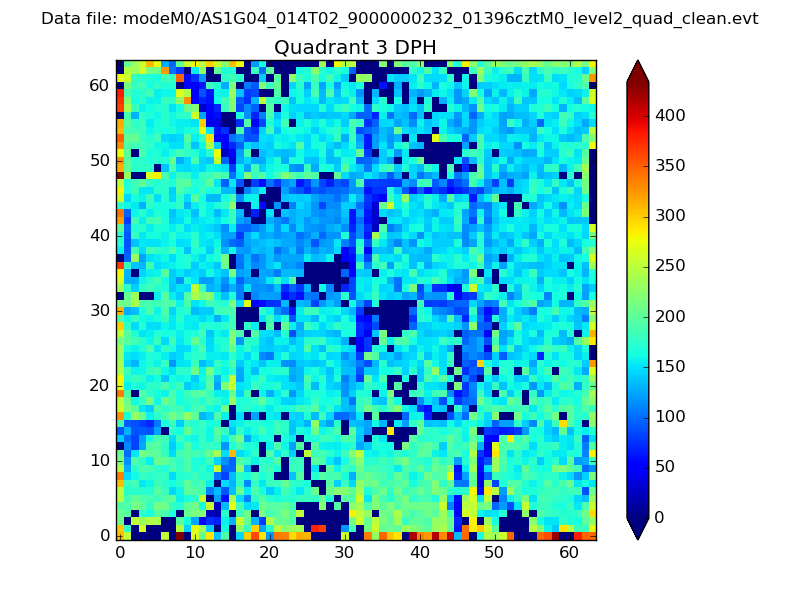 |
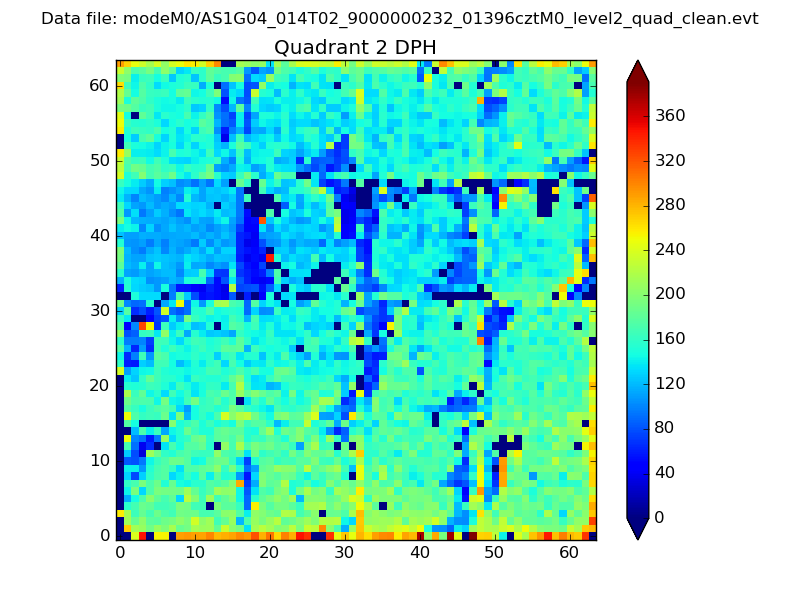 |
Quadrant C |
| Plot type | Count rate plots | Images |
|---|---|---|
| Comparison with Poisson distribution Blue bars denote a histogram of data divided into 1 sec bins. Red curve is a Poisson curve with rate = median count rate of data. |
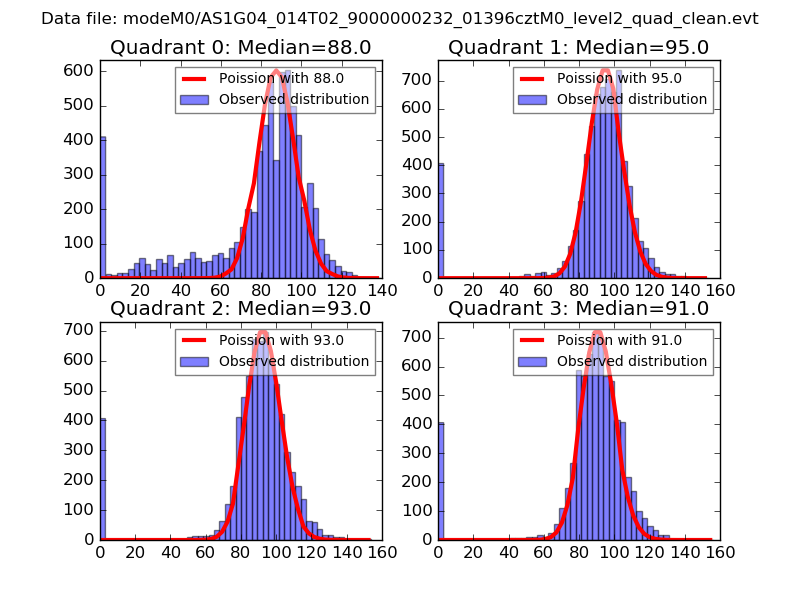 |
 |
| Quadrant-wise count rates Data is divided into 100 sec bins |
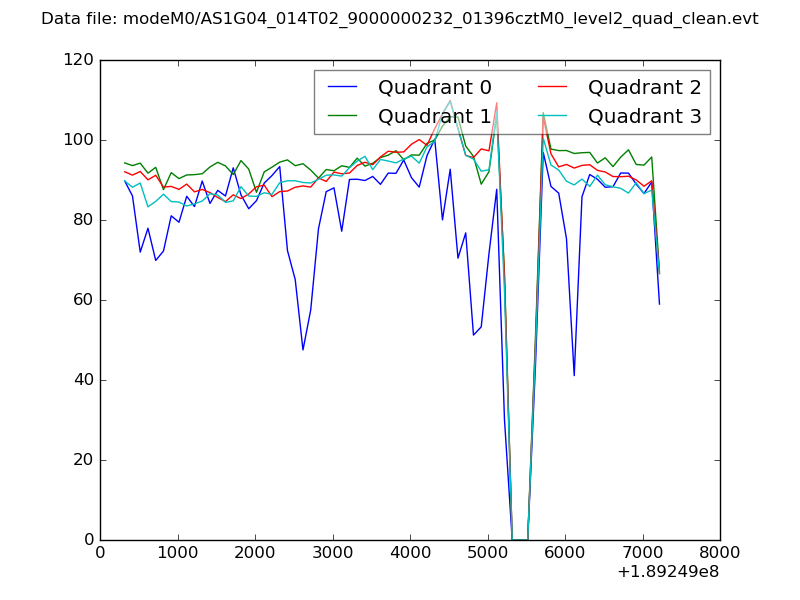 |
|
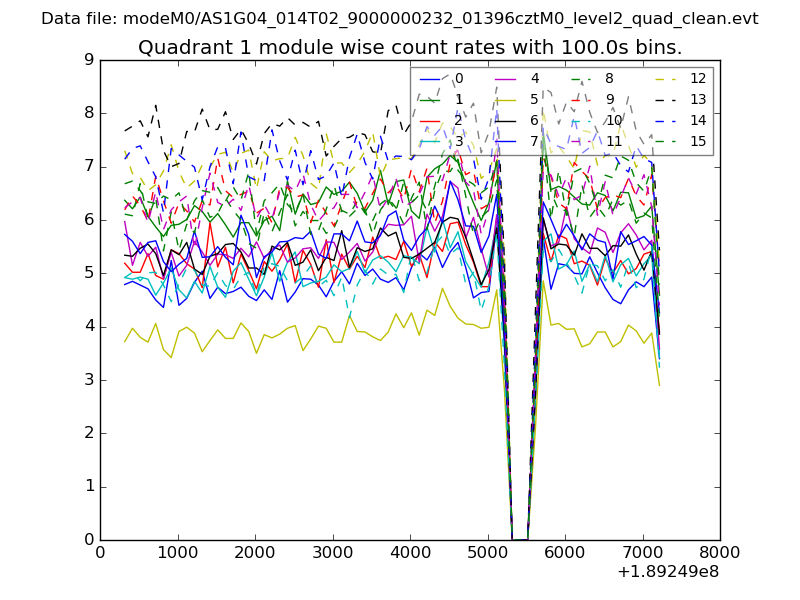
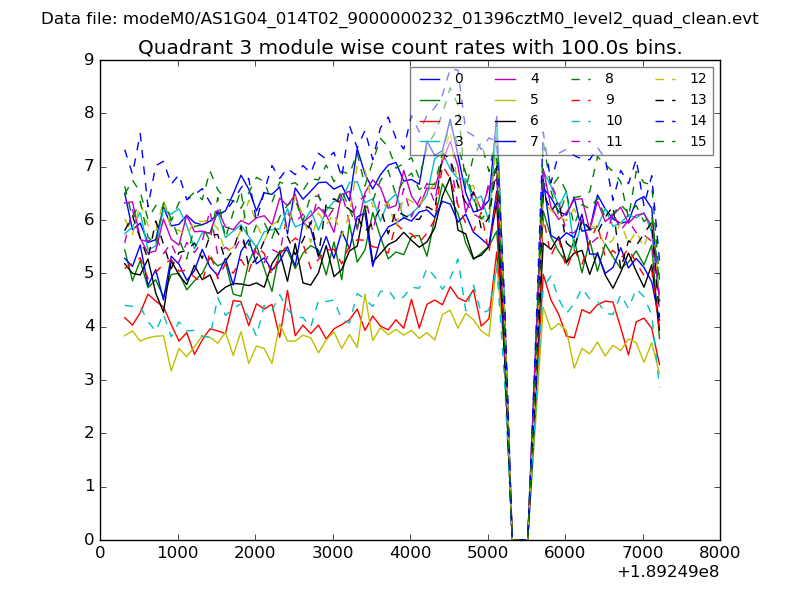
| Module-wise count rates for Quadrant A Data is divided into 100 sec bins |
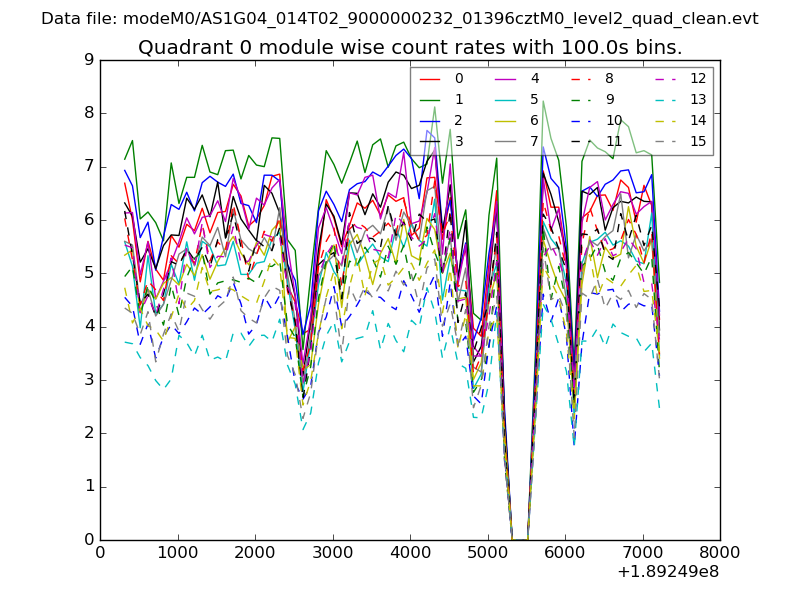 |
 |
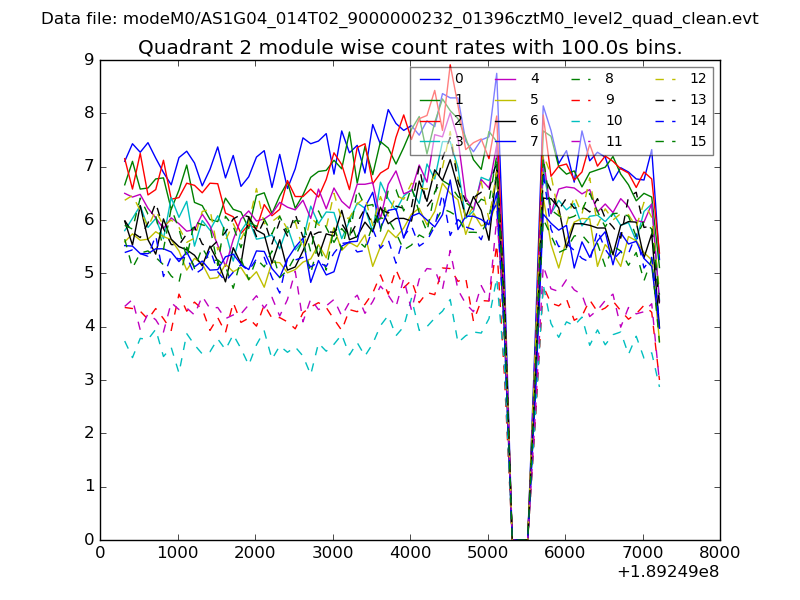
| Module-wise count rates for Quadrant B Data is divided into 100 sec bins |
 |
 |
| Module-wise count rates for Quadrant C Data is divided into 100 sec bins |
 |
 |
| Module-wise count rates for Quadrant D Data is divided into 100 sec bins |
 |
 |
| Parameter | Plot |
|---|---|
| CZT HV Monitor | 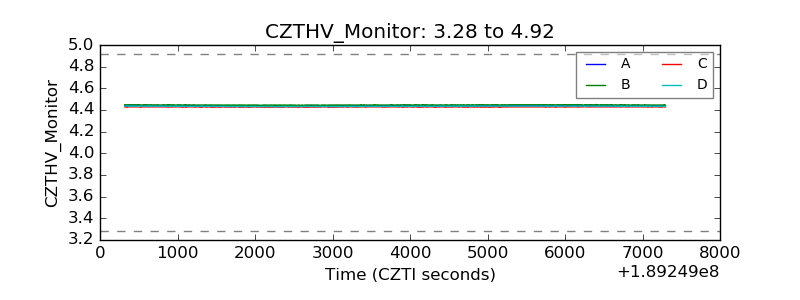 |
| D_VDD | 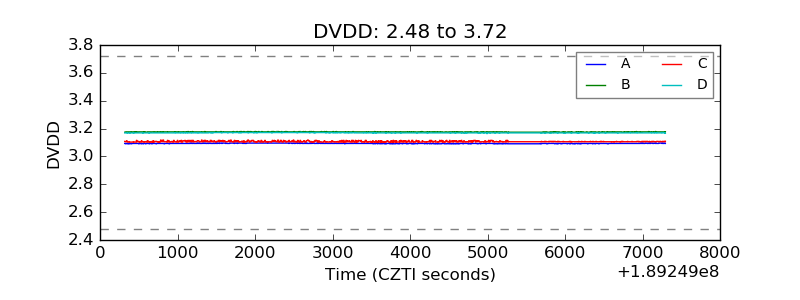 |
| Temperature 1 | 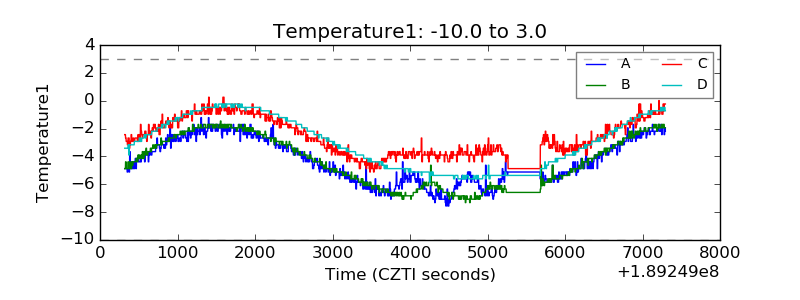 |
| Veto HV Monitor | 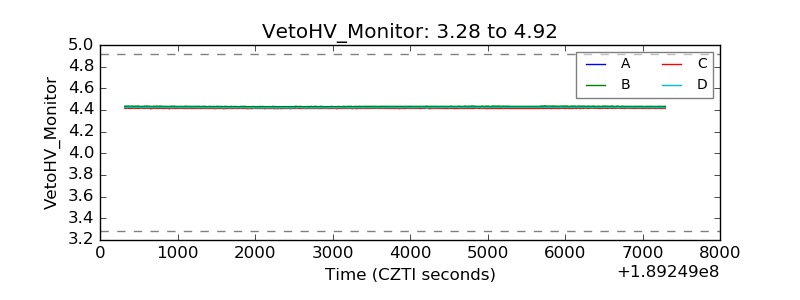 |
| Veto LLD | 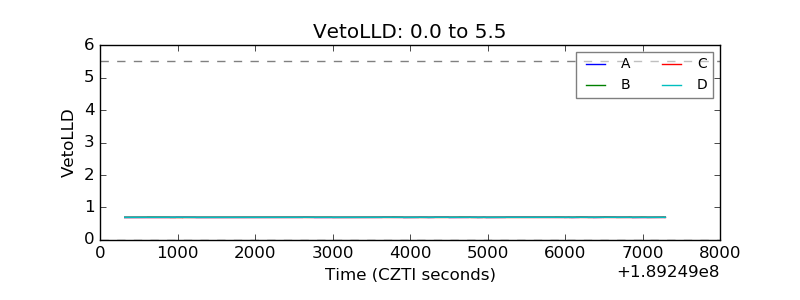 |
| Alpha Counter | 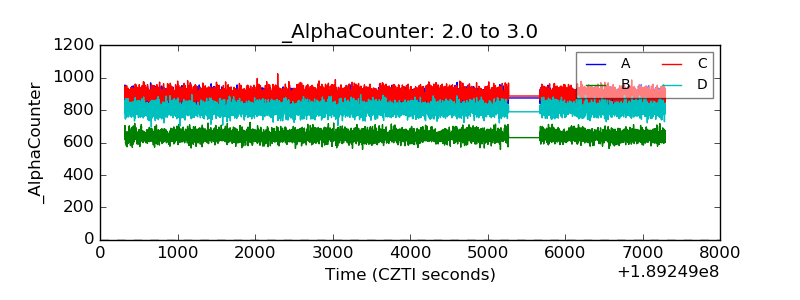 |
| _CPM_Rate | 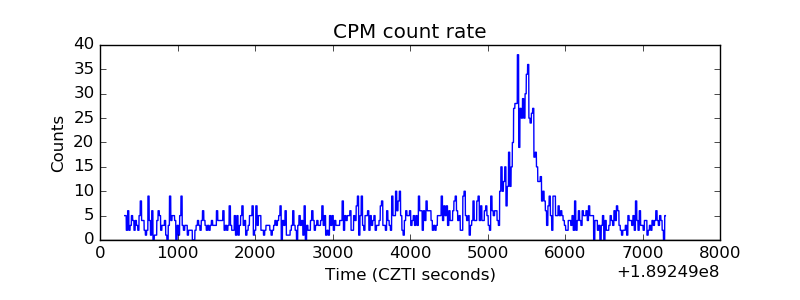 |
| CZT Counter | 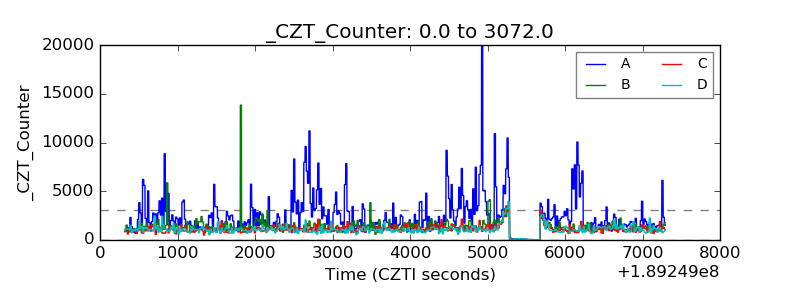 |
| +2.5 Volts monitor |  |
| +5 Volts monitor |  |
| _ROLL_ROT | 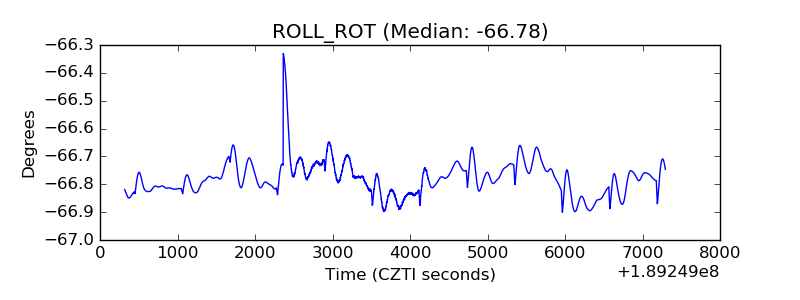 |
| _Roll_DEC | 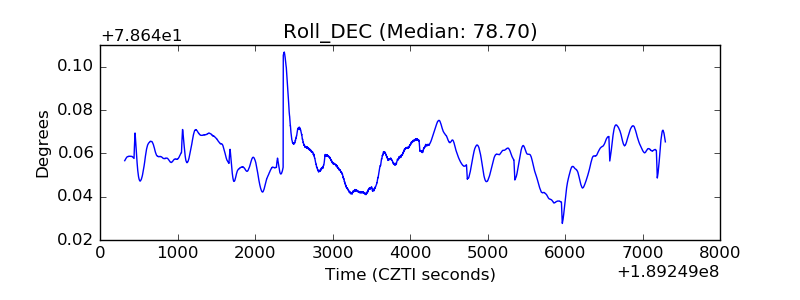 |
| _Roll_RA | 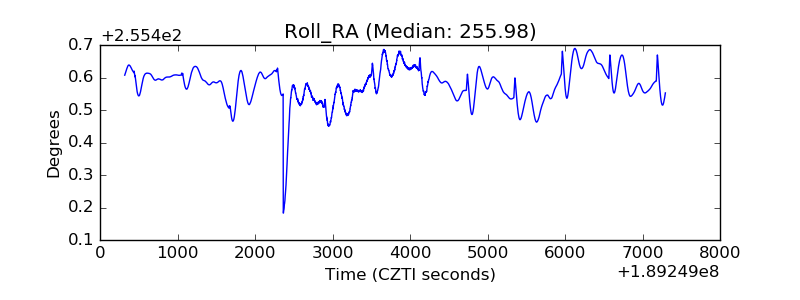 |
| Veto Counter | 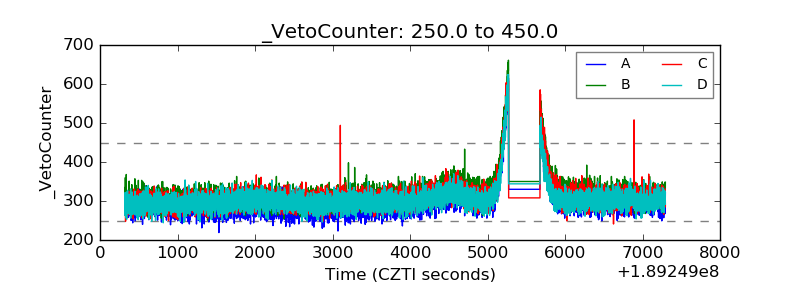 |