| Param | Original file | Final file |
|---|---|---|
| Filename | modeM0/AS1G04_014T02_9000000232_01397cztM0_level2.evt | modeM0/AS1G04_014T02_9000000232_01397cztM0_level2_quad_clean.evt |
| Size (bytes) | 1,241,452,800 | 94,057,920 |
| Size | 1.2 GB | 89.7 MB |
| Events in quadrant A | 13,321,111 | 556,821 |
| Events in quadrant B | 8,557,667 | 628,636 |
| Events in quadrant C | 7,592,426 | 612,926 |
| Events in quadrant D | 7,695,800 | 594,335 |
| Mode SS | |||
|---|---|---|---|
| Quadrant | BADHDUFLAG | Total packets | Discarded packets |
| A | 0 | 134 | 0 |
| B | 0 | 134 | 0 |
| C | 0 | 134 | 0 |
| D | 0 | 134 | 0 |
| Mode M0 | |||
|---|---|---|---|
| Quadrant | BADHDUFLAG | Total packets | Discarded packets |
| A | 0 | 44379 | 2 |
| B | 0 | 30038 | 1 |
| C | 0 | 27184 | 1 |
| D | 0 | 27529 | 1 |
| Mode M9 | |||
|---|---|---|---|
| Quadrant | BADHDUFLAG | Total packets | Discarded packets |
| A | 0 | 6 | 0 |
| B | 0 | 6 | 0 |
| C | 0 | 6 | 0 |
| D | 0 | 6 | 0 |
| Quadrant | Total seconds | Saturated seconds | Saturation percentage |
|---|---|---|---|
| A | 6518 | 1373 | 21.064744% |
| B | 6518 | 78 | 1.196686% |
| C | 6518 | 17 | 0.260816% |
| D | 6518 | 252 | 3.866217% |
Noise dominated data is calculated using 1-second bins in cleaned event files. If a bin has >2000 counts, and if more than 50% of those come from <1% of pixels, then it is considered to be noise-dominated and hence unusable.
| Quadrant | # 1 sec bins | Bins with >0 counts | Bins with >2000 counts | High rate bins dominated by noise | Noise dominated (total time) | Noise dominated (detector-on time) | Marked lightcurve |
|---|---|---|---|---|---|---|---|
| A | 7148 | 6518 | 2912 | 2912 | 40.74% | 44.68% | 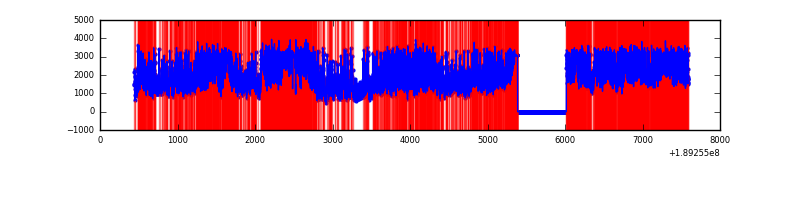 |
| B | 7148 | 6519 | 361 | 361 | 5.05% | 5.54% | 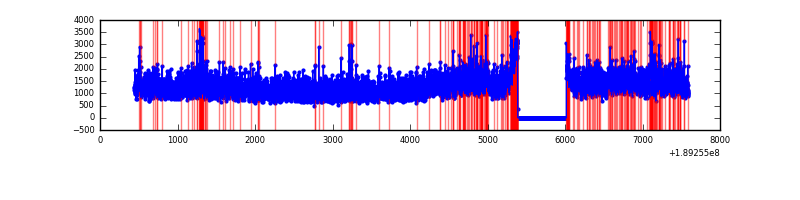 |
| C | 7148 | 6518 | 129 | 129 | 1.80% | 1.98% | 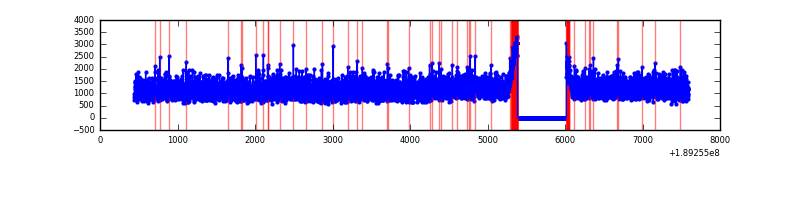 |
| D | 7148 | 6518 | 366 | 366 | 5.12% | 5.62% | 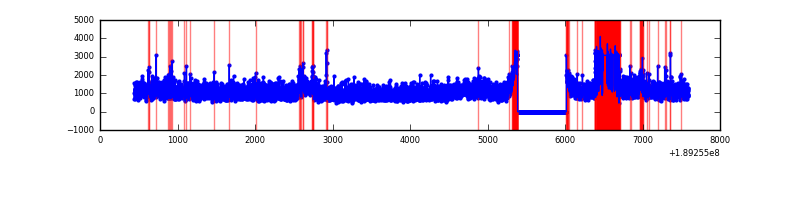 |
Top three noisy pixels from each quadrant. If the there are fewer than three noisy pixels in the level2.evt file, extra rows are filled as -1
| Pixel properties | Quadrant properties | ||||||
|---|---|---|---|---|---|---|---|
| Quadrant | DetID | PixID | Counts | Sigma | Mean | Median | Sigma |
| A | 15 | 127 | 5438889 | 12303.95 | 1836 | 1849 | 441.9 |
| A | 4 | 32 | 671886 | 1516.29 | 1836 | 1849 | 441.9 |
| A | 15 | 233 | 65210 | 143.39 | 1836 | 1849 | 441.9 |
| B | 12 | 52 | 232299 | 477.74 | 2034 | 2045 | 482.0 |
| B | 5 | 191 | 166972 | 342.19 | 2034 | 2045 | 482.0 |
| B | 8 | 4 | 165288 | 338.7 | 2034 | 2045 | 482.0 |
| C | 15 | 241 | 224181 | 423.76 | 1871 | 1940 | 524.4 |
| C | 3 | 79 | 27312 | 48.38 | 1871 | 1940 | 524.4 |
| C | 3 | 111 | 23967 | 42.0 | 1871 | 1940 | 524.4 |
| D | 9 | 65 | 87564 | 144.3 | 1894 | 1900 | 593.6 |
| D | 9 | 53 | 57635 | 93.89 | 1894 | 1900 | 593.6 |
| D | 12 | 22 | 55653 | 90.55 | 1894 | 1900 | 593.6 |
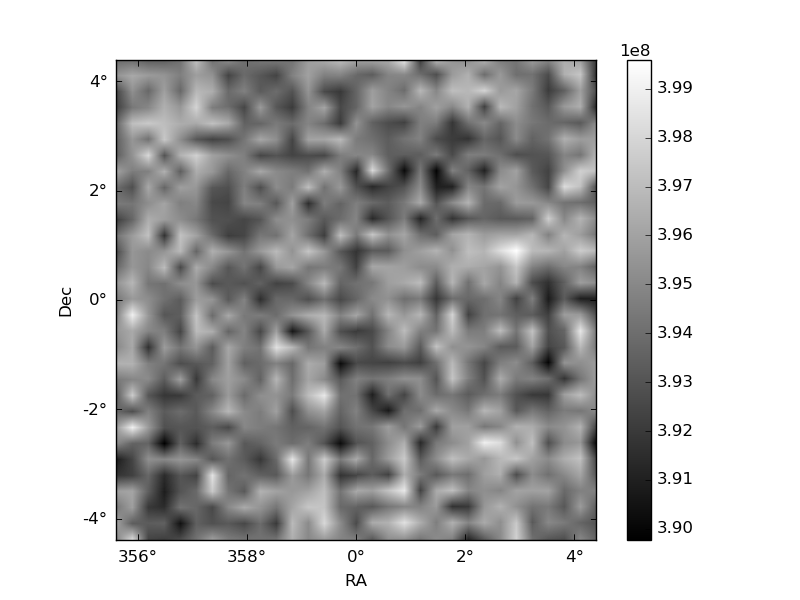
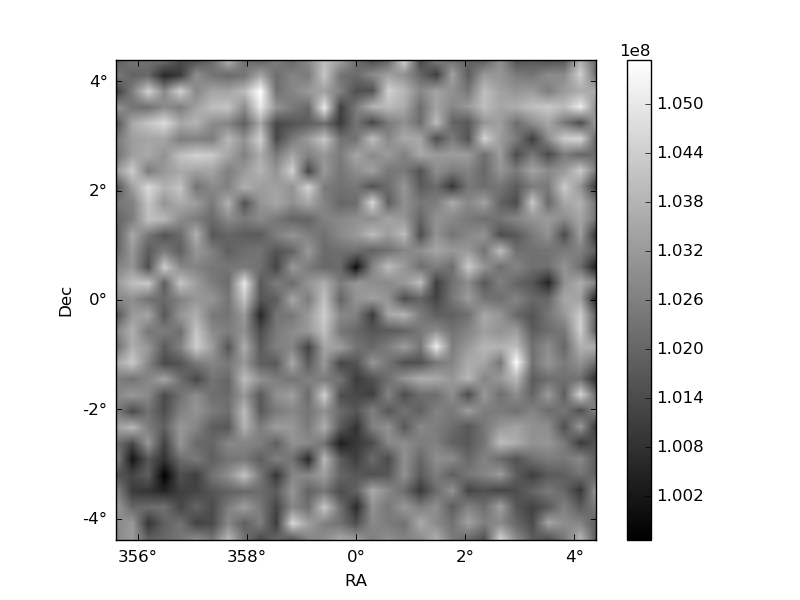
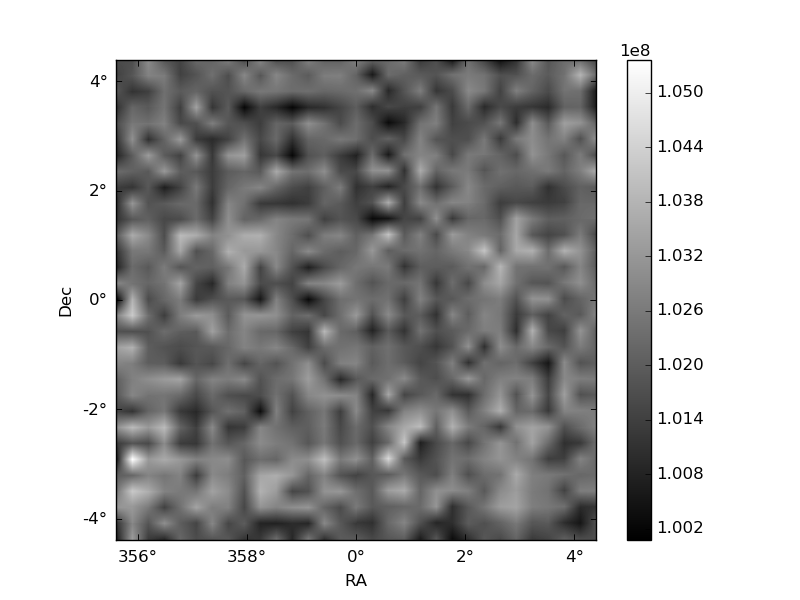
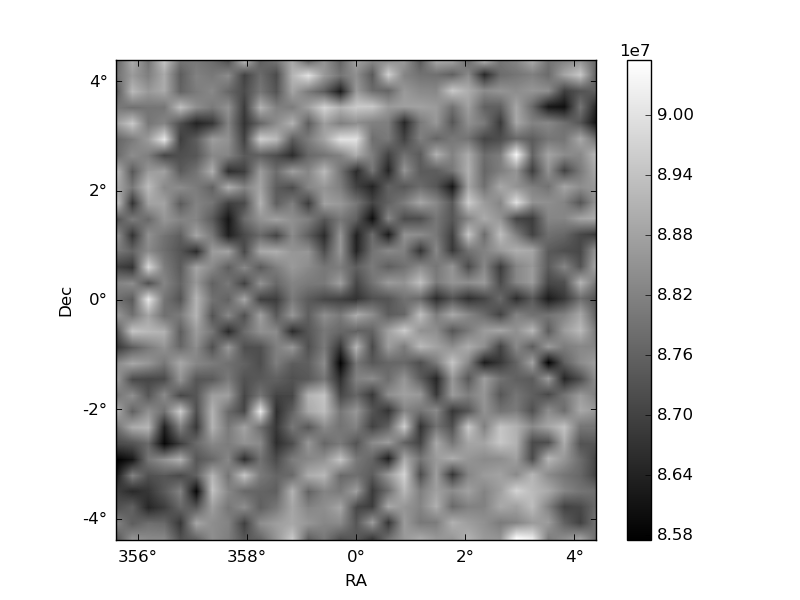
Histogram calculated using DETX and DETY for each event in the final _common_clean file
| Quadrant A | 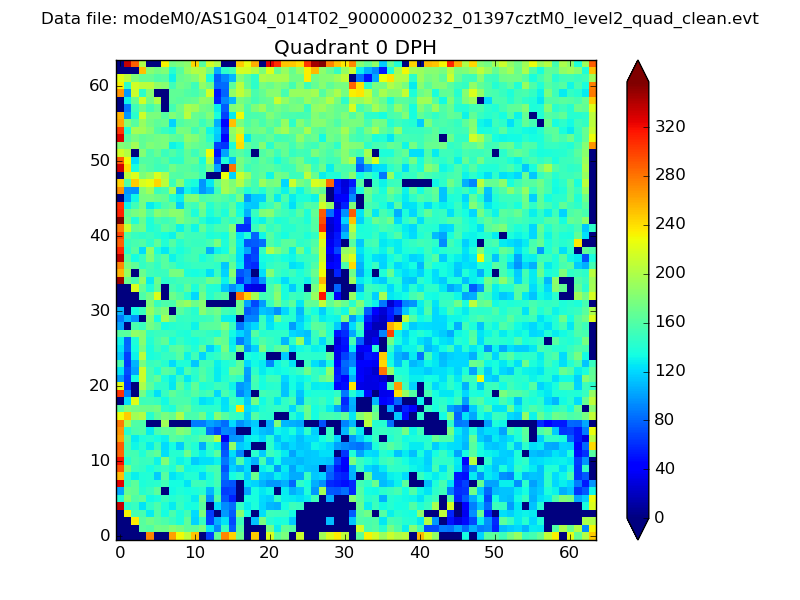 |
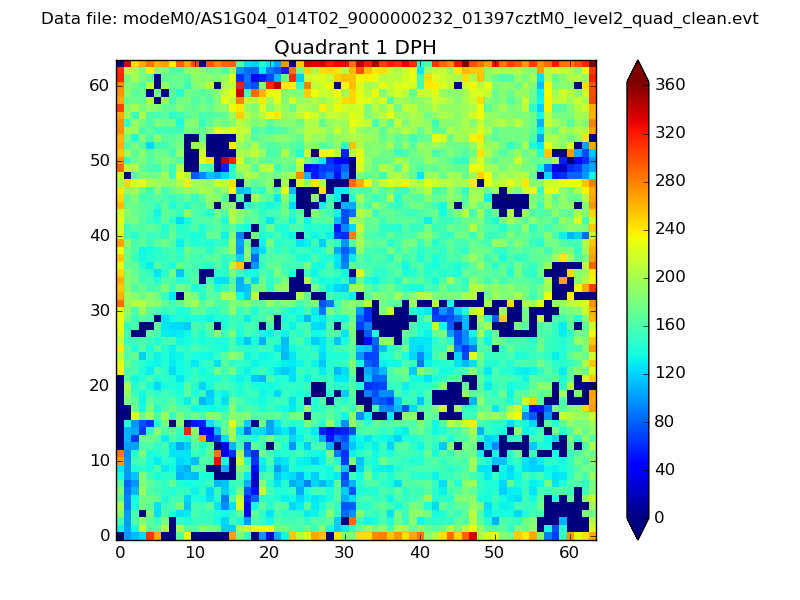 |
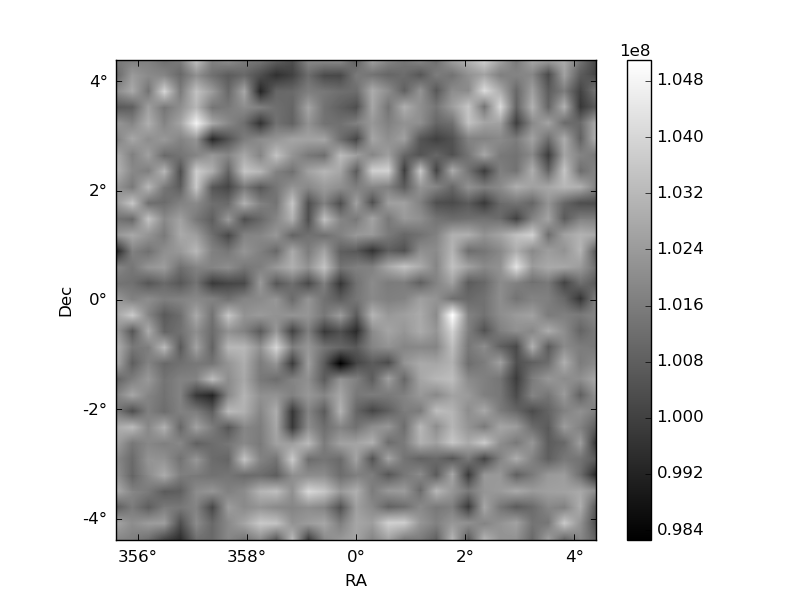
Quadrant B |
|---|---|---|---|
| Quadrant D | 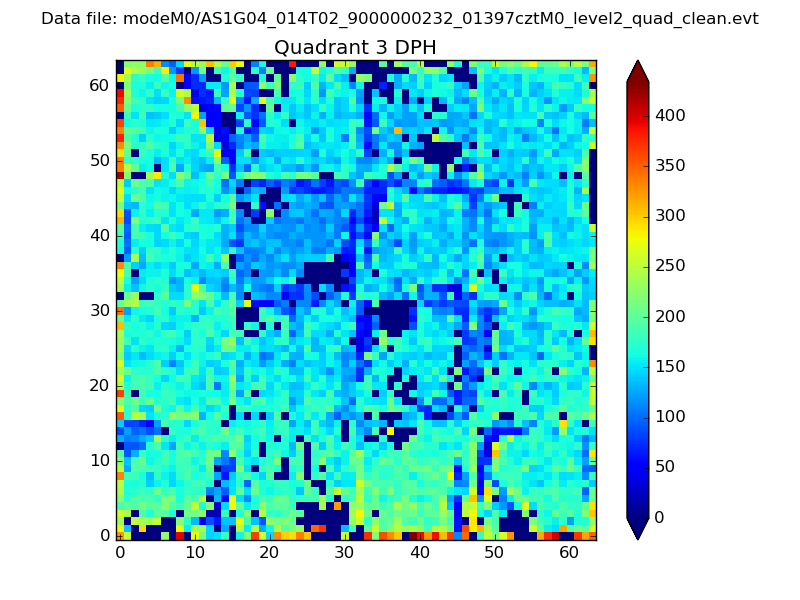 |
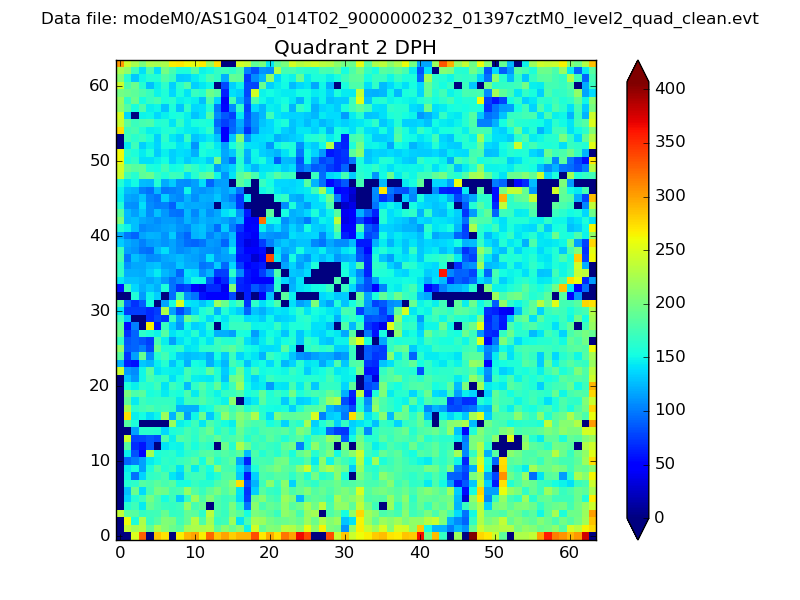 |
Quadrant C |
| Plot type | Count rate plots | Images |
|---|---|---|
| Comparison with Poisson distribution Blue bars denote a histogram of data divided into 1 sec bins. Red curve is a Poisson curve with rate = median count rate of data. |
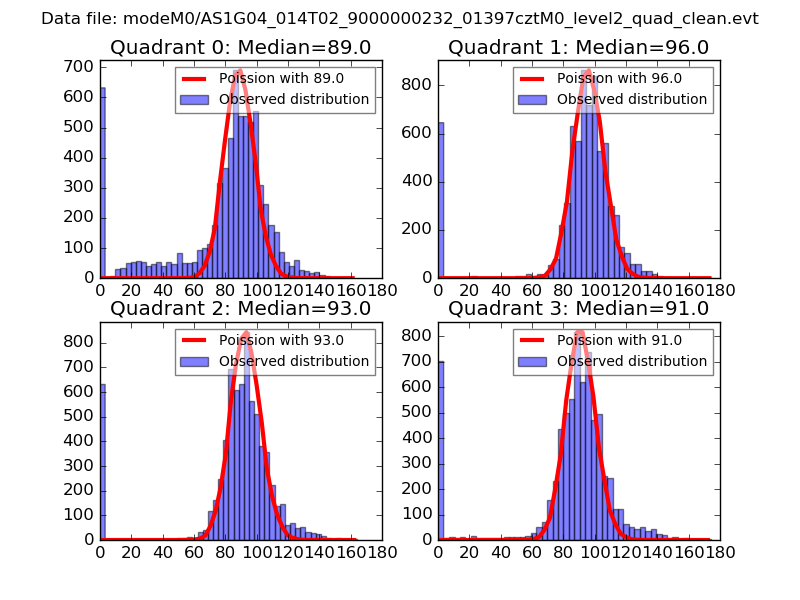 |
 |
| Quadrant-wise count rates Data is divided into 100 sec bins |
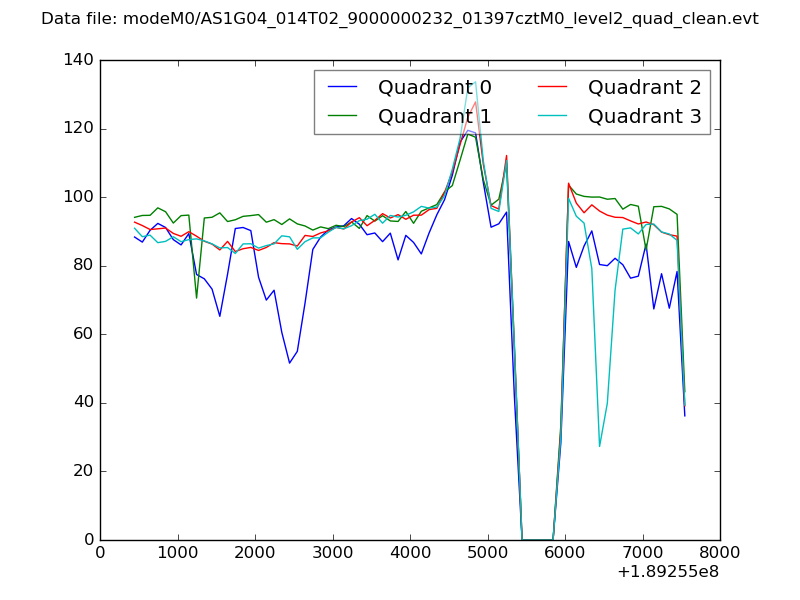 |
|
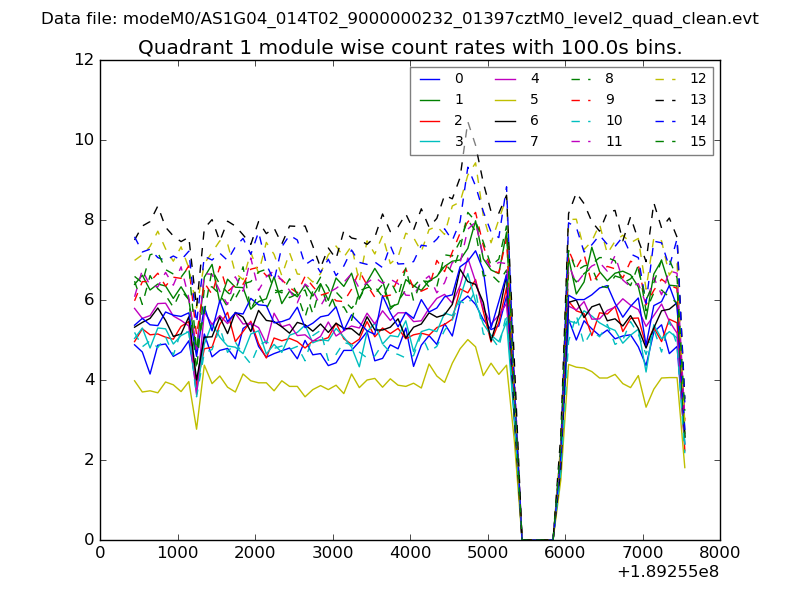
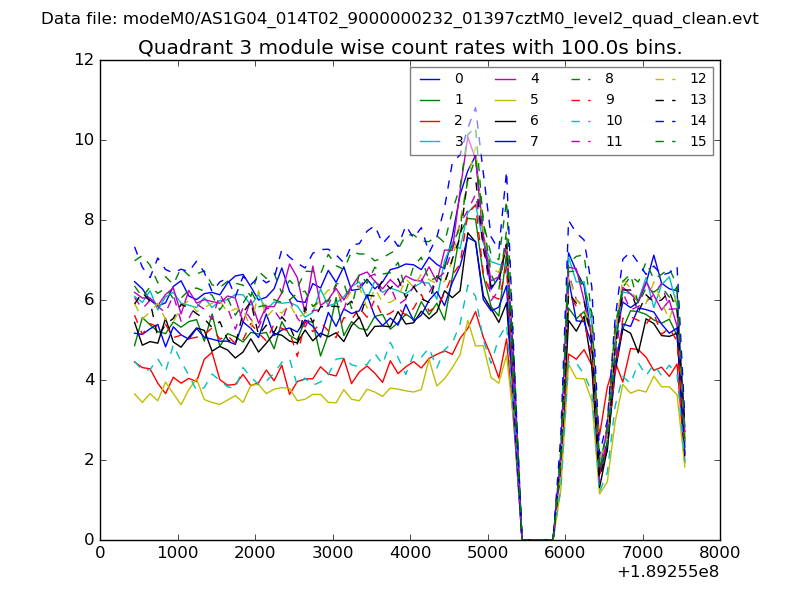
| Module-wise count rates for Quadrant A Data is divided into 100 sec bins |
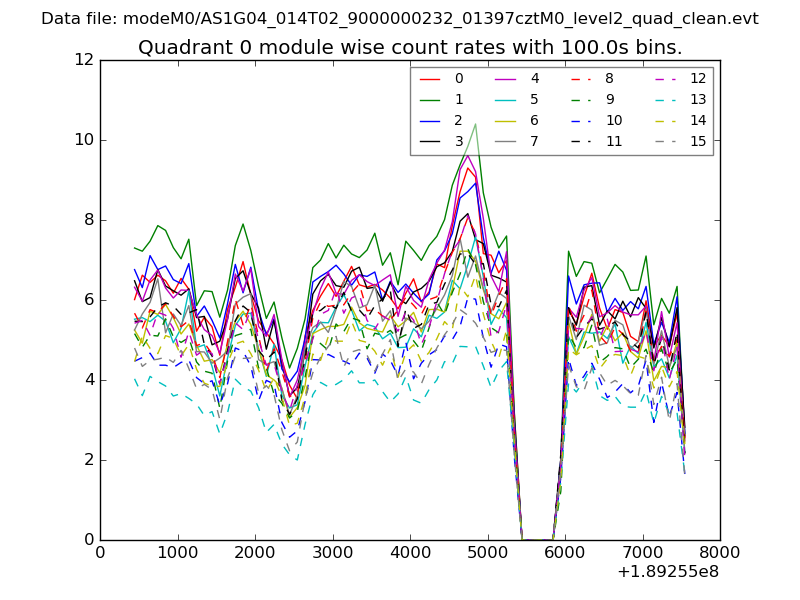 |
 |
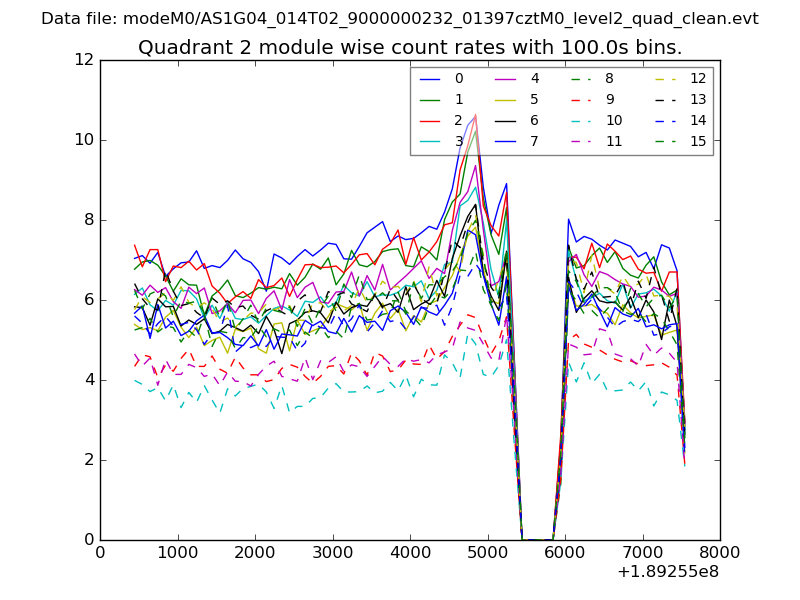
| Module-wise count rates for Quadrant B Data is divided into 100 sec bins |
 |
 |
| Module-wise count rates for Quadrant C Data is divided into 100 sec bins |
 |
 |
| Module-wise count rates for Quadrant D Data is divided into 100 sec bins |
 |
 |
| Parameter | Plot |
|---|---|
| CZT HV Monitor | 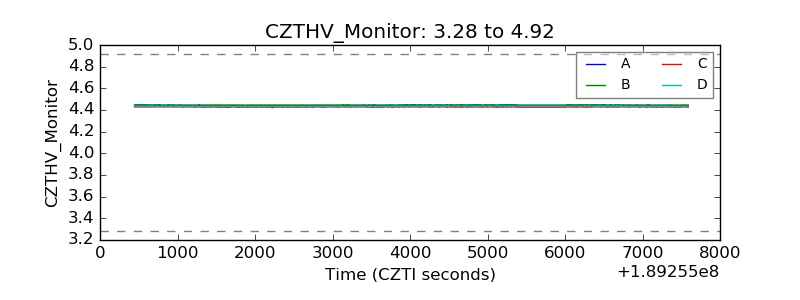 |
| D_VDD | 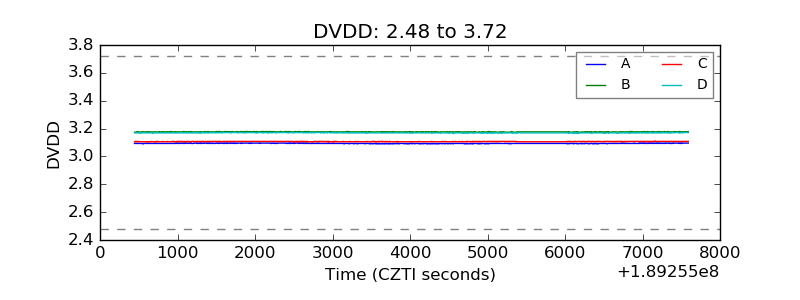 |
| Temperature 1 | 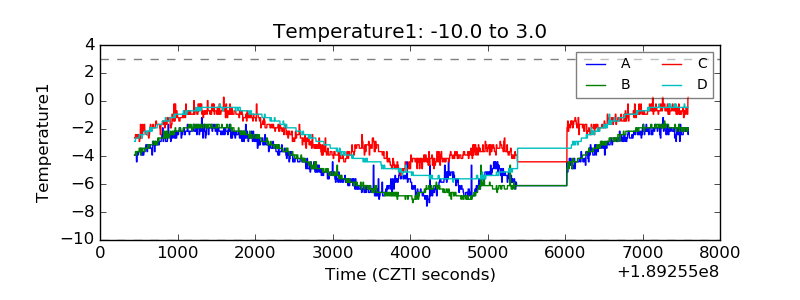 |
| Veto HV Monitor | 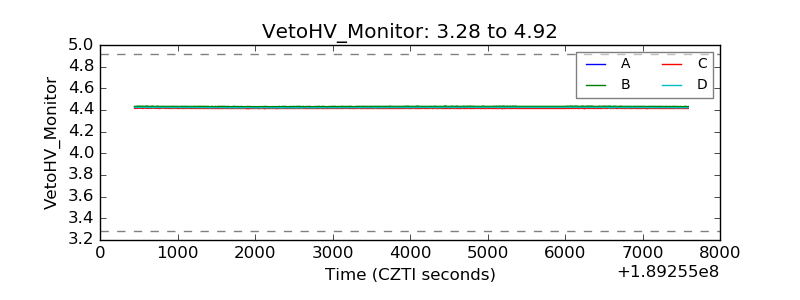 |
| Veto LLD | 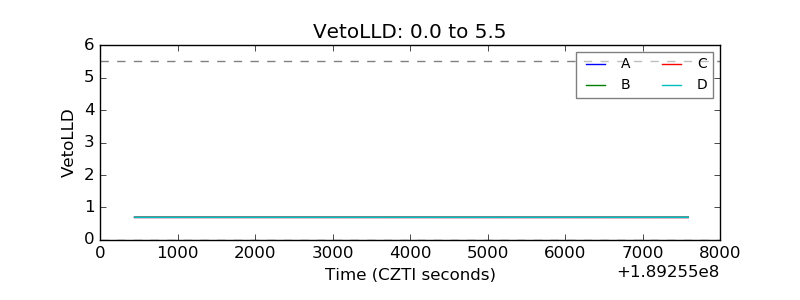 |
| Alpha Counter | 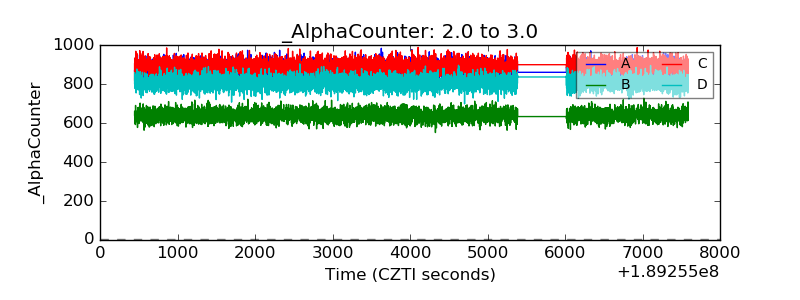 |
| _CPM_Rate | 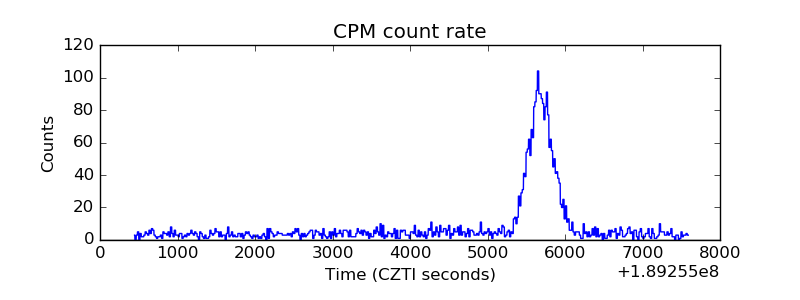 |
| CZT Counter | 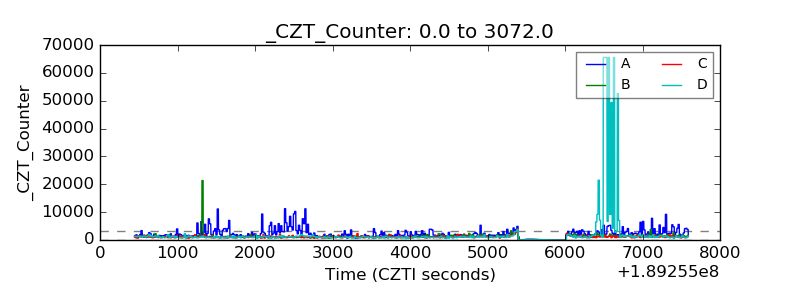 |
| +2.5 Volts monitor |  |
| +5 Volts monitor |  |
| _ROLL_ROT | 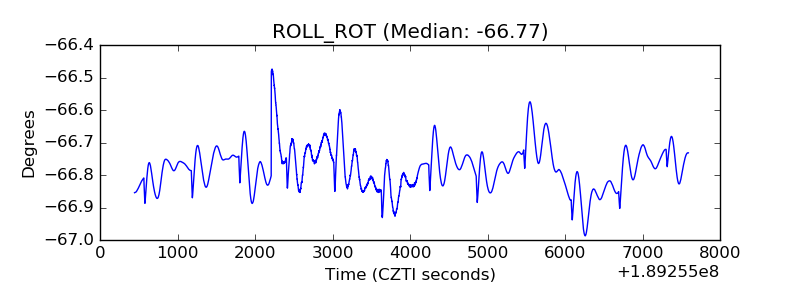 |
| _Roll_DEC | 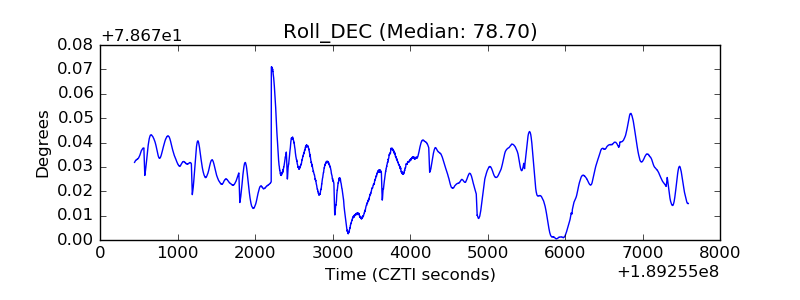 |
| _Roll_RA | 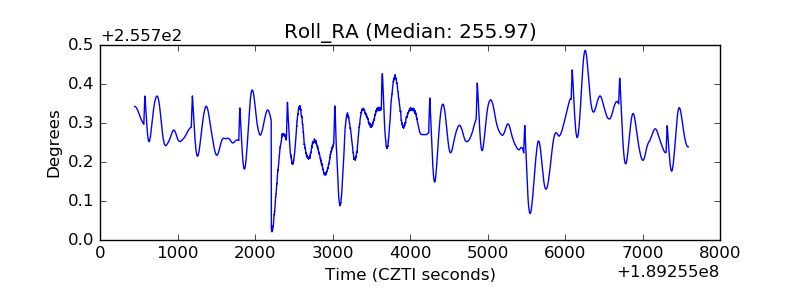 |
| Veto Counter | 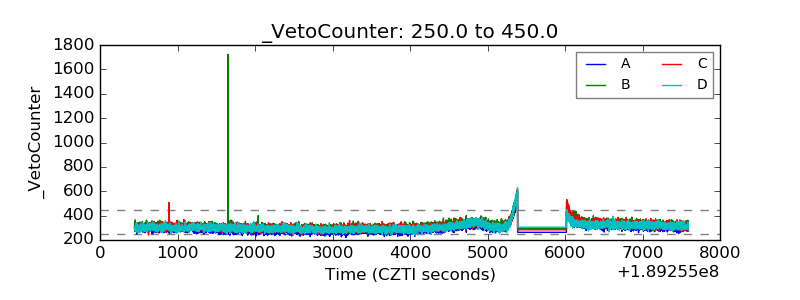 |