| Param | Original file | Final file |
|---|---|---|
| Filename | modeM0/AS1G04_014T02_9000000232_01401cztM0_level2.evt | modeM0/AS1G04_014T02_9000000232_01401cztM0_level2_quad_clean.evt |
| Size (bytes) | 1,074,919,680 | 88,116,480 |
| Size | 1.0 GB | 84.0 MB |
| Events in quadrant A | 11,443,400 | 519,596 |
| Events in quadrant B | 7,228,762 | 592,895 |
| Events in quadrant C | 6,810,490 | 578,984 |
| Events in quadrant D | 6,686,203 | 569,431 |
| Mode SS | |||
|---|---|---|---|
| Quadrant | BADHDUFLAG | Total packets | Discarded packets |
| A | 0 | 118 | 0 |
| B | 0 | 118 | 0 |
| C | 0 | 118 | 0 |
| D | 0 | 118 | 0 |
| Mode M0 | |||
|---|---|---|---|
| Quadrant | BADHDUFLAG | Total packets | Discarded packets |
| A | 0 | 38264 | 2 |
| B | 0 | 25631 | 1 |
| C | 0 | 24358 | 1 |
| D | 0 | 24017 | 1 |
| Mode M9 | |||
|---|---|---|---|
| Quadrant | BADHDUFLAG | Total packets | Discarded packets |
| A | 0 | 11 | 0 |
| B | 0 | 11 | 0 |
| C | 0 | 11 | 0 |
| D | 0 | 11 | 0 |
| Quadrant | Total seconds | Saturated seconds | Saturation percentage |
|---|---|---|---|
| A | 5826 | 1210 | 20.768967% |
| B | 5826 | 34 | 0.583591% |
| C | 5826 | 26 | 0.446275% |
| D | 5826 | 27 | 0.463440% |
Noise dominated data is calculated using 1-second bins in cleaned event files. If a bin has >2000 counts, and if more than 50% of those come from <1% of pixels, then it is considered to be noise-dominated and hence unusable.
| Quadrant | # 1 sec bins | Bins with >0 counts | Bins with >2000 counts | High rate bins dominated by noise | Noise dominated (total time) | Noise dominated (detector-on time) | Marked lightcurve |
|---|---|---|---|---|---|---|---|
| A | 6901 | 5826 | 2426 | 2426 | 35.15% | 41.64% | 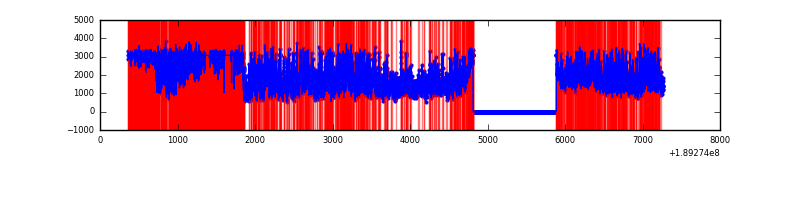 |
| B | 6901 | 5827 | 296 | 296 | 4.29% | 5.08% | 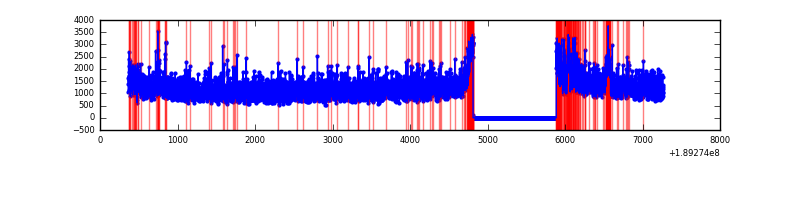 |
| C | 6901 | 5826 | 141 | 141 | 2.04% | 2.42% | 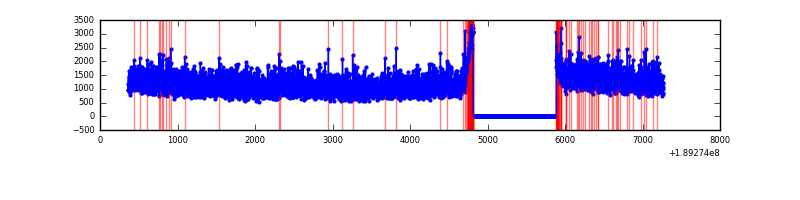 |
| D | 6901 | 5826 | 189 | 189 | 2.74% | 3.24% | 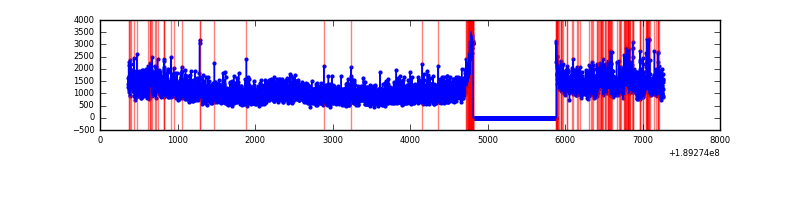 |
Top three noisy pixels from each quadrant. If the there are fewer than three noisy pixels in the level2.evt file, extra rows are filled as -1
| Pixel properties | Quadrant properties | ||||||
|---|---|---|---|---|---|---|---|
| Quadrant | DetID | PixID | Counts | Sigma | Mean | Median | Sigma |
| A | 15 | 127 | 4359356 | 11256.15 | 1614 | 1628 | 387.1 |
| A | 4 | 32 | 756256 | 1949.23 | 1614 | 1628 | 387.1 |
| A | 15 | 233 | 91373 | 231.81 | 1614 | 1628 | 387.1 |
| B | 5 | 191 | 119399 | 275.73 | 1822 | 1832 | 426.4 |
| B | 8 | 4 | 73601 | 168.32 | 1822 | 1832 | 426.4 |
| B | 6 | 53 | 53446 | 121.05 | 1822 | 1832 | 426.4 |
| C | 15 | 241 | 212068 | 451.01 | 1678 | 1736 | 466.4 |
| C | 3 | 79 | 24755 | 49.36 | 1678 | 1736 | 466.4 |
| C | 3 | 111 | 22372 | 44.25 | 1678 | 1736 | 466.4 |
| D | 2 | 16 | 299960 | 599.46 | 1621 | 1677 | 497.6 |
| D | 9 | 53 | 198205 | 394.96 | 1621 | 1677 | 497.6 |
| D | 2 | 88 | 41187 | 79.4 | 1621 | 1677 | 497.6 |
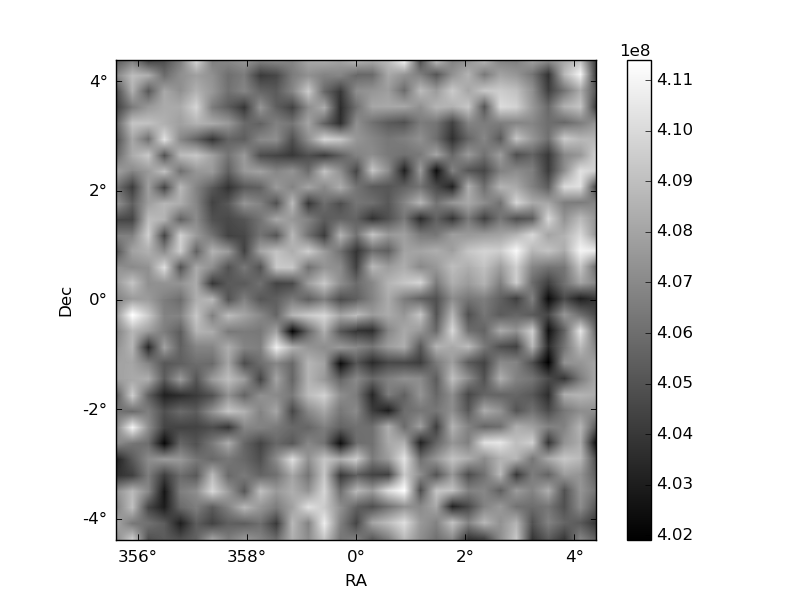
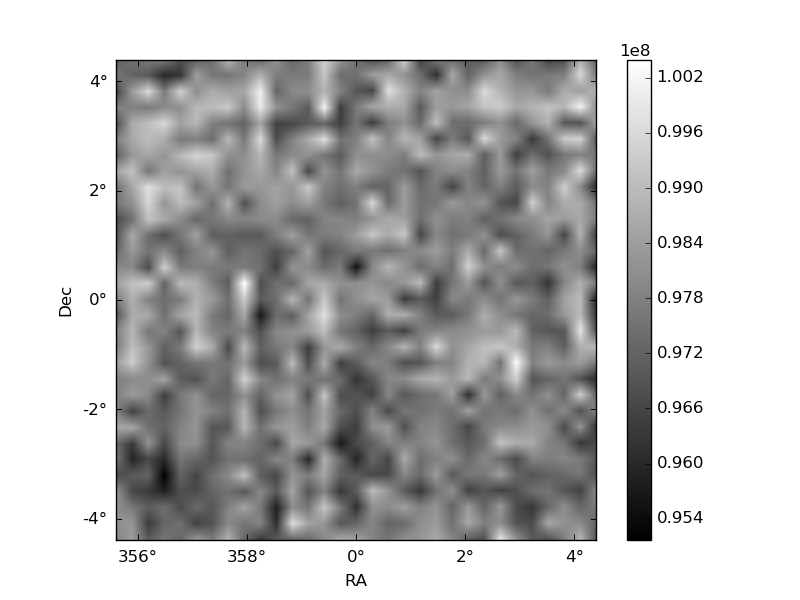
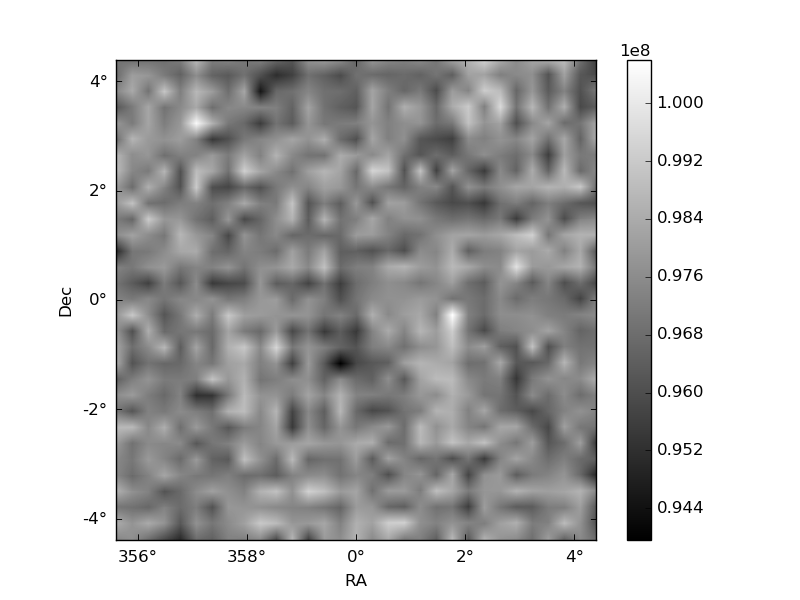
Histogram calculated using DETX and DETY for each event in the final _common_clean file
| Quadrant A | 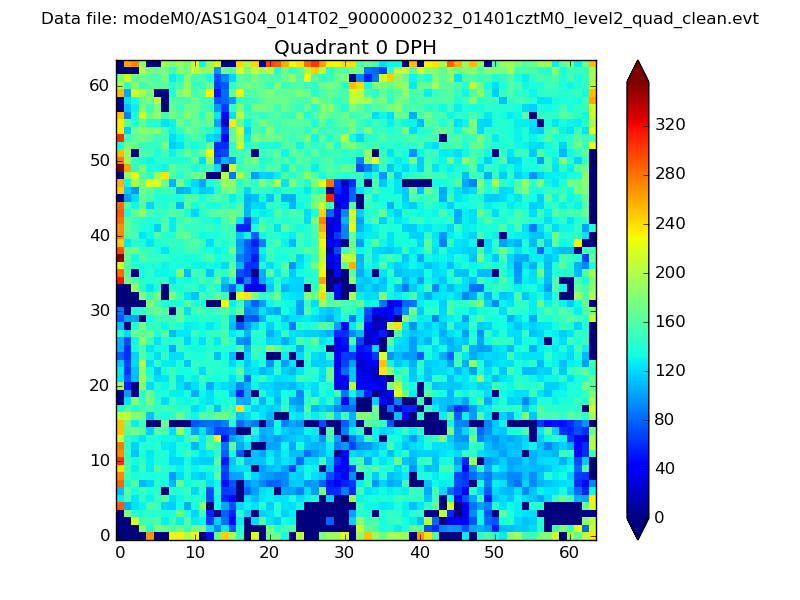 |
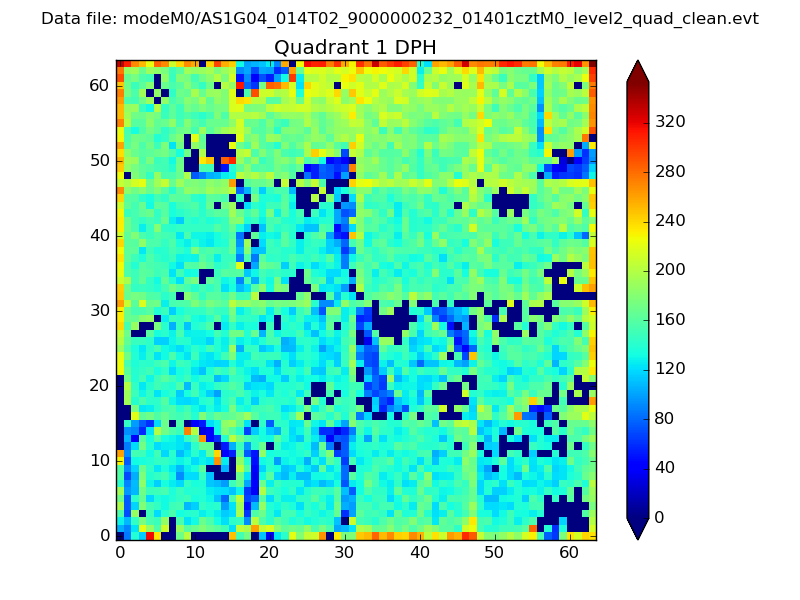 |
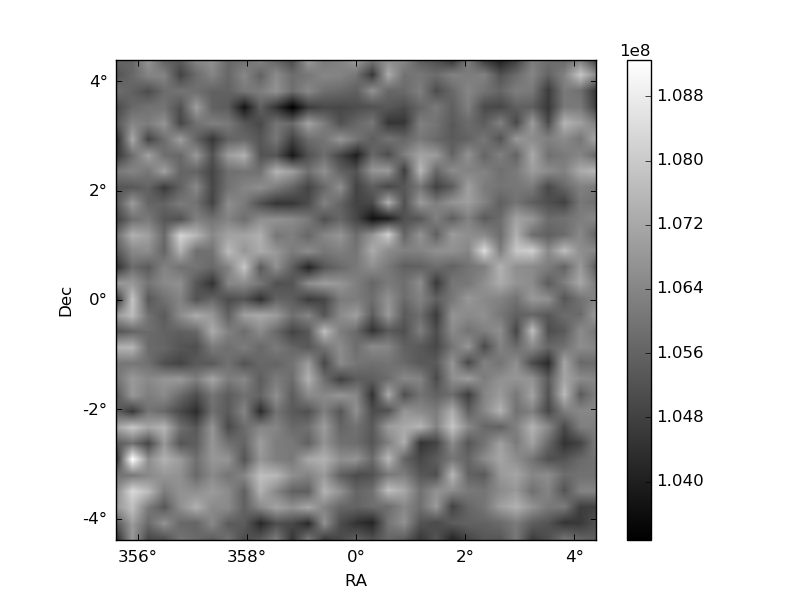
Quadrant B |
|---|---|---|---|
| Quadrant D | 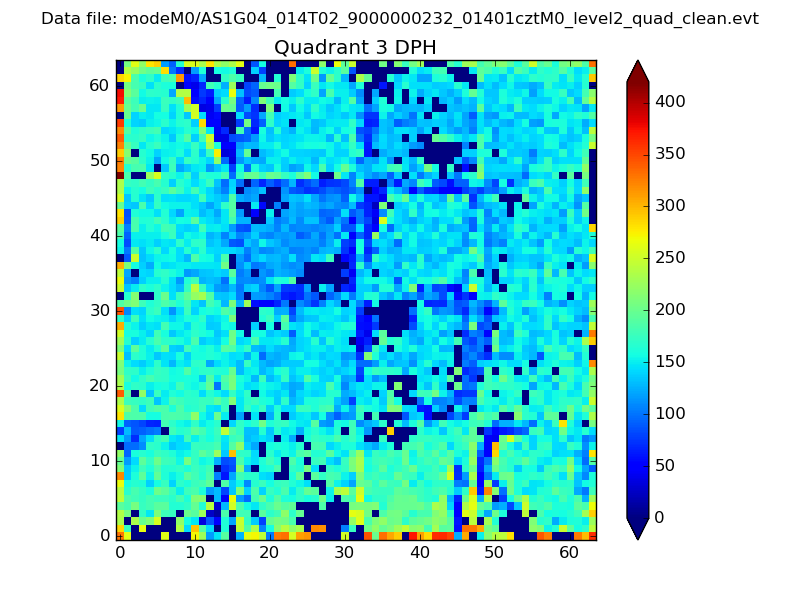 |
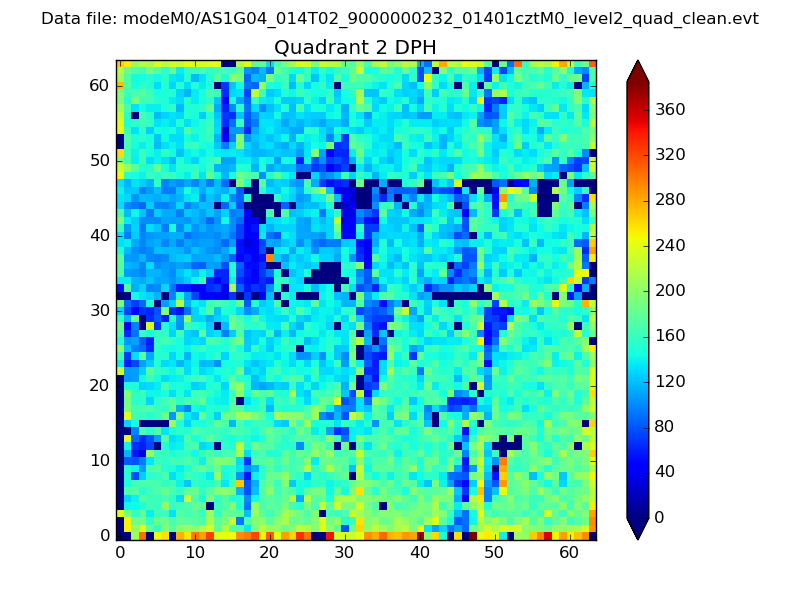 |
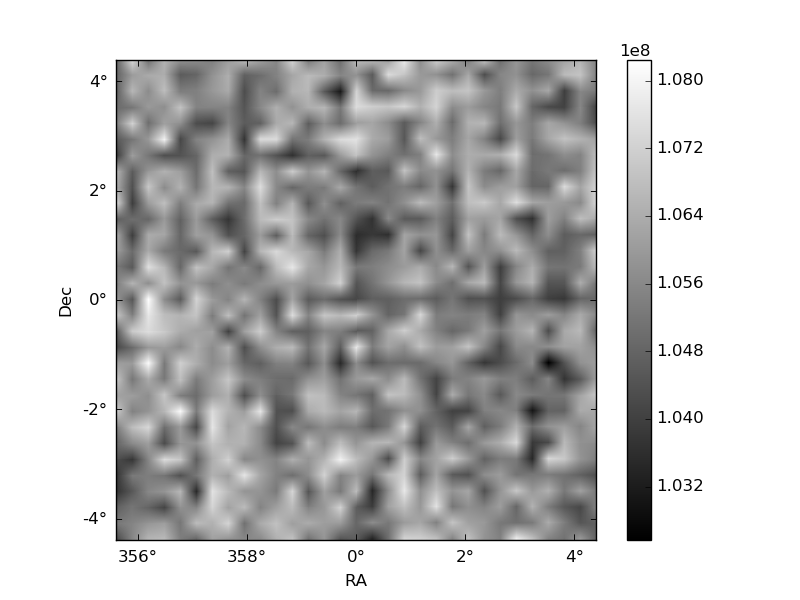
Quadrant C |
| Plot type | Count rate plots | Images |
|---|---|---|
| Comparison with Poisson distribution Blue bars denote a histogram of data divided into 1 sec bins. Red curve is a Poisson curve with rate = median count rate of data. |
 |
 |
| Quadrant-wise count rates Data is divided into 100 sec bins |
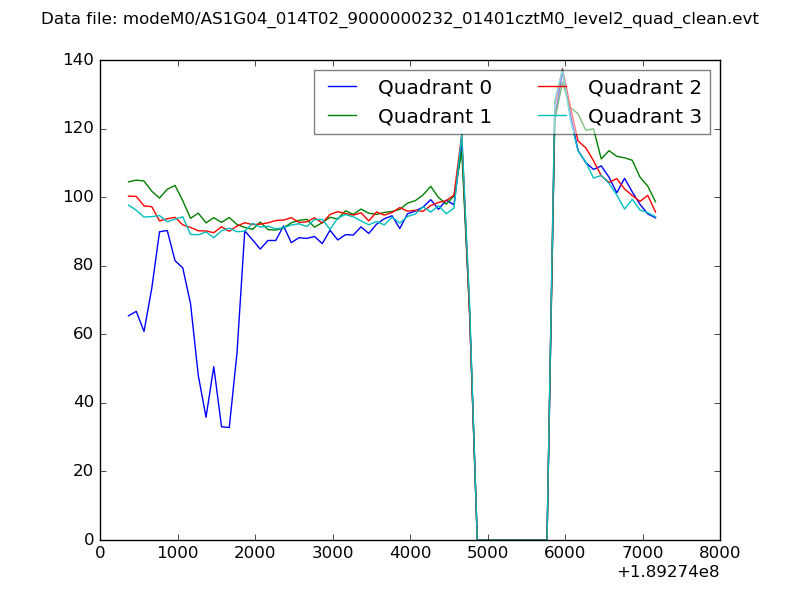 |
|
| Module-wise count rates for Quadrant A Data is divided into 100 sec bins |
 |
 |
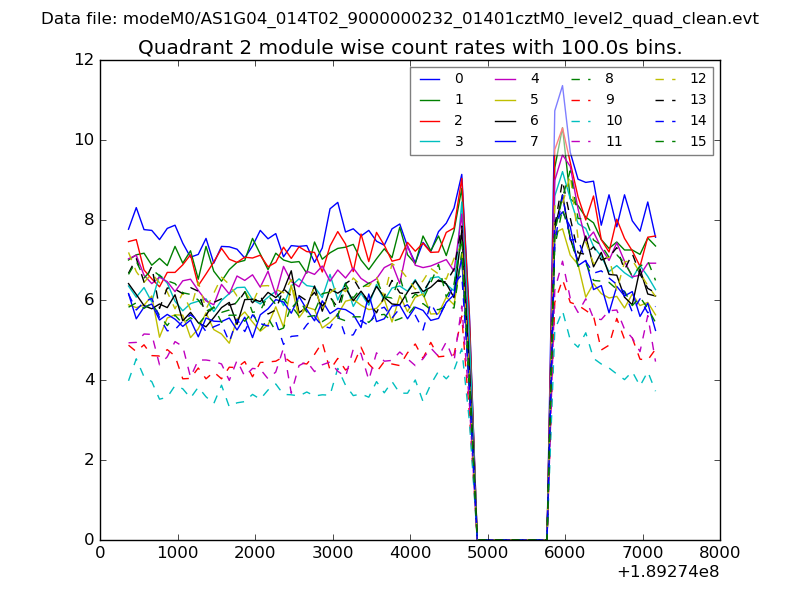
| Module-wise count rates for Quadrant B Data is divided into 100 sec bins |
 |
 |
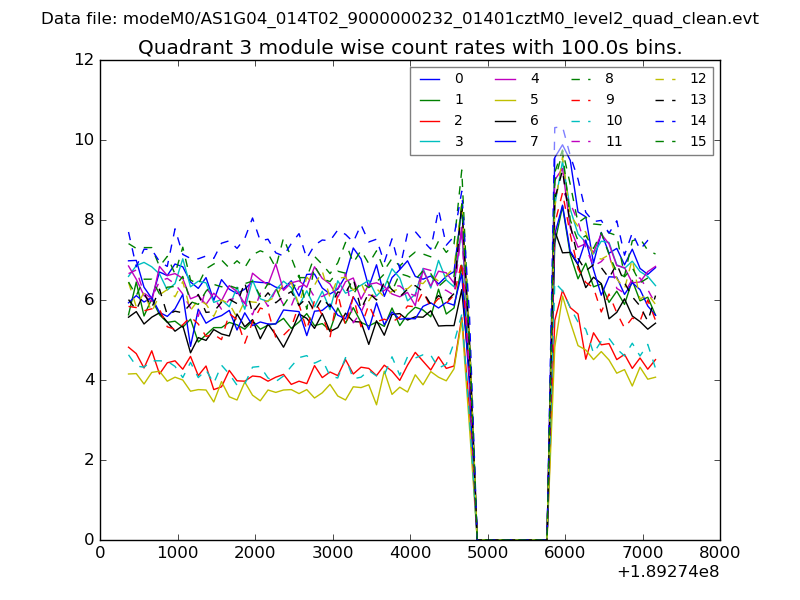
| Module-wise count rates for Quadrant C Data is divided into 100 sec bins |
 |
 |
| Module-wise count rates for Quadrant D Data is divided into 100 sec bins |
 |
 |
| Parameter | Plot |
|---|---|
| CZT HV Monitor | 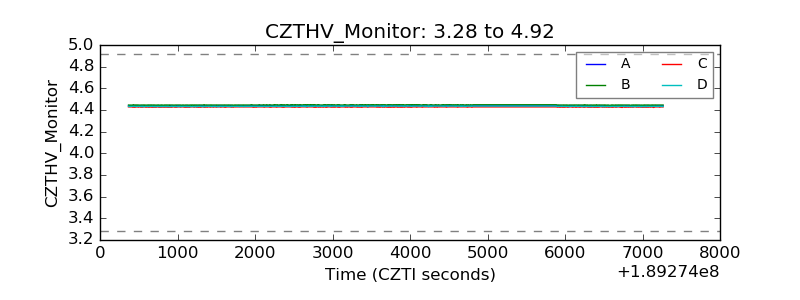 |
| D_VDD | 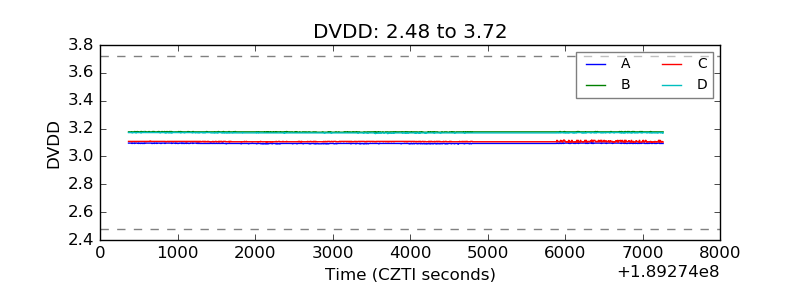 |
| Temperature 1 | 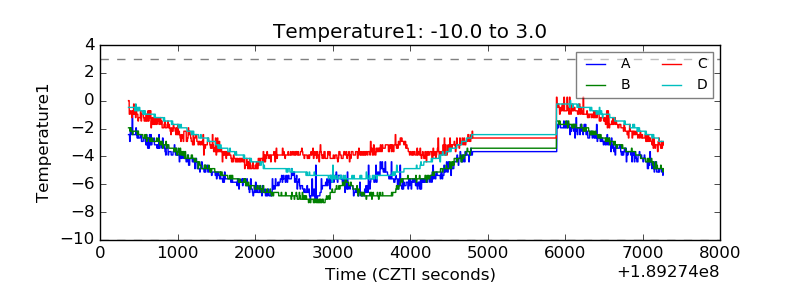 |
| Veto HV Monitor | 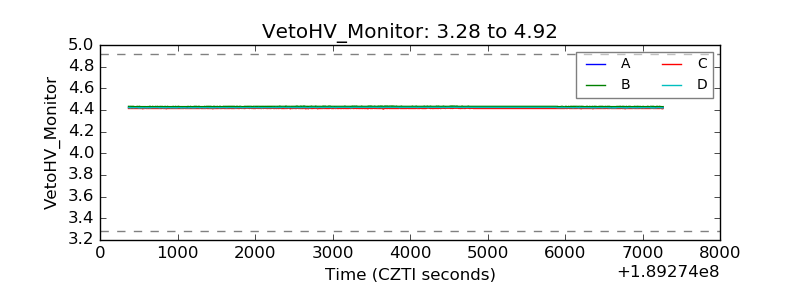 |
| Veto LLD | 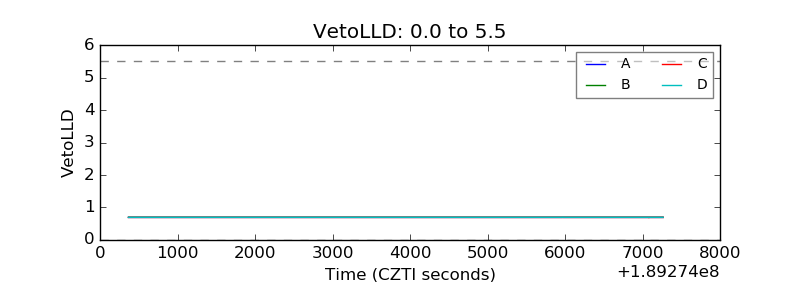 |
| Alpha Counter | 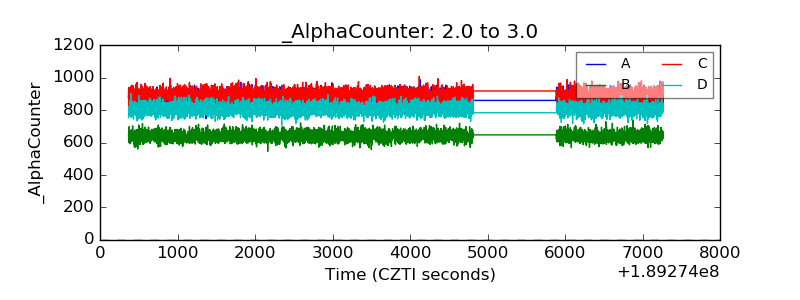 |
| _CPM_Rate | 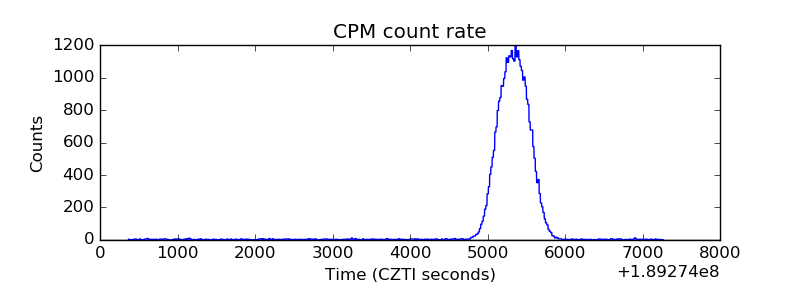 |
| CZT Counter | 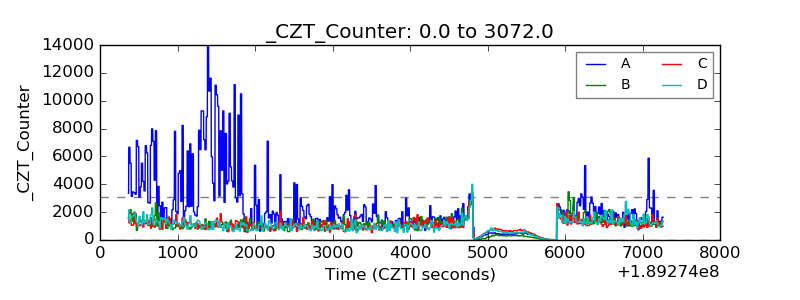 |
| +2.5 Volts monitor |  |
| +5 Volts monitor |  |
| _ROLL_ROT | 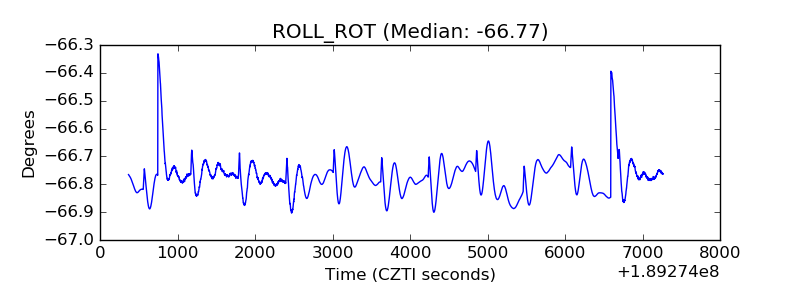 |
| _Roll_DEC | 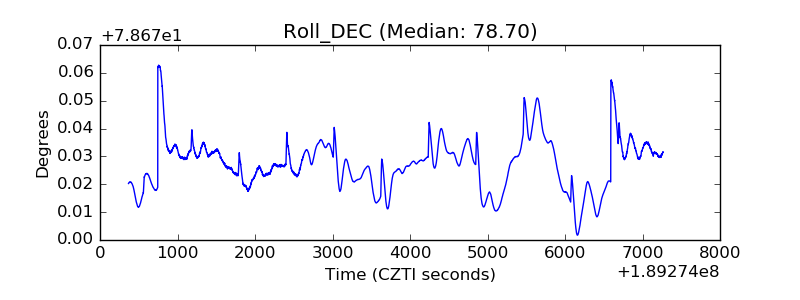 |
| _Roll_RA | 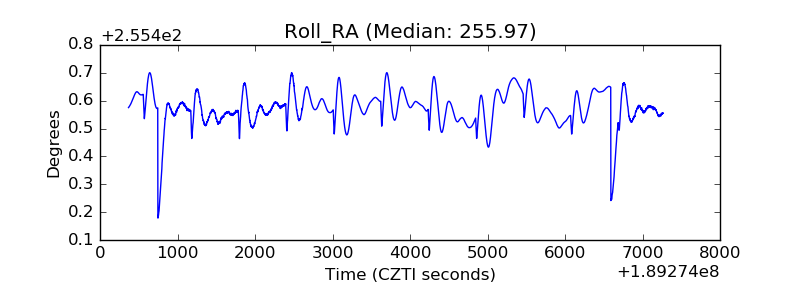 |
| Veto Counter | 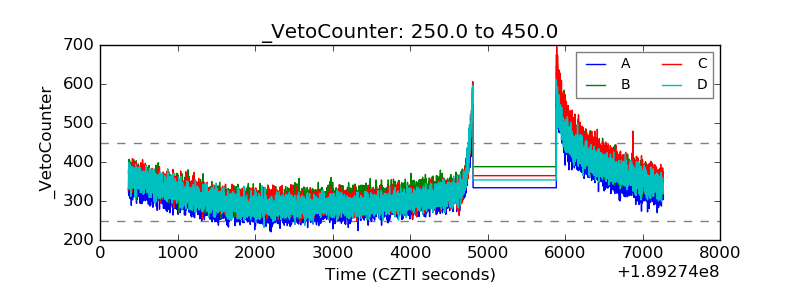 |