| Param | Original file | Final file |
|---|---|---|
| Filename | modeM0/AS1G04_003T01_9000000234_01403cztM0_level2.evt | modeM0/AS1G04_003T01_9000000234_01403cztM0_level2_quad_clean.evt |
| Size (bytes) | 797,760,000 | 73,670,400 |
| Size | 760.8 MB | 70.3 MB |
| Events in quadrant A | 7,238,289 | 459,919 |
| Events in quadrant B | 6,078,441 | 483,129 |
| Events in quadrant C | 5,396,688 | 481,031 |
| Events in quadrant D | 5,124,722 | 466,648 |
| Mode M9 | |||
|---|---|---|---|
| Quadrant | BADHDUFLAG | Total packets | Discarded packets |
| A | 0 | 13 | 0 |
| B | 0 | 13 | 0 |
| C | 0 | 13 | 0 |
| D | 0 | 13 | 0 |
| Mode SS | |||
|---|---|---|---|
| Quadrant | BADHDUFLAG | Total packets | Discarded packets |
| A | 0 | 100 | 0 |
| B | 0 | 100 | 0 |
| C | 0 | 100 | 0 |
| D | 0 | 100 | 0 |
| Mode M0 | |||
|---|---|---|---|
| Quadrant | BADHDUFLAG | Total packets | Discarded packets |
| A | 0 | 24962 | 2 |
| B | 0 | 21470 | 1 |
| C | 0 | 19522 | 1 |
| D | 0 | 18701 | 1 |
| Quadrant | Total seconds | Saturated seconds | Saturation percentage |
|---|---|---|---|
| A | 4842 | 248 | 5.121850% |
| B | 4842 | 30 | 0.619579% |
| C | 4842 | 2 | 0.041305% |
| D | 4842 | 12 | 0.247831% |
Noise dominated data is calculated using 1-second bins in cleaned event files. If a bin has >2000 counts, and if more than 50% of those come from <1% of pixels, then it is considered to be noise-dominated and hence unusable.
| Quadrant | # 1 sec bins | Bins with >0 counts | Bins with >2000 counts | High rate bins dominated by noise | Noise dominated (total time) | Noise dominated (detector-on time) | Marked lightcurve |
|---|---|---|---|---|---|---|---|
| A | 6117 | 4843 | 811 | 811 | 13.26% | 16.75% | 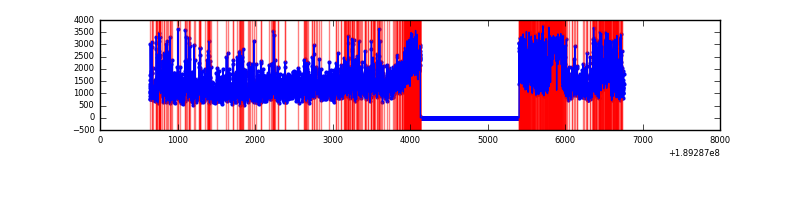 |
| B | 6117 | 4842 | 243 | 243 | 3.97% | 5.02% | 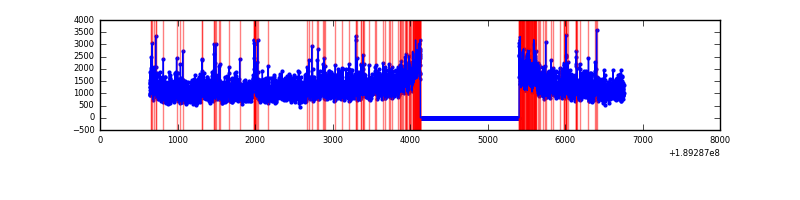 |
| C | 6117 | 4843 | 94 | 94 | 1.54% | 1.94% | 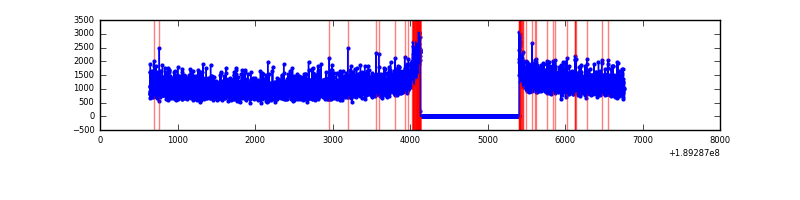 |
| D | 6117 | 4843 | 136 | 136 | 2.22% | 2.81% | 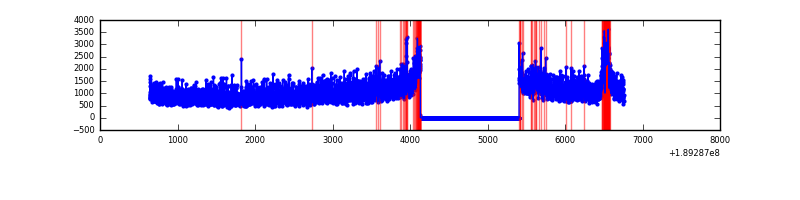 |
Top three noisy pixels from each quadrant. If the there are fewer than three noisy pixels in the level2.evt file, extra rows are filled as -1
| Pixel properties | Quadrant properties | ||||||
|---|---|---|---|---|---|---|---|
| Quadrant | DetID | PixID | Counts | Sigma | Mean | Median | Sigma |
| A | 15 | 127 | 1871290 | 5722.76 | 1368 | 1378 | 326.8 |
| A | 4 | 32 | 80670 | 242.67 | 1368 | 1378 | 326.8 |
| A | 0 | 253 | 15540 | 43.34 | 1368 | 1378 | 326.8 |
| B | 8 | 4 | 204310 | 599.42 | 1456 | 1460 | 338.4 |
| B | 6 | 53 | 125380 | 366.18 | 1456 | 1460 | 338.4 |
| B | 12 | 52 | 102963 | 299.94 | 1456 | 1460 | 338.4 |
| C | 15 | 241 | 171983 | 464.77 | 1330 | 1377 | 367.1 |
| C | 3 | 111 | 14645 | 36.14 | 1330 | 1377 | 367.1 |
| C | 3 | 79 | 10807 | 25.69 | 1330 | 1377 | 367.1 |
| D | 9 | 53 | 215284 | 560.28 | 1270 | 1310 | 381.9 |
| D | 9 | 66 | 44043 | 111.89 | 1270 | 1310 | 381.9 |
| D | 2 | 88 | 38203 | 96.6 | 1270 | 1310 | 381.9 |
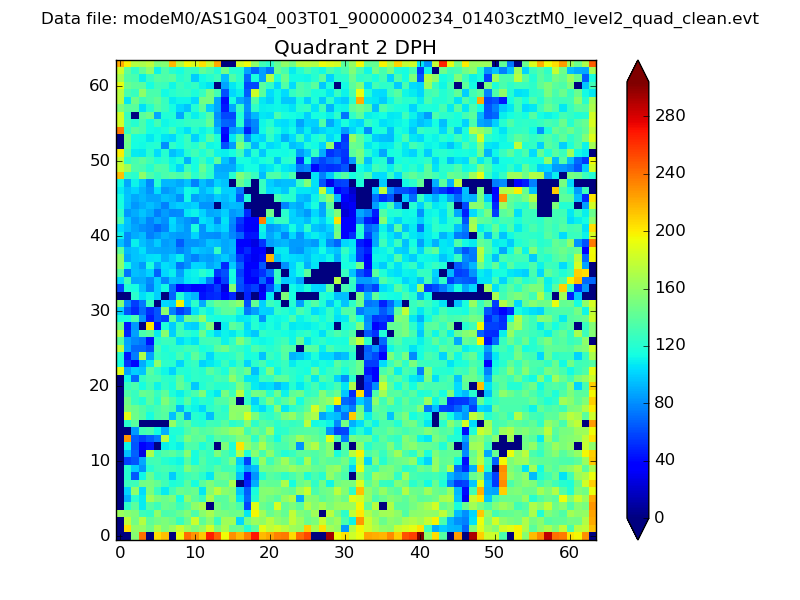
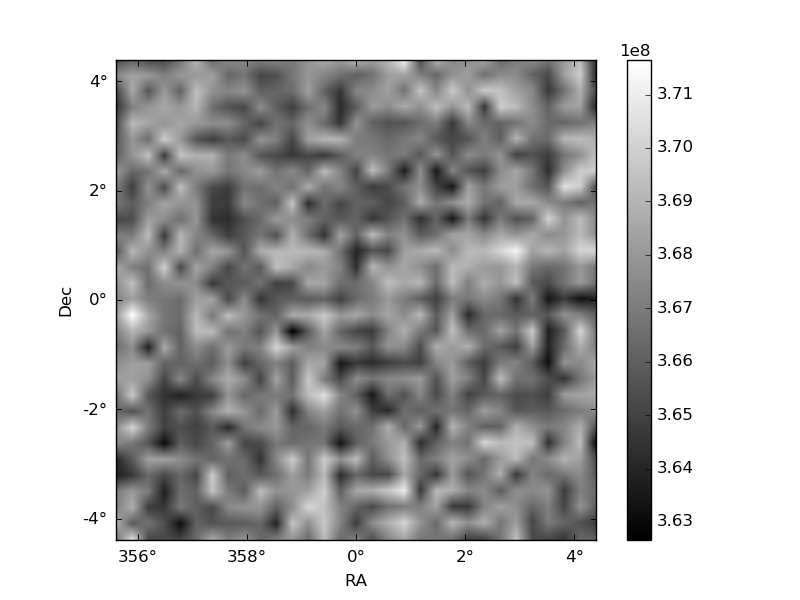
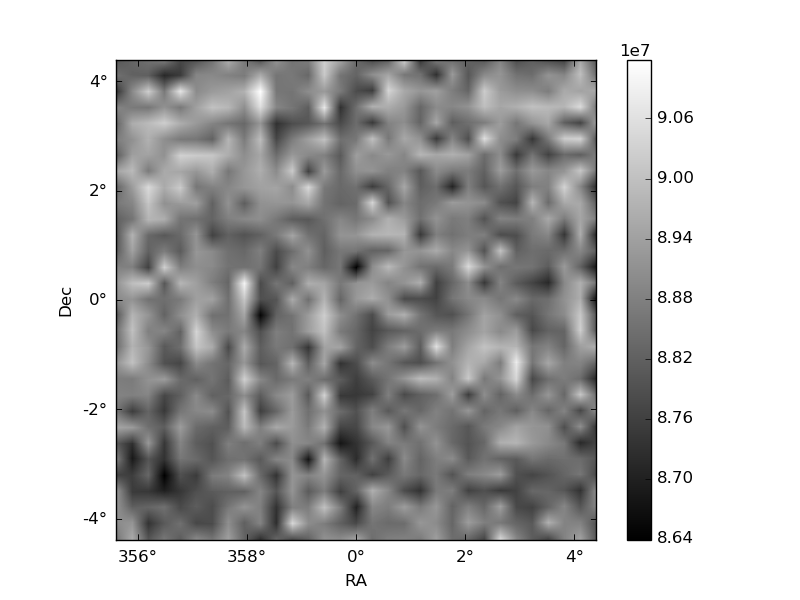
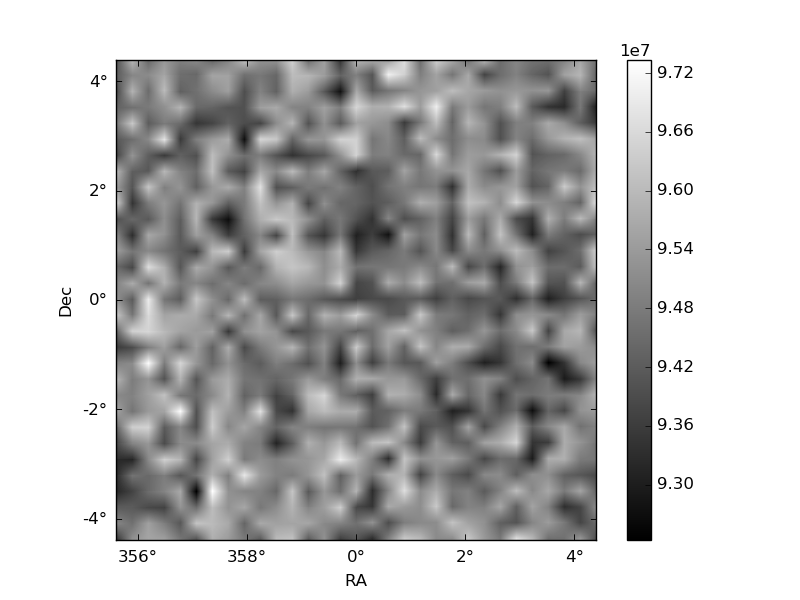
Histogram calculated using DETX and DETY for each event in the final _common_clean file
| Quadrant A | 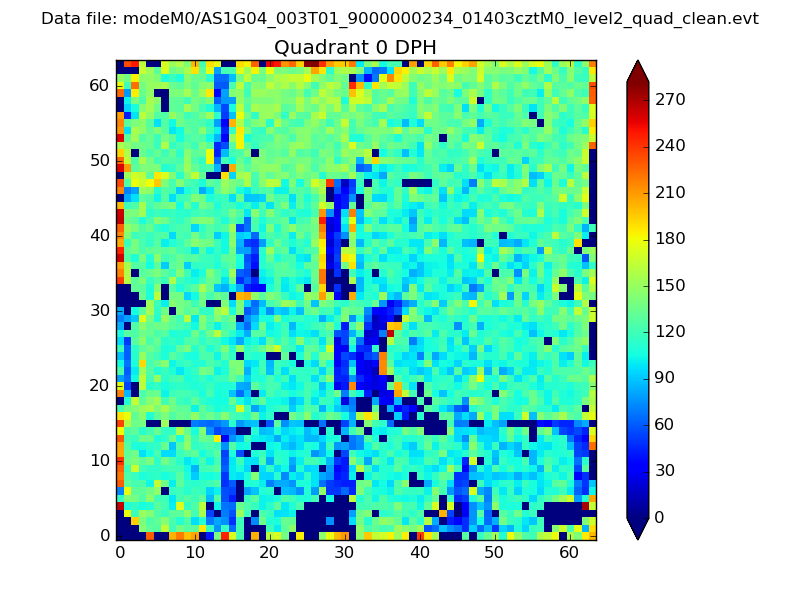 |
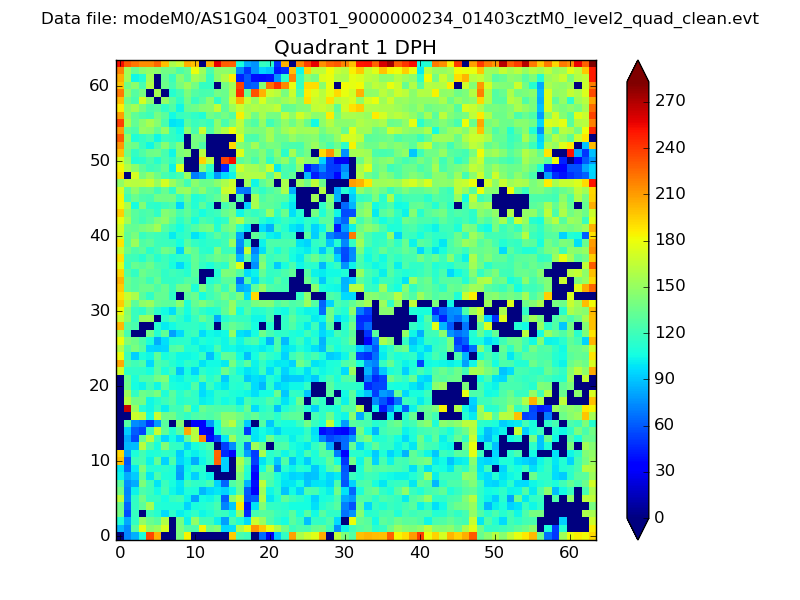 |
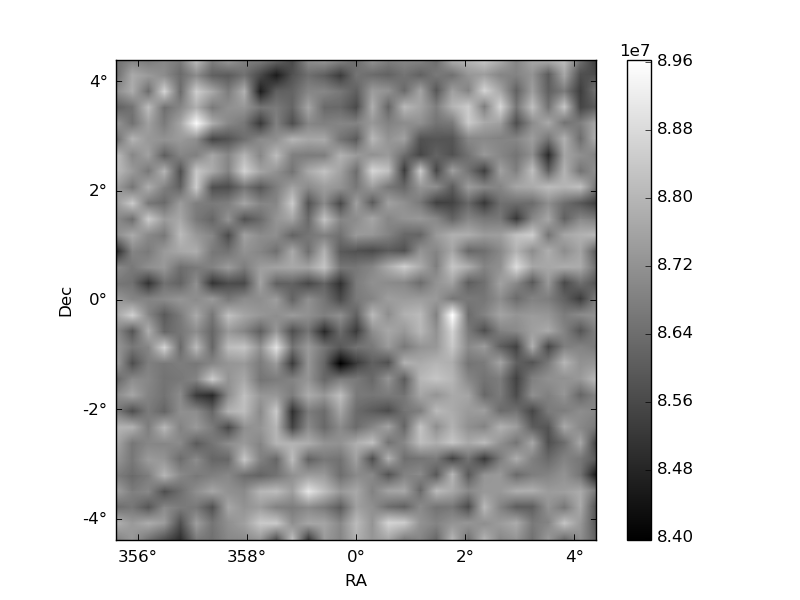
Quadrant B |
|---|---|---|---|
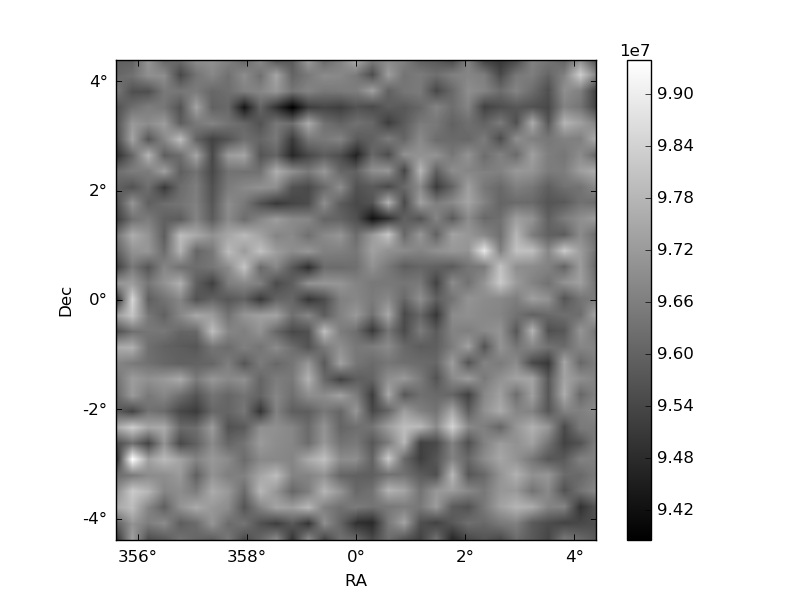
| Quadrant D | 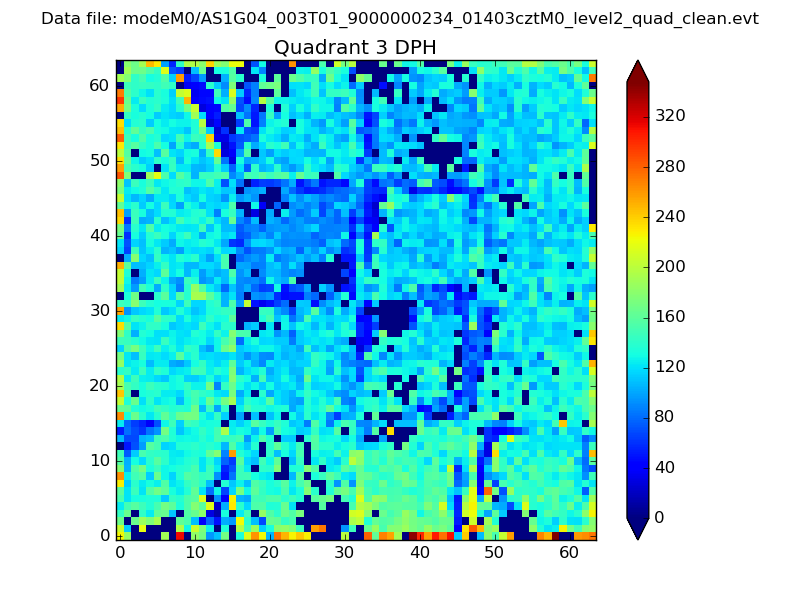 |
 |
Quadrant C |
| Plot type | Count rate plots | Images |
|---|---|---|
| Comparison with Poisson distribution Blue bars denote a histogram of data divided into 1 sec bins. Red curve is a Poisson curve with rate = median count rate of data. |
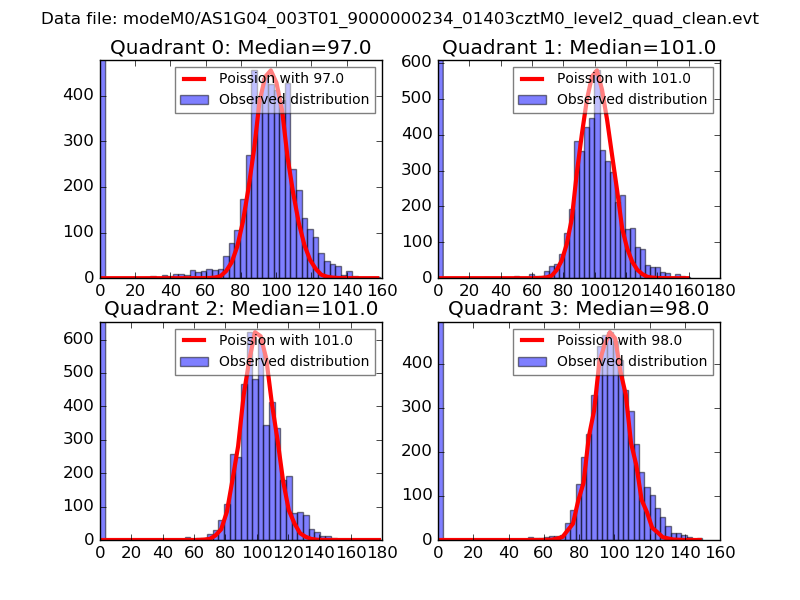 |
 |
| Quadrant-wise count rates Data is divided into 100 sec bins |
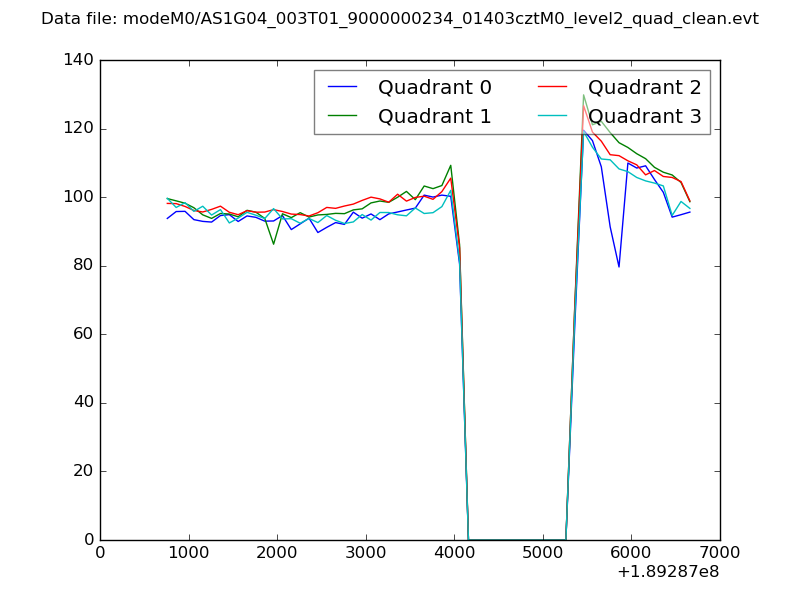 |
|
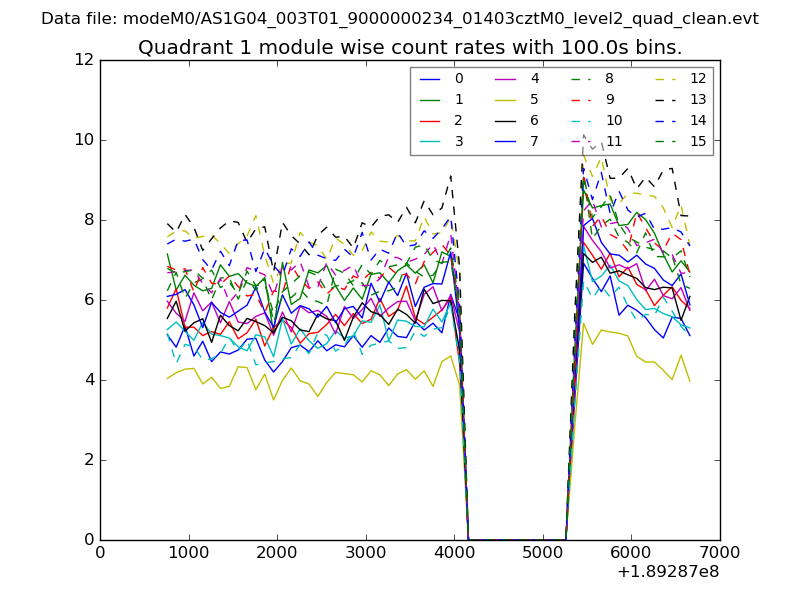
| Module-wise count rates for Quadrant A Data is divided into 100 sec bins |
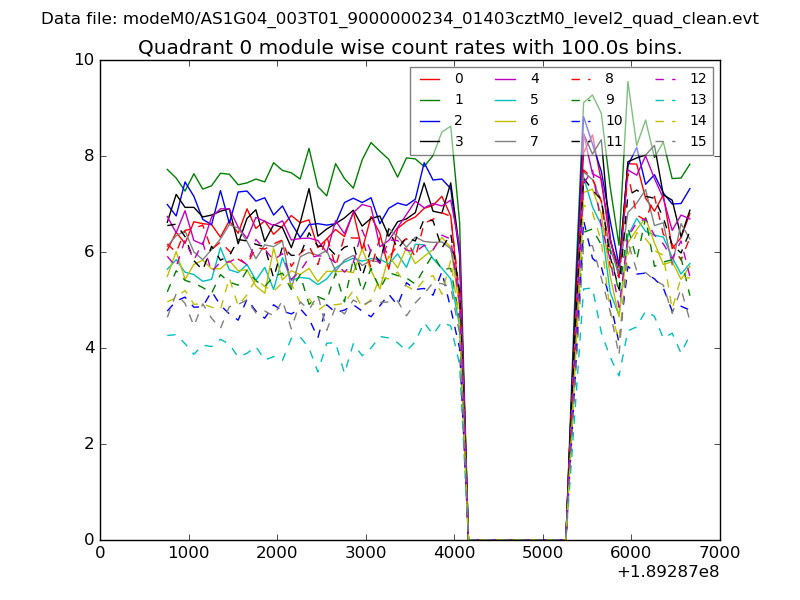 |
 |
| Module-wise count rates for Quadrant B Data is divided into 100 sec bins |
 |
 |
| Module-wise count rates for Quadrant C Data is divided into 100 sec bins |
 |
 |
| Module-wise count rates for Quadrant D Data is divided into 100 sec bins |
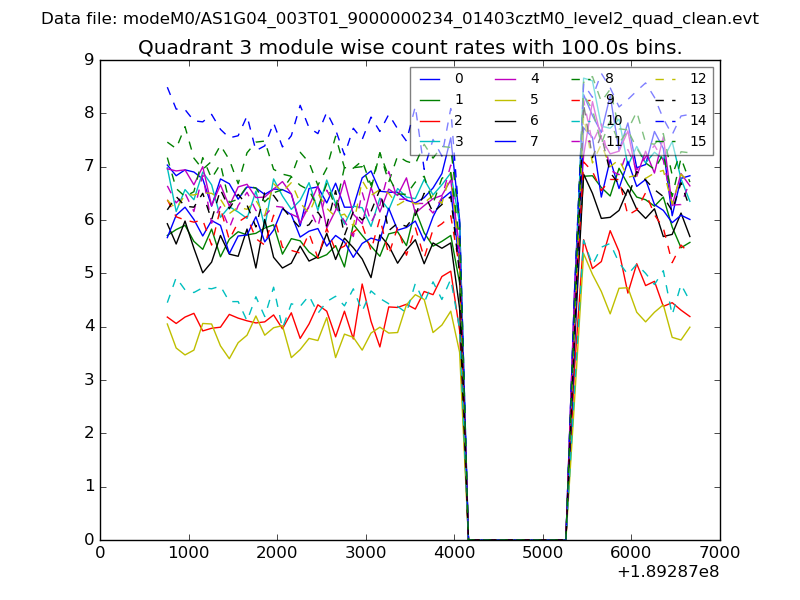 |
 |
| Parameter | Plot |
|---|---|
| CZT HV Monitor | 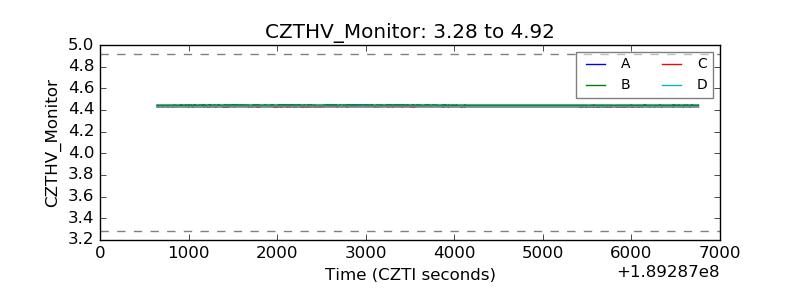 |
| D_VDD | 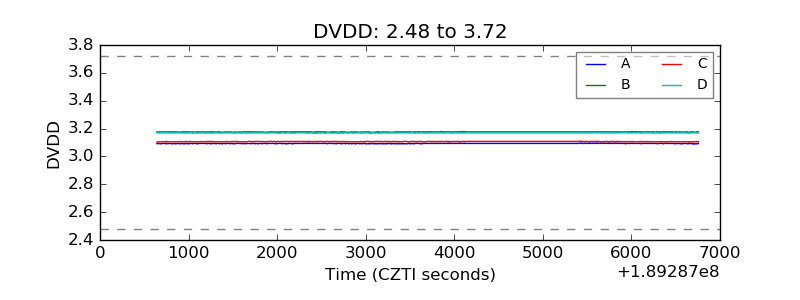 |
| Temperature 1 | 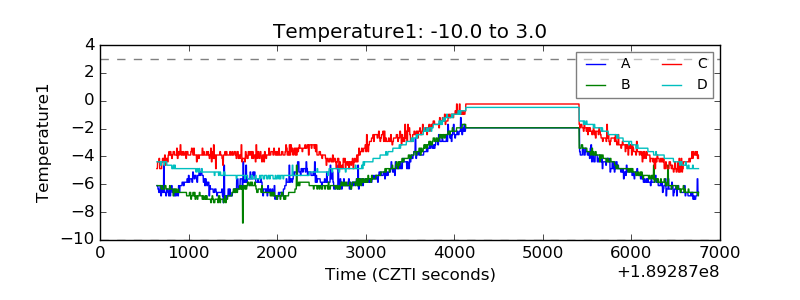 |
| Veto HV Monitor | 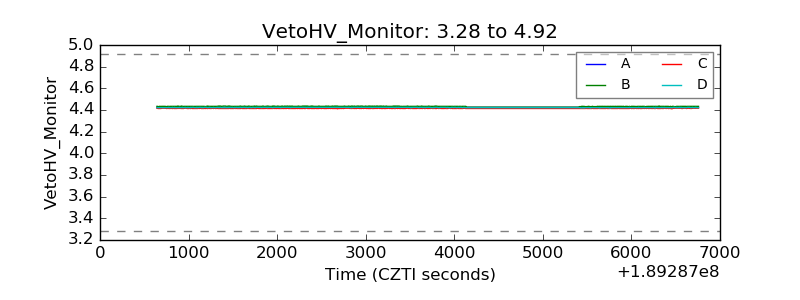 |
| Veto LLD | 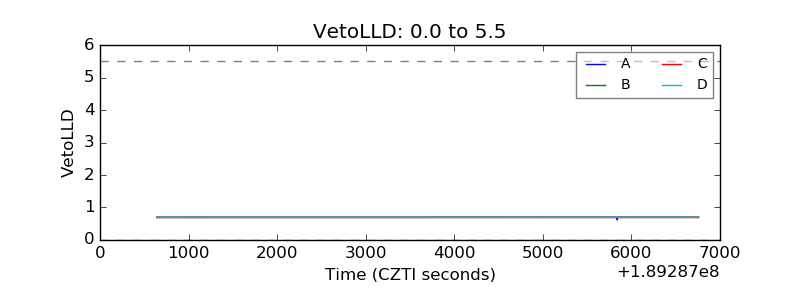 |
| Alpha Counter | 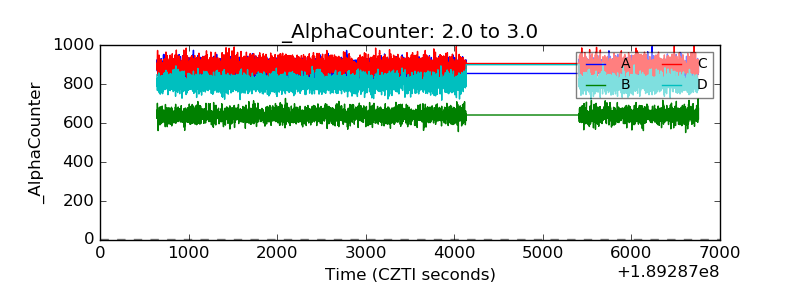 |
| _CPM_Rate | 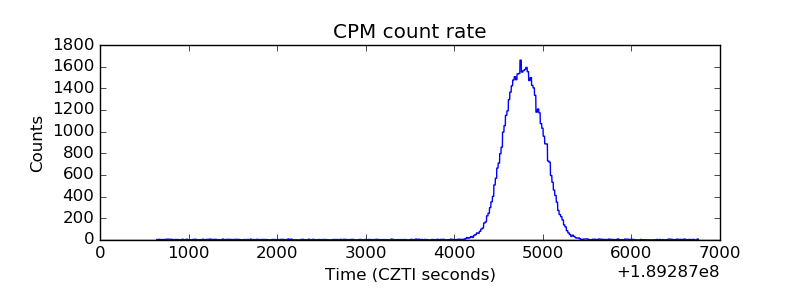 |
| CZT Counter | 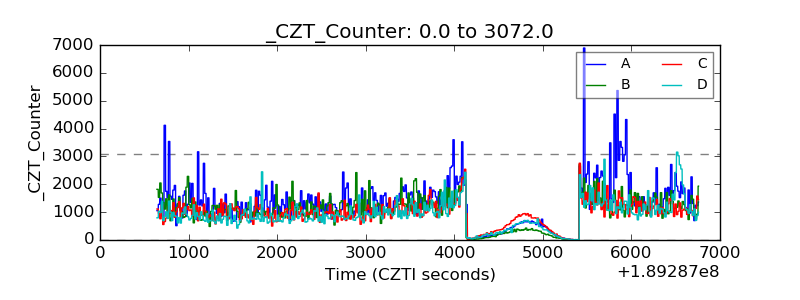 |
| +2.5 Volts monitor |  |
| +5 Volts monitor |  |
| _ROLL_ROT | 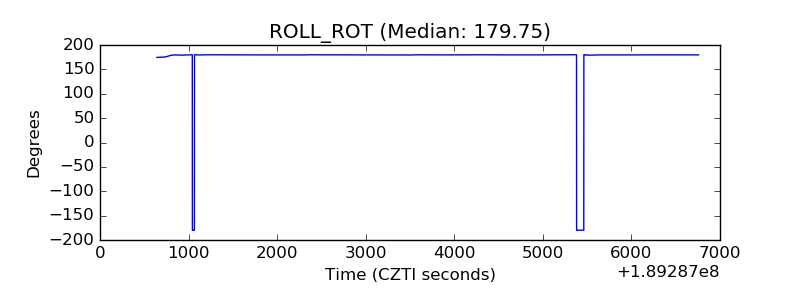 |
| _Roll_DEC | 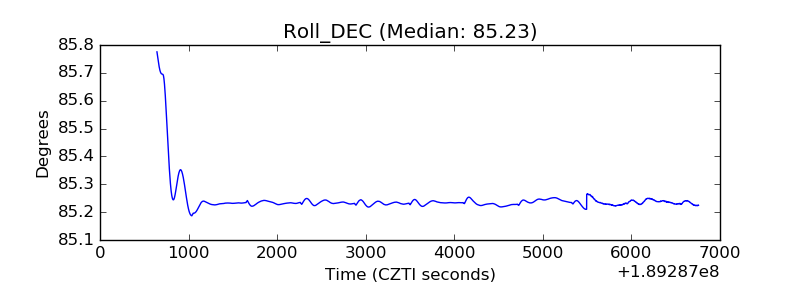 |
| _Roll_RA | 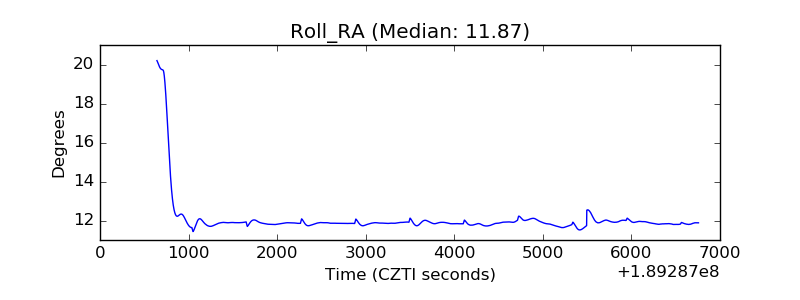 |
| Veto Counter |  |