| Param | Original file | Final file |
|---|---|---|
| Filename | modeM0/AS1G04_003T01_9000000234_01404cztM0_level2.evt | modeM0/AS1G04_003T01_9000000234_01404cztM0_level2_quad_clean.evt |
| Size (bytes) | 1,048,507,200 | 95,880,960 |
| Size | 999.9 MB | 91.4 MB |
| Events in quadrant A | 9,660,843 | 601,771 |
| Events in quadrant B | 7,558,286 | 637,098 |
| Events in quadrant C | 6,944,104 | 630,209 |
| Events in quadrant D | 7,183,429 | 604,877 |
| Mode M9 | |||
|---|---|---|---|
| Quadrant | BADHDUFLAG | Total packets | Discarded packets |
| A | 0 | 12 | 0 |
| B | 0 | 12 | 0 |
| C | 0 | 12 | 0 |
| D | 0 | 12 | 0 |
| Mode SS | |||
|---|---|---|---|
| Quadrant | BADHDUFLAG | Total packets | Discarded packets |
| A | 0 | 128 | 0 |
| B | 0 | 128 | 0 |
| C | 0 | 128 | 0 |
| D | 0 | 128 | 0 |
| Mode M0 | |||
|---|---|---|---|
| Quadrant | BADHDUFLAG | Total packets | Discarded packets |
| A | 0 | 33047 | 2 |
| B | 0 | 26831 | 1 |
| C | 0 | 25050 | 1 |
| D | 0 | 25725 | 1 |
| Quadrant | Total seconds | Saturated seconds | Saturation percentage |
|---|---|---|---|
| A | 6142 | 338 | 5.503093% |
| B | 6142 | 28 | 0.455878% |
| C | 6142 | 1 | 0.016281% |
| D | 6142 | 46 | 0.748942% |
Noise dominated data is calculated using 1-second bins in cleaned event files. If a bin has >2000 counts, and if more than 50% of those come from <1% of pixels, then it is considered to be noise-dominated and hence unusable.
| Quadrant | # 1 sec bins | Bins with >0 counts | Bins with >2000 counts | High rate bins dominated by noise | Noise dominated (total time) | Noise dominated (detector-on time) | Marked lightcurve |
|---|---|---|---|---|---|---|---|
| A | 7417 | 6143 | 1231 | 1231 | 16.60% | 20.04% |  |
| B | 7417 | 6143 | 249 | 249 | 3.36% | 4.05% |  |
| C | 7417 | 6143 | 92 | 92 | 1.24% | 1.50% | 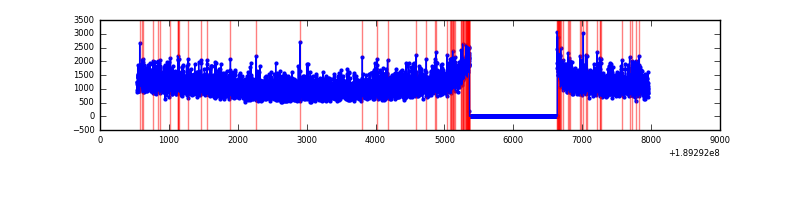 |
| D | 7417 | 6143 | 355 | 355 | 4.79% | 5.78% |  |
Top three noisy pixels from each quadrant. If the there are fewer than three noisy pixels in the level2.evt file, extra rows are filled as -1
| Pixel properties | Quadrant properties | ||||||
|---|---|---|---|---|---|---|---|
| Quadrant | DetID | PixID | Counts | Sigma | Mean | Median | Sigma |
| A | 15 | 127 | 2923044 | 6963.49 | 1742 | 1753 | 419.5 |
| A | 4 | 32 | 24505 | 54.23 | 1742 | 1753 | 419.5 |
| A | 3 | 80 | 10719 | 21.37 | 1742 | 1753 | 419.5 |
| B | 6 | 53 | 150700 | 343.12 | 1871 | 1879 | 433.7 |
| B | 8 | 4 | 106183 | 240.48 | 1871 | 1879 | 433.7 |
| B | 5 | 191 | 68341 | 153.23 | 1871 | 1879 | 433.7 |
| C | 15 | 241 | 216289 | 456.79 | 1707 | 1770 | 469.6 |
| C | 12 | 4 | 21296 | 41.58 | 1707 | 1770 | 469.6 |
| C | 3 | 111 | 17781 | 34.09 | 1707 | 1770 | 469.6 |
| D | 9 | 53 | 928494 | 1856.26 | 1623 | 1677 | 499.3 |
| D | 9 | 66 | 86921 | 170.73 | 1623 | 1677 | 499.3 |
| D | 1 | 20 | 39266 | 75.28 | 1623 | 1677 | 499.3 |
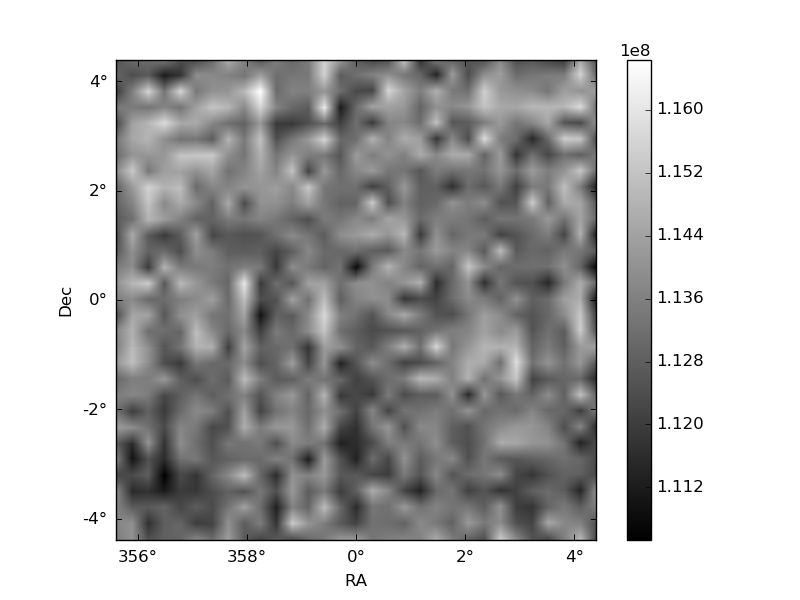
Histogram calculated using DETX and DETY for each event in the final _common_clean file
| Quadrant A | 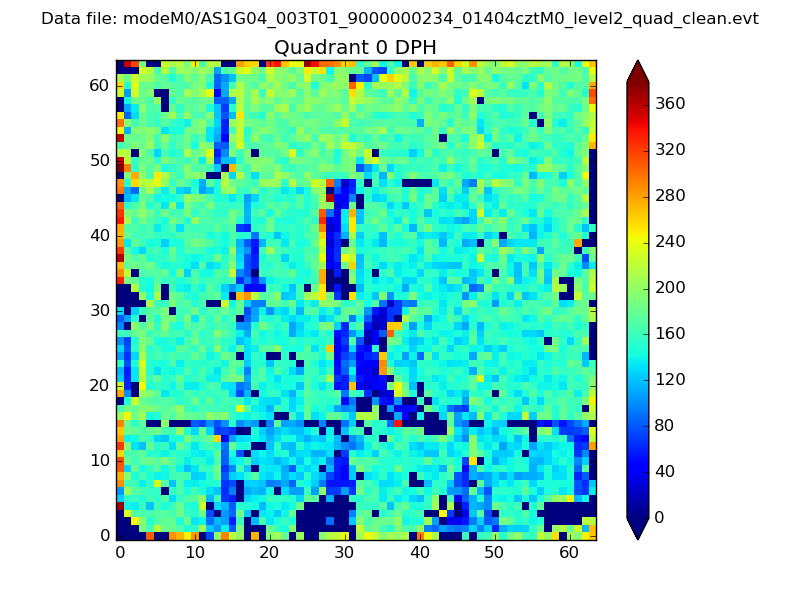 |
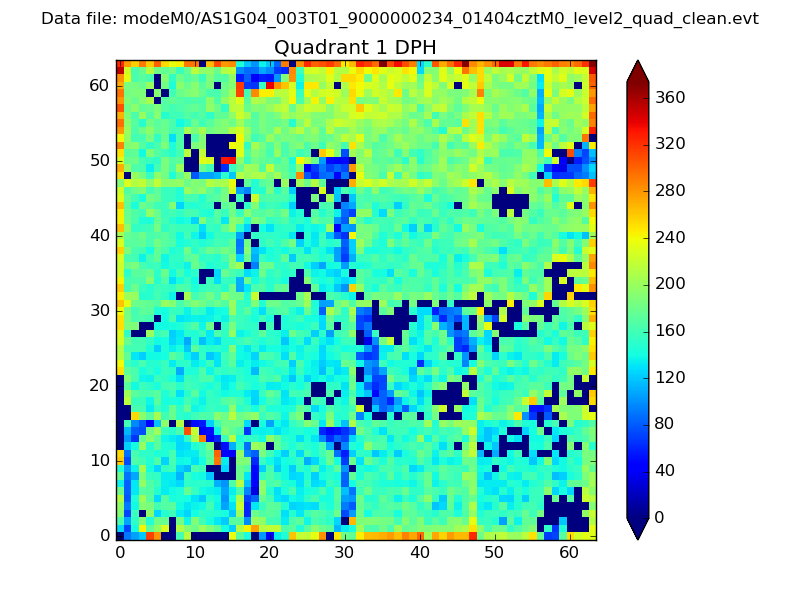 |
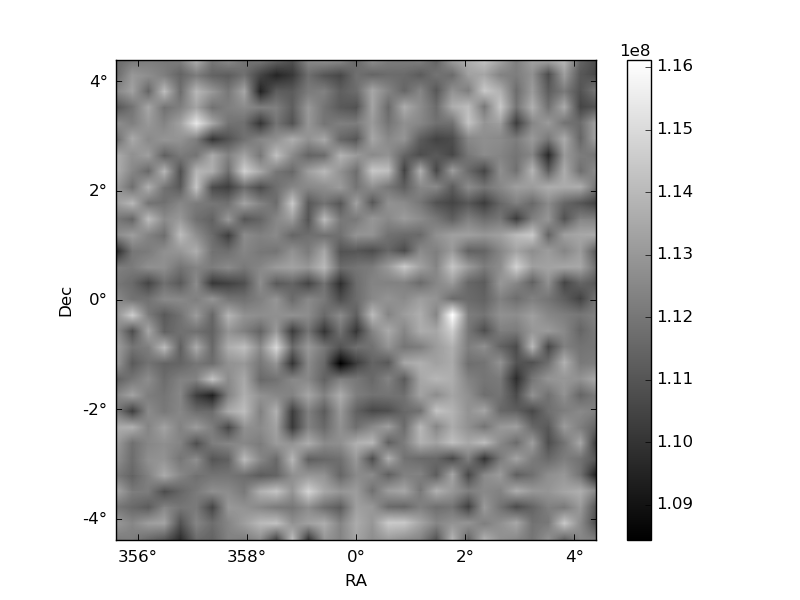
Quadrant B |
|---|---|---|---|
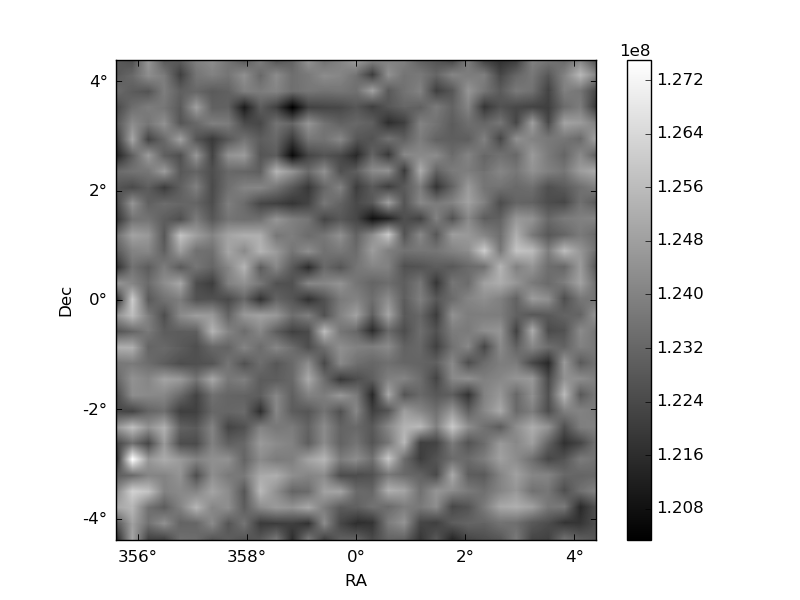
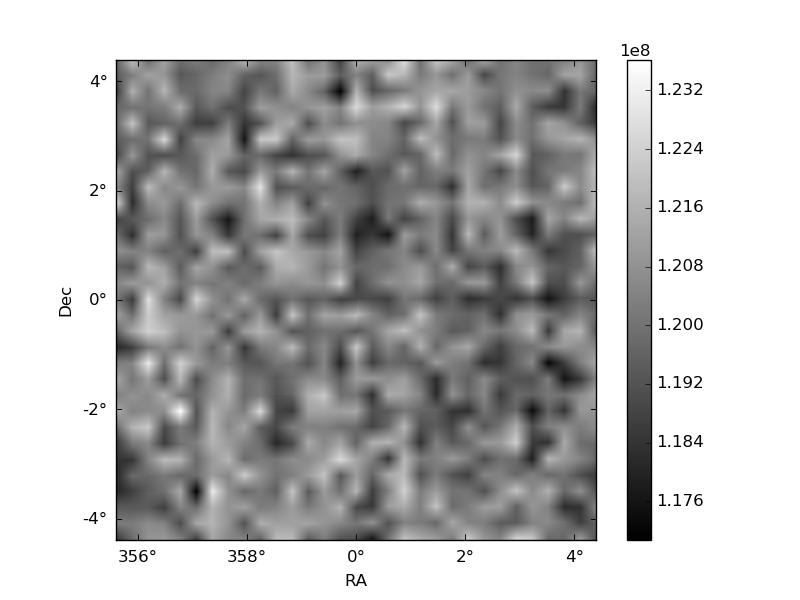
| Quadrant D | 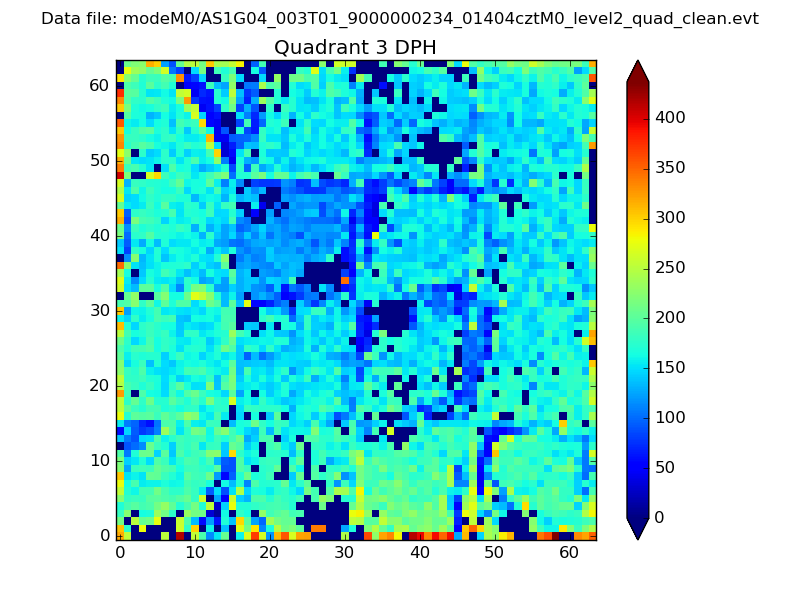 |
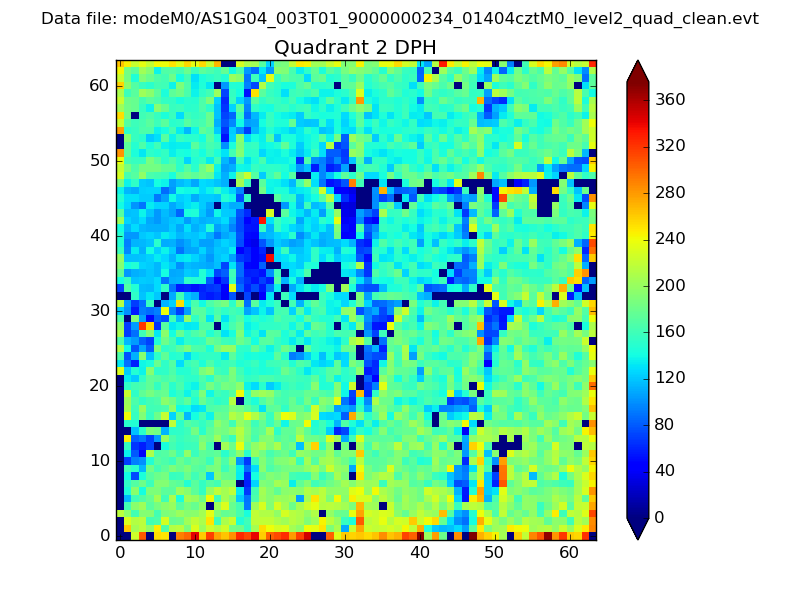 |
Quadrant C |
| Plot type | Count rate plots | Images |
|---|---|---|
| Comparison with Poisson distribution Blue bars denote a histogram of data divided into 1 sec bins. Red curve is a Poisson curve with rate = median count rate of data. |
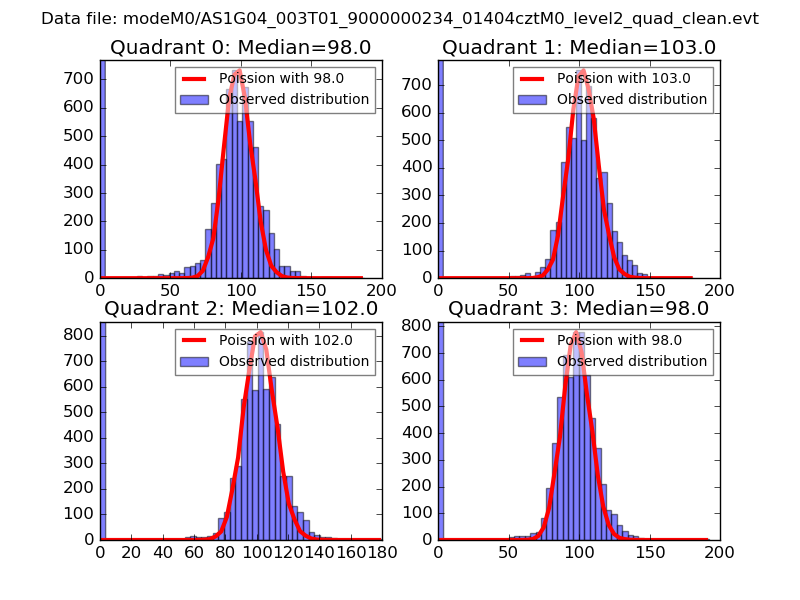 |
 |
| Quadrant-wise count rates Data is divided into 100 sec bins |
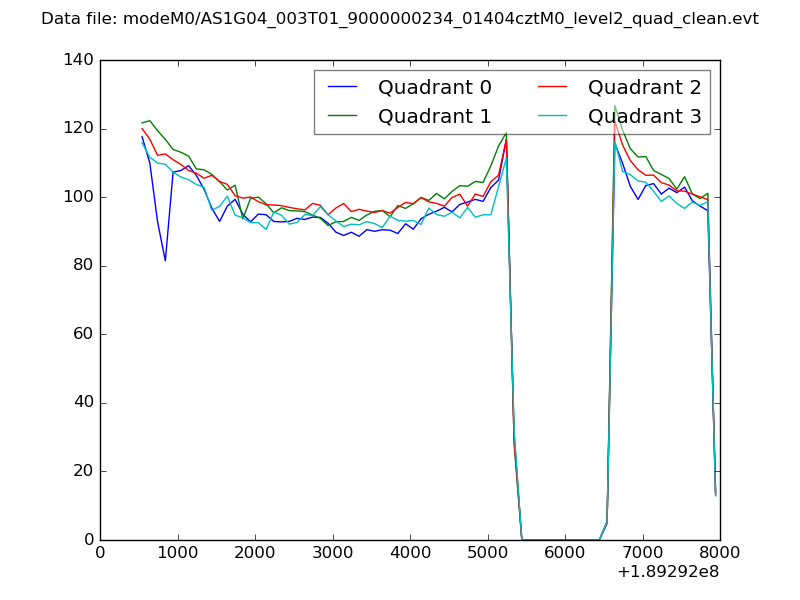 |
|
| Module-wise count rates for Quadrant A Data is divided into 100 sec bins |
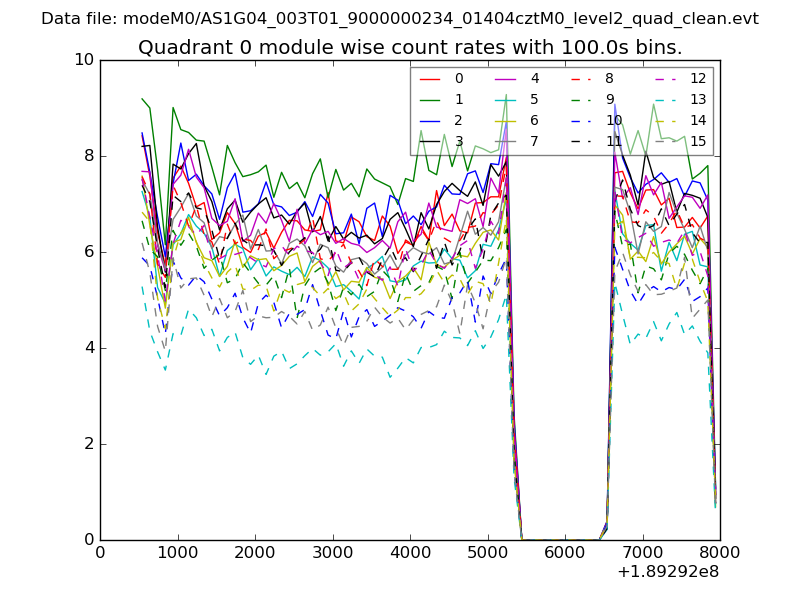 |
 |
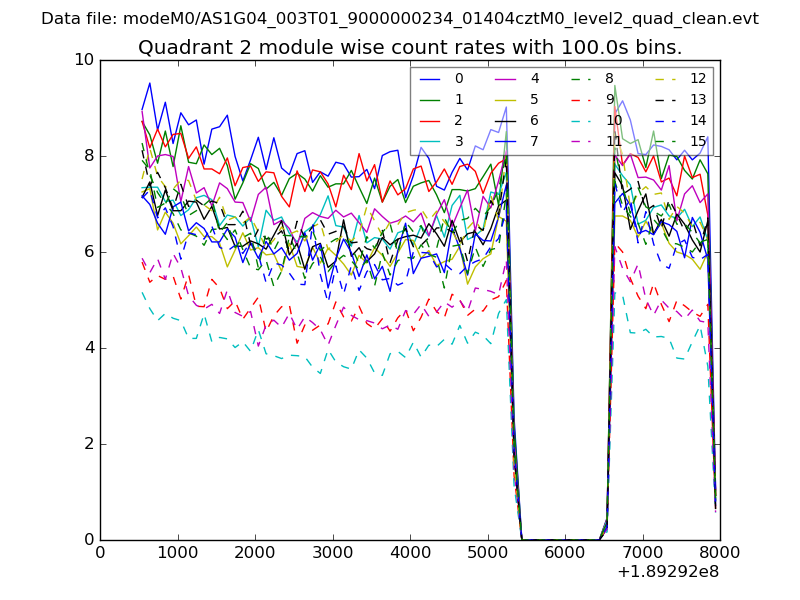
| Module-wise count rates for Quadrant B Data is divided into 100 sec bins |
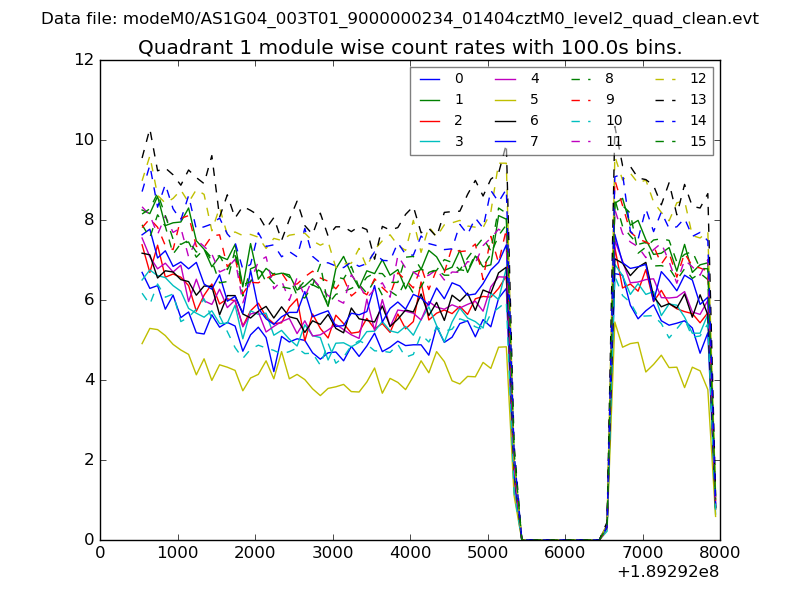 |
 |
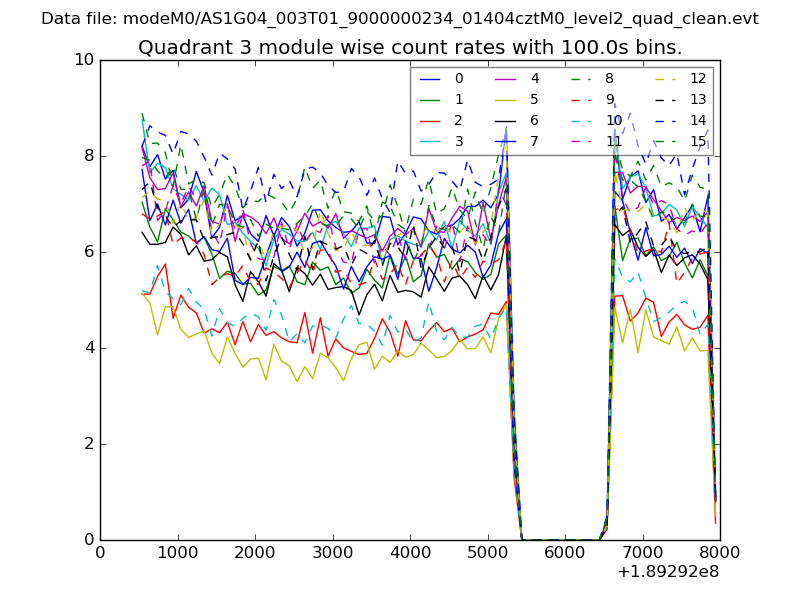
| Module-wise count rates for Quadrant C Data is divided into 100 sec bins |
 |
 |
| Module-wise count rates for Quadrant D Data is divided into 100 sec bins |
 |
 |
| Parameter | Plot |
|---|---|
| CZT HV Monitor | 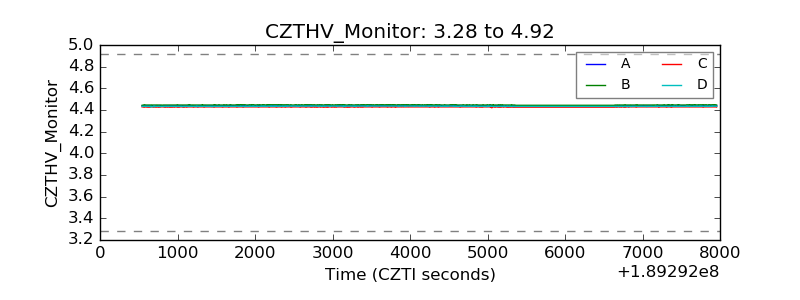 |
| D_VDD | 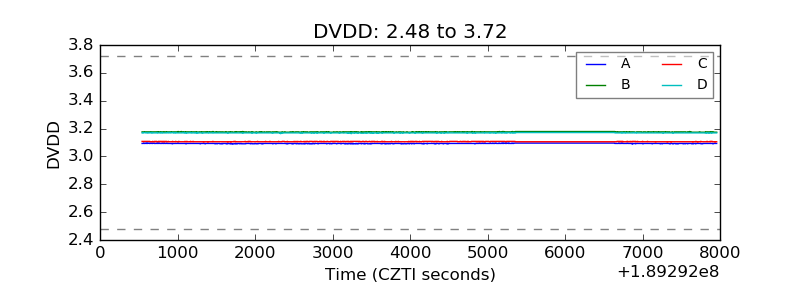 |
| Temperature 1 | 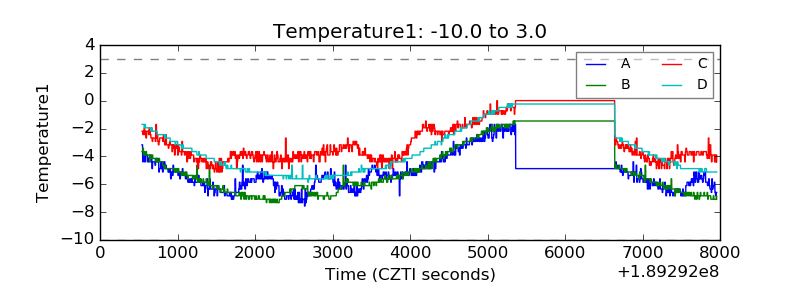 |
| Veto HV Monitor | 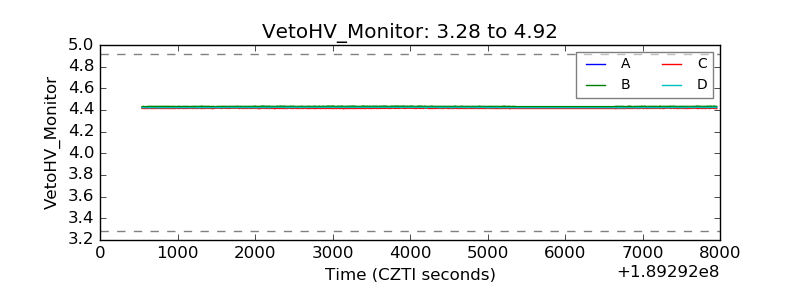 |
| Veto LLD | 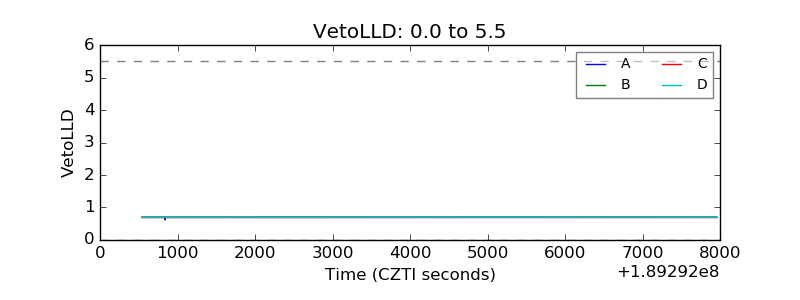 |
| Alpha Counter | 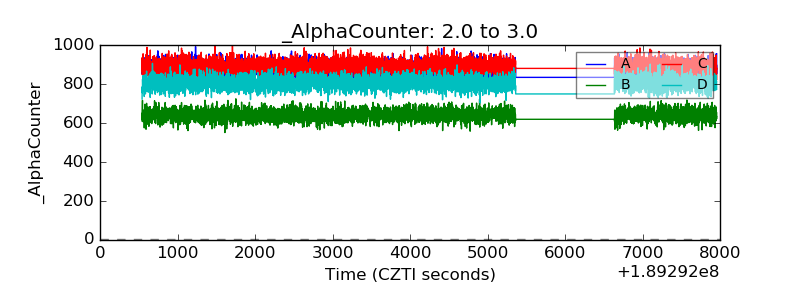 |
| _CPM_Rate | 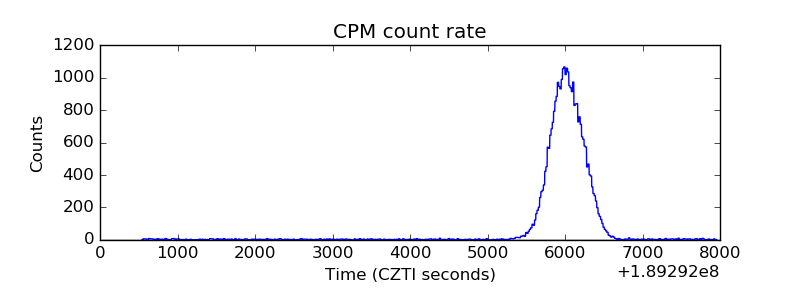 |
| CZT Counter | 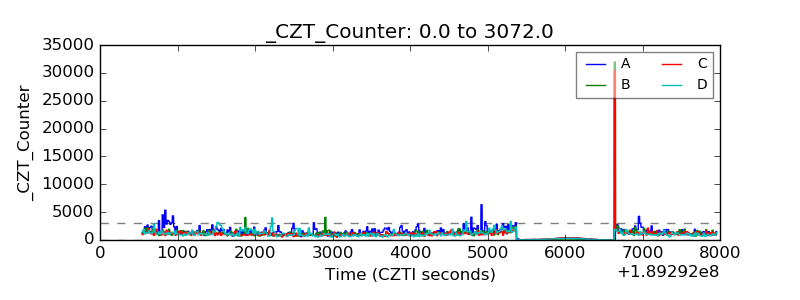 |
| +2.5 Volts monitor |  |
| +5 Volts monitor |  |
| _ROLL_ROT | 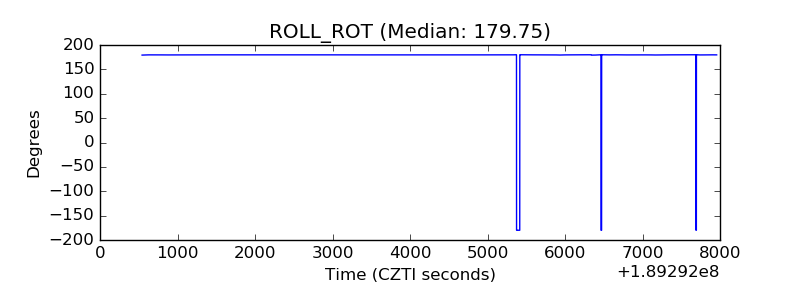 |
| _Roll_DEC | 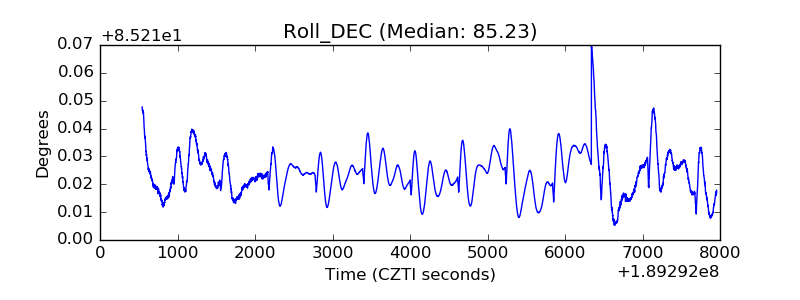 |
| _Roll_RA | 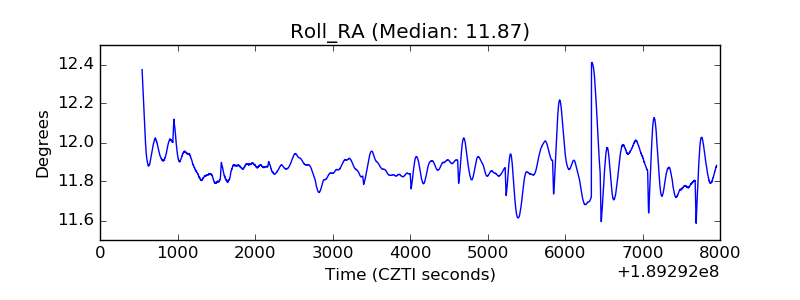 |
| Veto Counter | 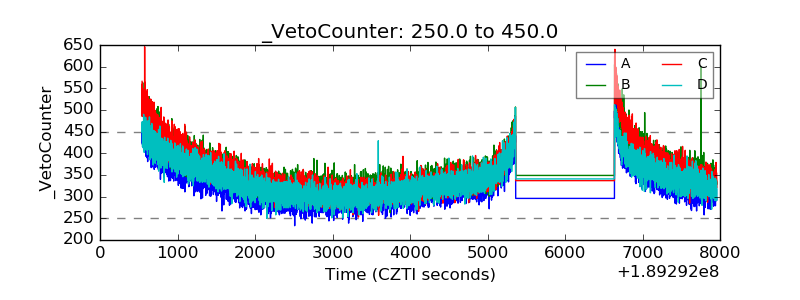 |