| Param | Original file | Final file |
|---|---|---|
| Filename | modeM0/AS1G04_003T01_9000000234_01405cztM0_level2.evt | modeM0/AS1G04_003T01_9000000234_01405cztM0_level2_quad_clean.evt |
| Size (bytes) | 1,053,325,440 | 99,371,520 |
| Size | 1004.5 MB | 94.8 MB |
| Events in quadrant A | 8,786,267 | 638,913 |
| Events in quadrant B | 8,174,894 | 654,940 |
| Events in quadrant C | 7,328,782 | 645,625 |
| Events in quadrant D | 7,184,820 | 622,370 |
| Mode M9 | |||
|---|---|---|---|
| Quadrant | BADHDUFLAG | Total packets | Discarded packets |
| A | 0 | 12 | 0 |
| B | 0 | 12 | 0 |
| C | 0 | 12 | 0 |
| D | 0 | 12 | 0 |
| Mode SS | |||
|---|---|---|---|
| Quadrant | BADHDUFLAG | Total packets | Discarded packets |
| A | 0 | 128 | 0 |
| B | 0 | 128 | 0 |
| C | 0 | 128 | 0 |
| D | 0 | 128 | 0 |
| Mode M0 | |||
|---|---|---|---|
| Quadrant | BADHDUFLAG | Total packets | Discarded packets |
| A | 0 | 30685 | 2 |
| B | 0 | 28855 | 1 |
| C | 0 | 26346 | 1 |
| D | 0 | 25935 | 1 |
| Quadrant | Total seconds | Saturated seconds | Saturation percentage |
|---|---|---|---|
| A | 6423 | 175 | 2.724584% |
| B | 6423 | 56 | 0.871867% |
| C | 6423 | 4 | 0.062276% |
| D | 6423 | 113 | 1.759303% |
Noise dominated data is calculated using 1-second bins in cleaned event files. If a bin has >2000 counts, and if more than 50% of those come from <1% of pixels, then it is considered to be noise-dominated and hence unusable.
| Quadrant | # 1 sec bins | Bins with >0 counts | Bins with >2000 counts | High rate bins dominated by noise | Noise dominated (total time) | Noise dominated (detector-on time) | Marked lightcurve |
|---|---|---|---|---|---|---|---|
| A | 7543 | 6424 | 757 | 757 | 10.04% | 11.78% | 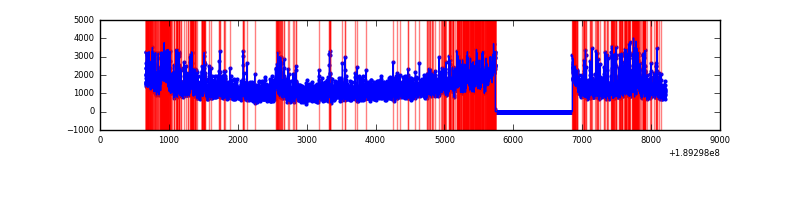 |
| B | 7543 | 6424 | 364 | 364 | 4.83% | 5.67% | 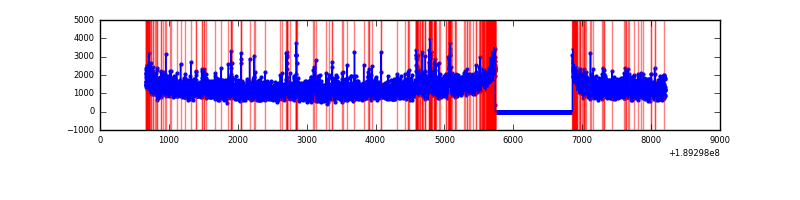 |
| C | 7543 | 6424 | 160 | 160 | 2.12% | 2.49% | 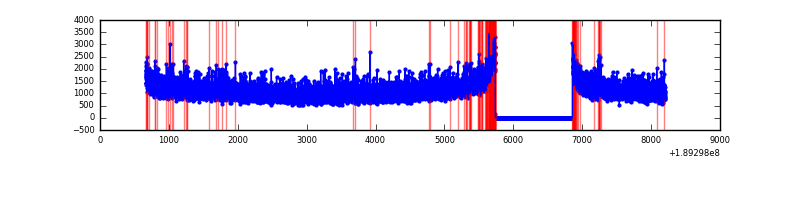 |
| D | 7543 | 6424 | 355 | 355 | 4.71% | 5.53% | 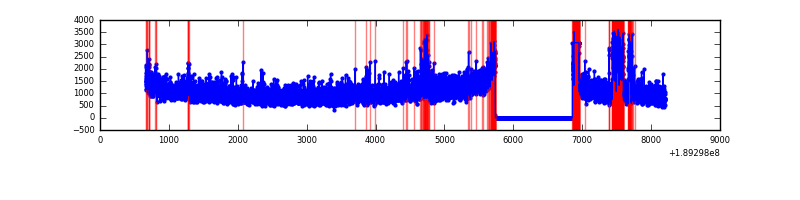 |
Top three noisy pixels from each quadrant. If the there are fewer than three noisy pixels in the level2.evt file, extra rows are filled as -1
| Pixel properties | Quadrant properties | ||||||
|---|---|---|---|---|---|---|---|
| Quadrant | DetID | PixID | Counts | Sigma | Mean | Median | Sigma |
| A | 15 | 127 | 1153215 | 2573.04 | 1861 | 1875 | 447.5 |
| A | 4 | 32 | 468446 | 1042.71 | 1861 | 1875 | 447.5 |
| A | 15 | 79 | 18461 | 37.07 | 1861 | 1875 | 447.5 |
| B | 8 | 4 | 170800 | 365.69 | 1984 | 1994 | 461.6 |
| B | 6 | 53 | 145656 | 311.22 | 1984 | 1994 | 461.6 |
| B | 12 | 52 | 145298 | 310.44 | 1984 | 1994 | 461.6 |
| C | 15 | 241 | 235803 | 469.81 | 1801 | 1866 | 497.9 |
| C | 3 | 111 | 19134 | 34.68 | 1801 | 1866 | 497.9 |
| C | 12 | 4 | 18799 | 34.01 | 1801 | 1866 | 497.9 |
| D | 9 | 66 | 424190 | 833.23 | 1714 | 1758 | 507.0 |
| D | 15 | 217 | 168944 | 329.77 | 1714 | 1758 | 507.0 |
| D | 9 | 53 | 72154 | 138.85 | 1714 | 1758 | 507.0 |
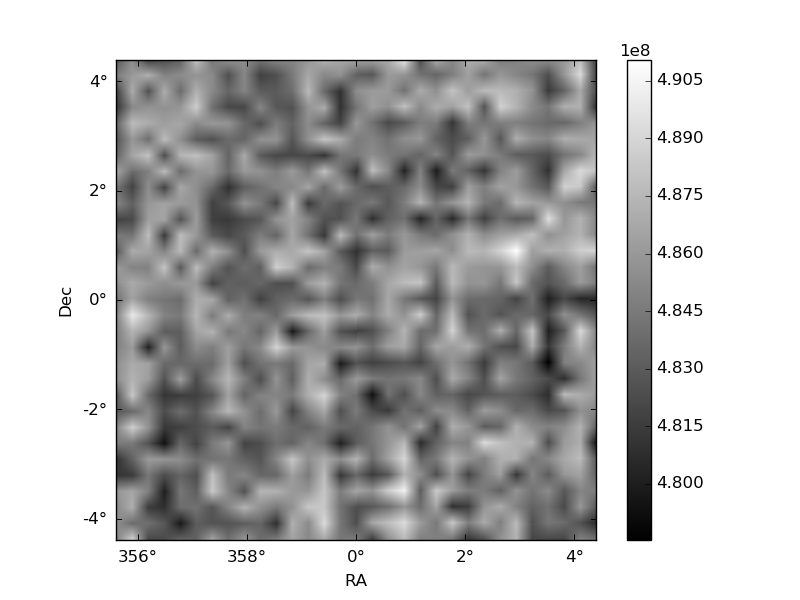
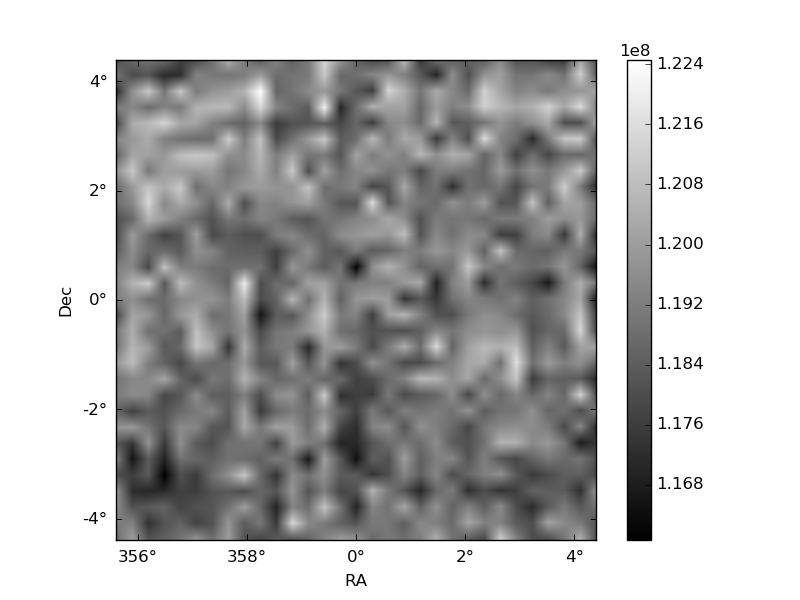
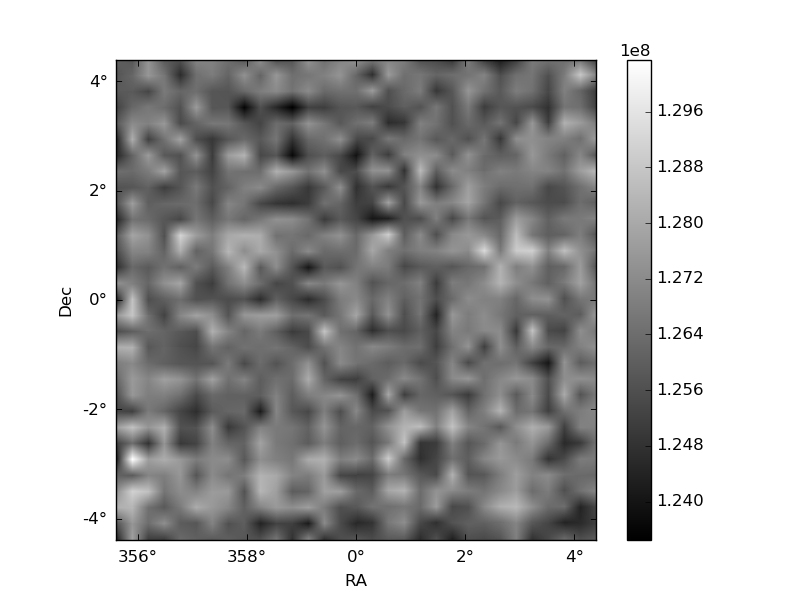
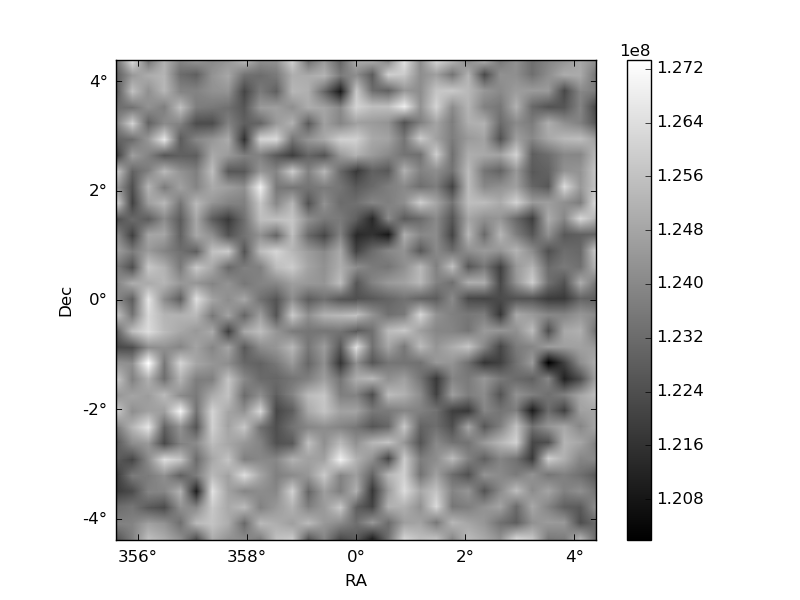
Histogram calculated using DETX and DETY for each event in the final _common_clean file
| Quadrant A | 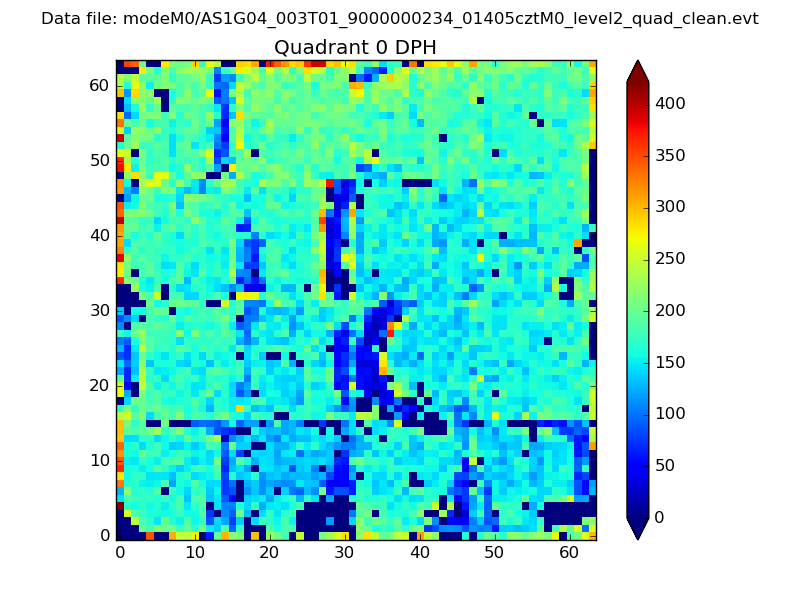 |
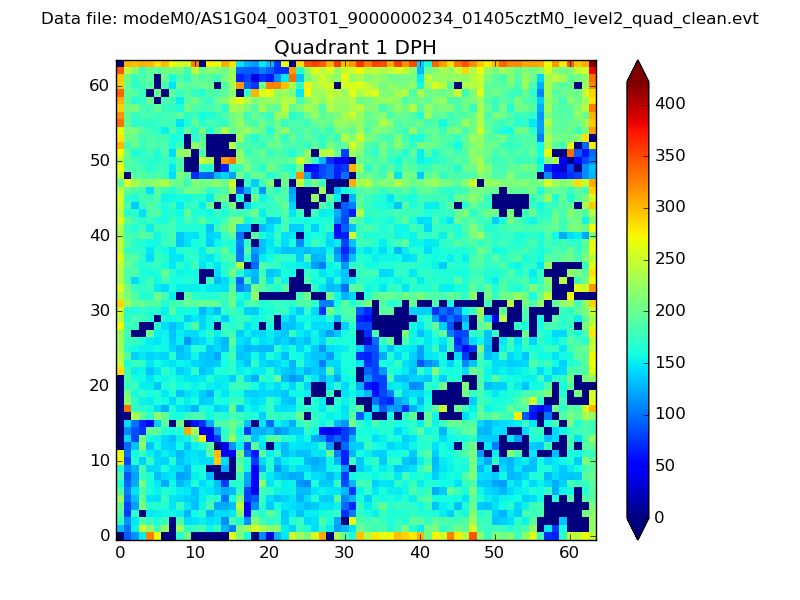 |
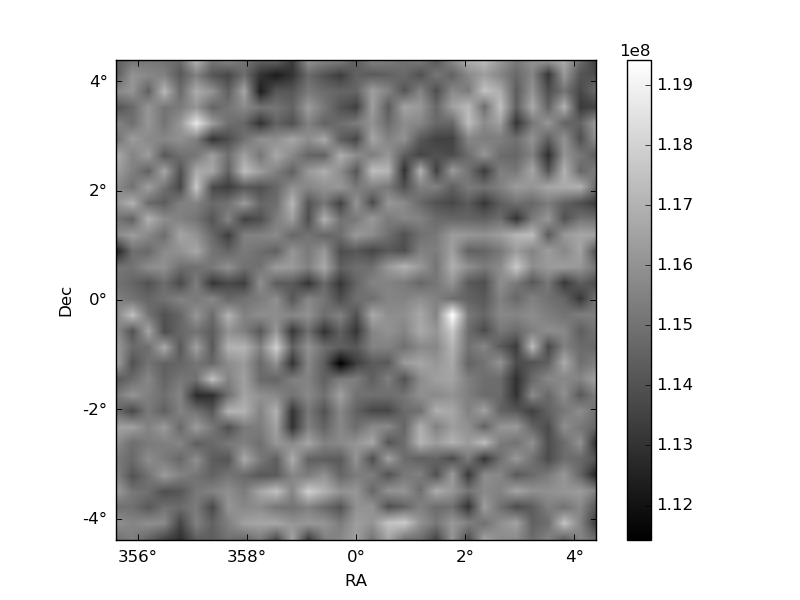
Quadrant B |
|---|---|---|---|
| Quadrant D | 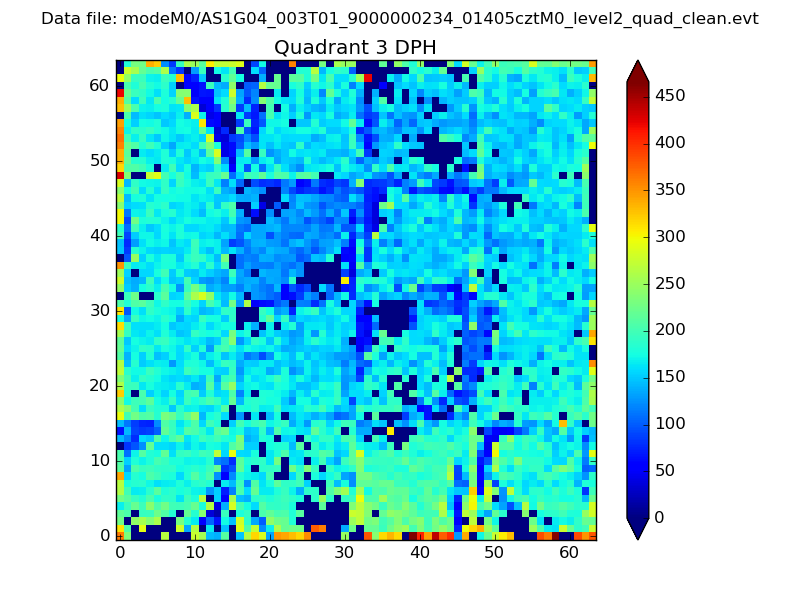 |
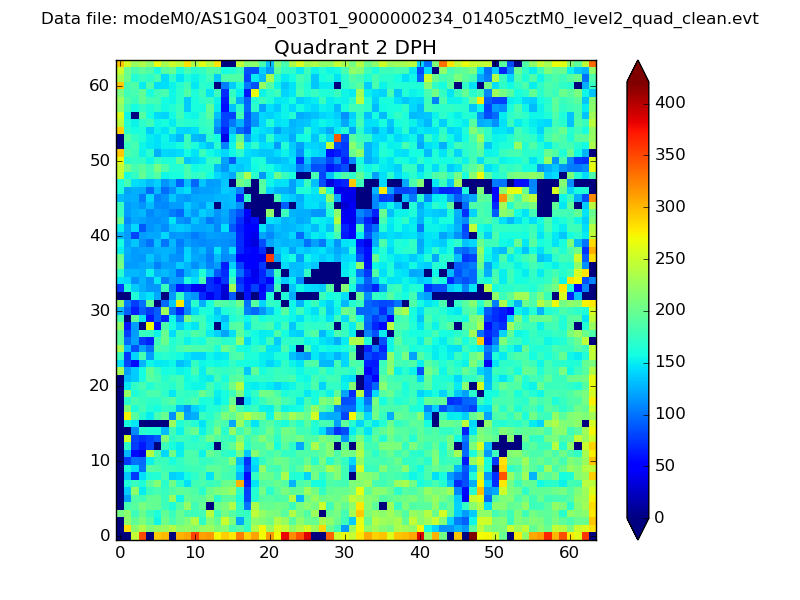 |
Quadrant C |
| Plot type | Count rate plots | Images |
|---|---|---|
| Comparison with Poisson distribution Blue bars denote a histogram of data divided into 1 sec bins. Red curve is a Poisson curve with rate = median count rate of data. |
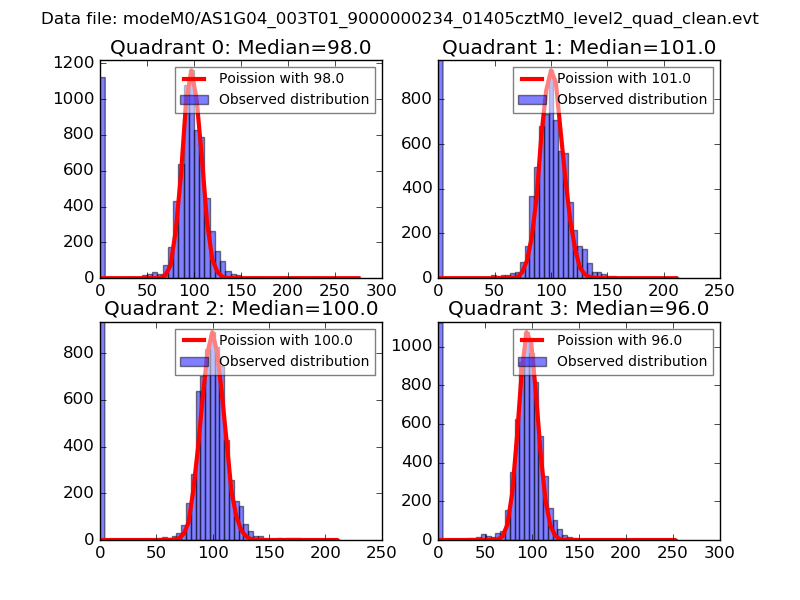 |
 |
| Quadrant-wise count rates Data is divided into 100 sec bins |
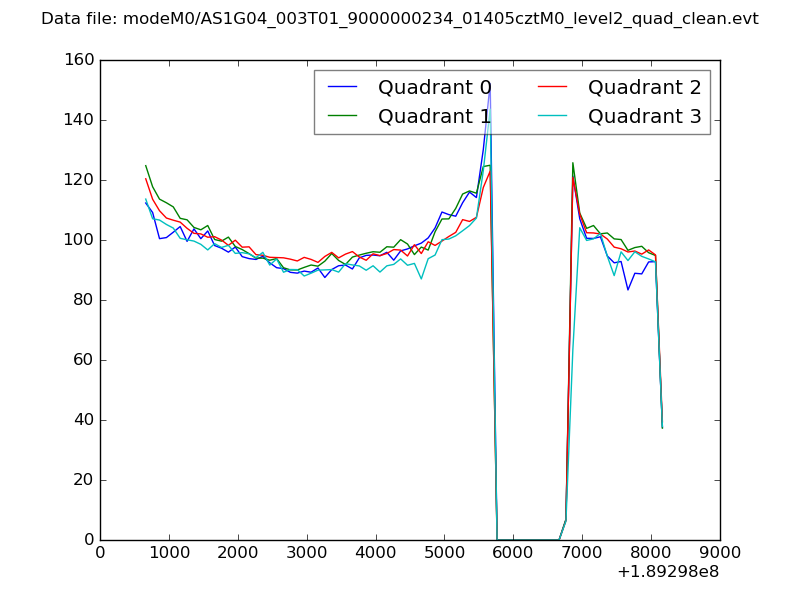 |
|
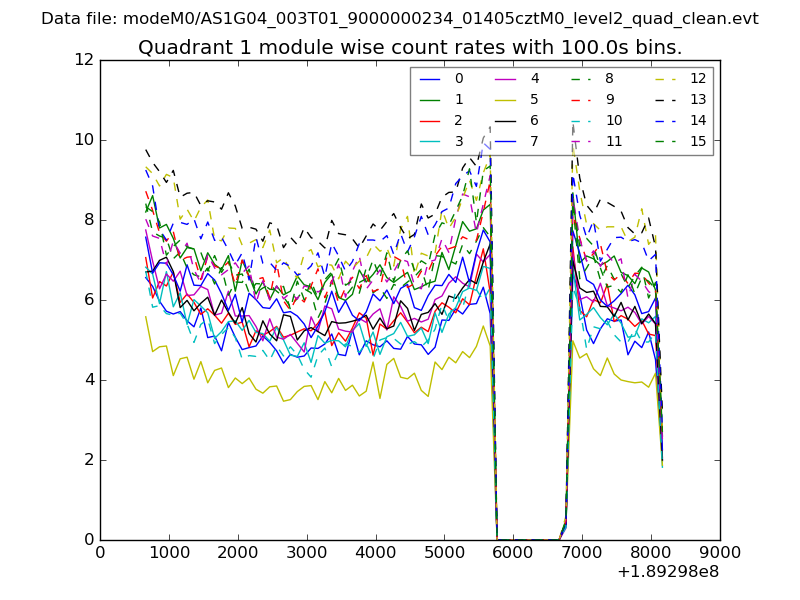
| Module-wise count rates for Quadrant A Data is divided into 100 sec bins |
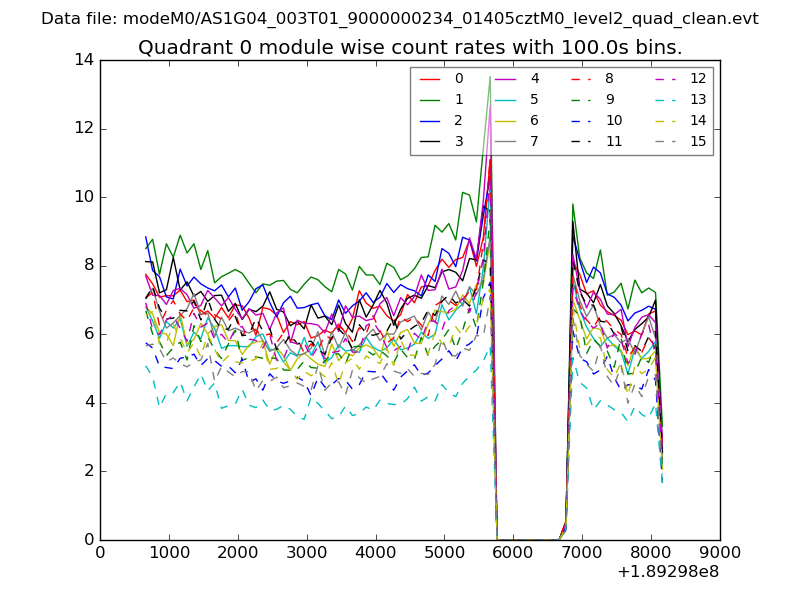 |
 |
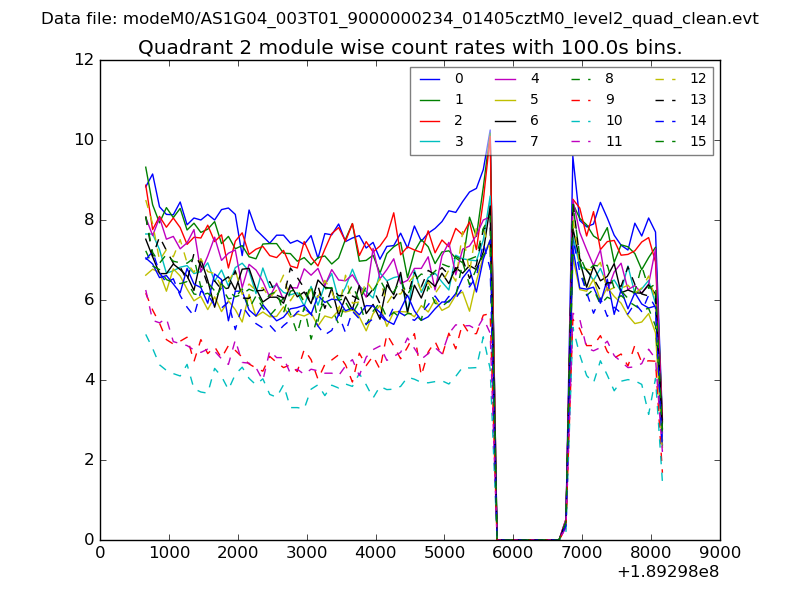
| Module-wise count rates for Quadrant B Data is divided into 100 sec bins |
 |
 |
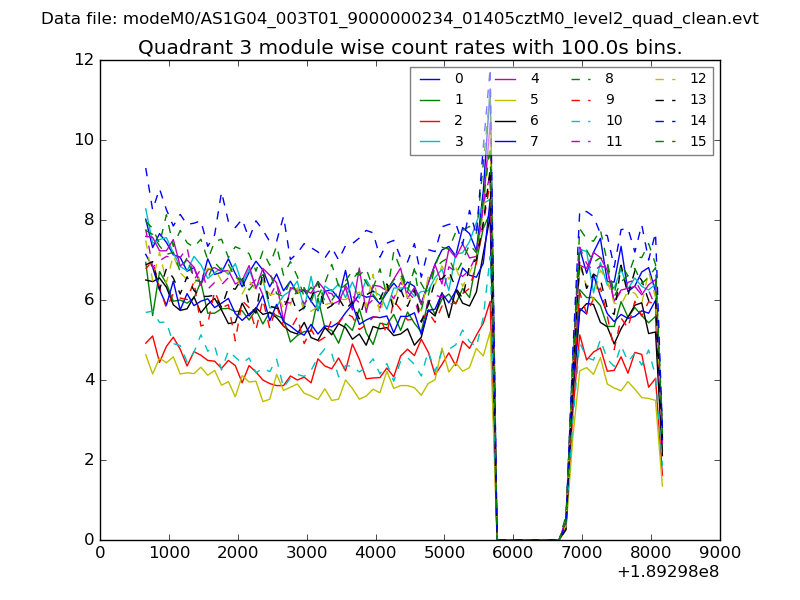
| Module-wise count rates for Quadrant C Data is divided into 100 sec bins |
 |
 |
| Module-wise count rates for Quadrant D Data is divided into 100 sec bins |
 |
 |
| Parameter | Plot |
|---|---|
| CZT HV Monitor | 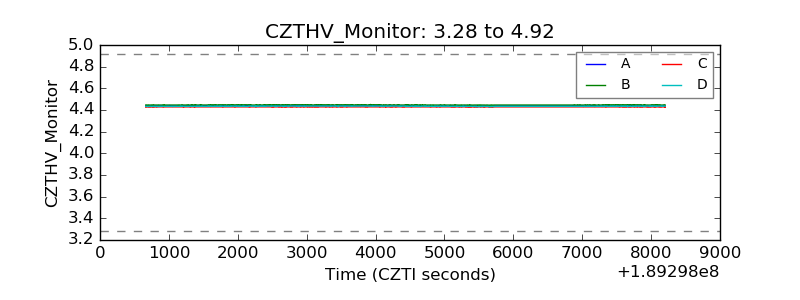 |
| D_VDD | 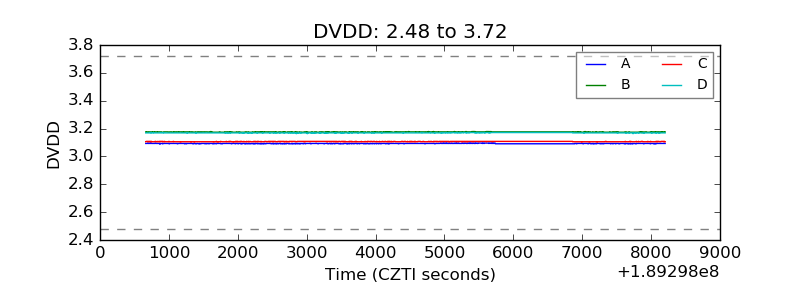 |
| Temperature 1 | 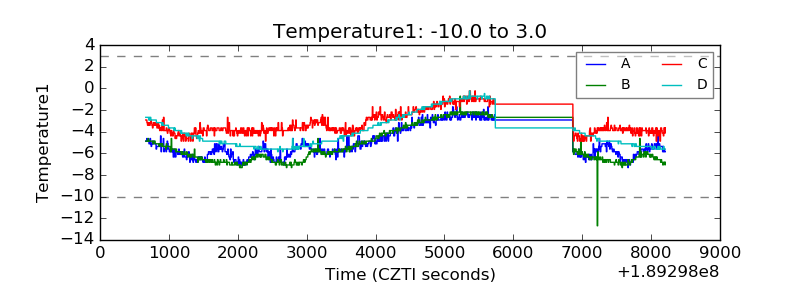 |
| Veto HV Monitor | 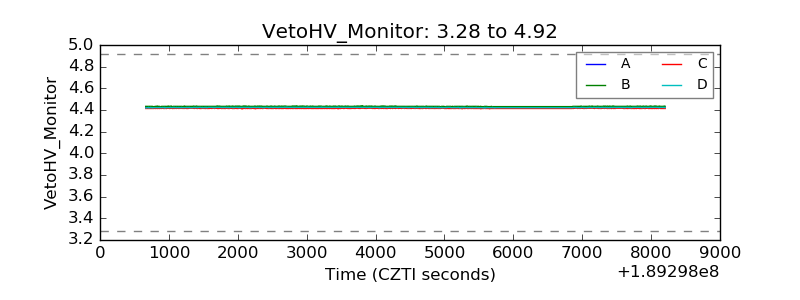 |
| Veto LLD | 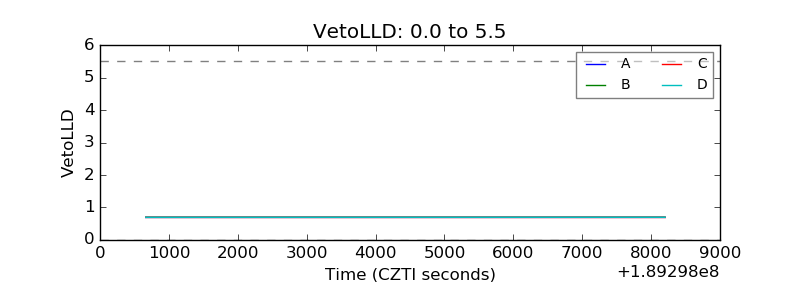 |
| Alpha Counter | 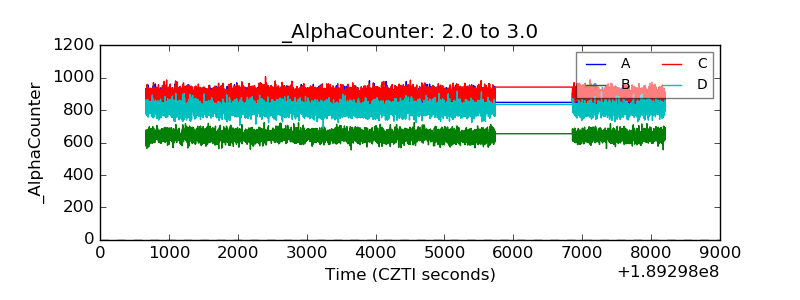 |
| _CPM_Rate | 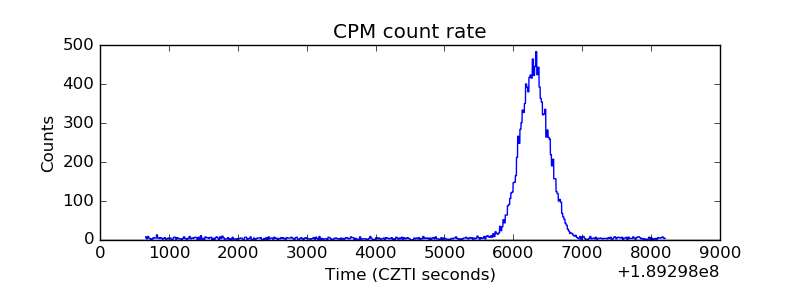 |
| CZT Counter | 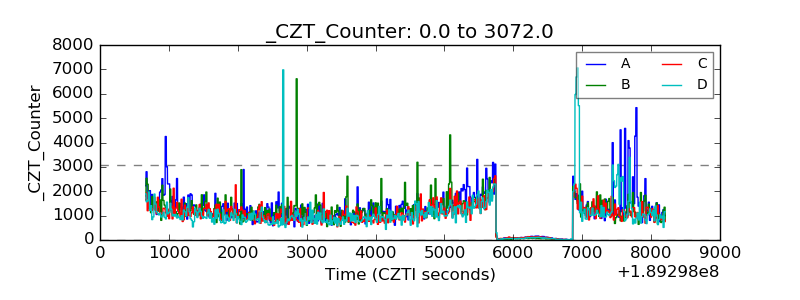 |
| +2.5 Volts monitor |  |
| +5 Volts monitor |  |
| _ROLL_ROT | 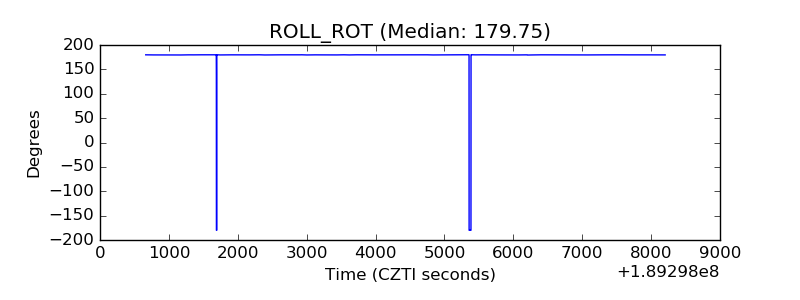 |
| _Roll_DEC | 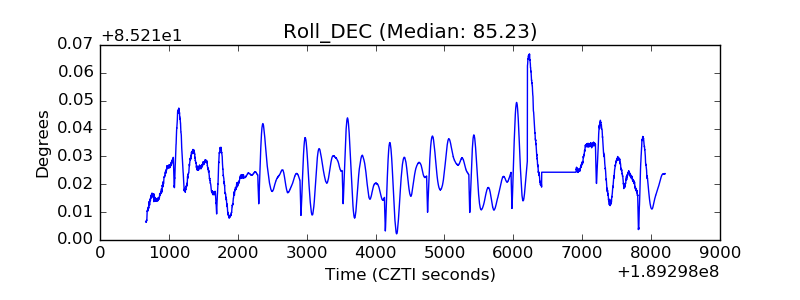 |
| _Roll_RA | 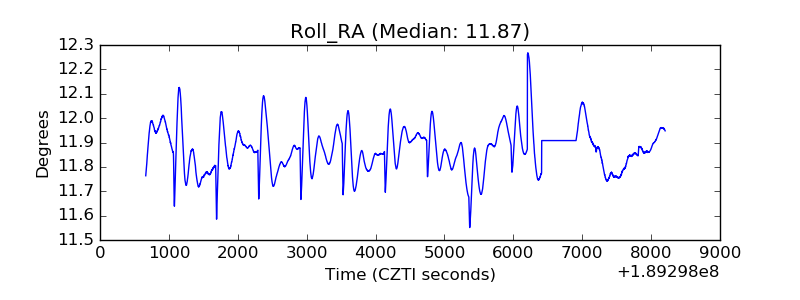 |
| Veto Counter | 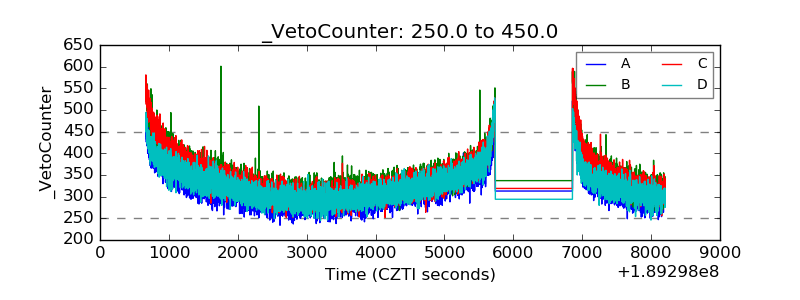 |