| Param | Original file | Final file |
|---|---|---|
| Filename | modeM0/AS1G04_003T01_9000000234_01406cztM0_level2.evt | modeM0/AS1G04_003T01_9000000234_01406cztM0_level2_quad_clean.evt |
| Size (bytes) | 1,174,294,080 | 105,408,000 |
| Size | 1.1 GB | 100.5 MB |
| Events in quadrant A | 11,077,942 | 662,309 |
| Events in quadrant B | 8,691,114 | 689,586 |
| Events in quadrant C | 7,875,380 | 681,799 |
| Events in quadrant D | 7,453,896 | 669,032 |
| Mode M9 | |||
|---|---|---|---|
| Quadrant | BADHDUFLAG | Total packets | Discarded packets |
| A | 0 | 9 | 0 |
| B | 0 | 9 | 0 |
| C | 0 | 9 | 0 |
| D | 0 | 9 | 0 |
| Mode SS | |||
|---|---|---|---|
| Quadrant | BADHDUFLAG | Total packets | Discarded packets |
| A | 0 | 142 | 0 |
| B | 0 | 142 | 0 |
| C | 0 | 142 | 0 |
| D | 0 | 142 | 0 |
| Mode M0 | |||
|---|---|---|---|
| Quadrant | BADHDUFLAG | Total packets | Discarded packets |
| A | 0 | 37893 | 3 |
| B | 0 | 30797 | 2 |
| C | 0 | 28416 | 2 |
| D | 0 | 27191 | 2 |
| Quadrant | Total seconds | Saturated seconds | Saturation percentage |
|---|---|---|---|
| A | 7030 | 435 | 6.187767% |
| B | 7030 | 58 | 0.825036% |
| C | 7030 | 3 | 0.042674% |
| D | 7030 | 75 | 1.066856% |
Noise dominated data is calculated using 1-second bins in cleaned event files. If a bin has >2000 counts, and if more than 50% of those come from <1% of pixels, then it is considered to be noise-dominated and hence unusable.
| Quadrant | # 1 sec bins | Bins with >0 counts | Bins with >2000 counts | High rate bins dominated by noise | Noise dominated (total time) | Noise dominated (detector-on time) | Marked lightcurve |
|---|---|---|---|---|---|---|---|
| A | 7910 | 7030 | 1517 | 1517 | 19.18% | 21.58% | 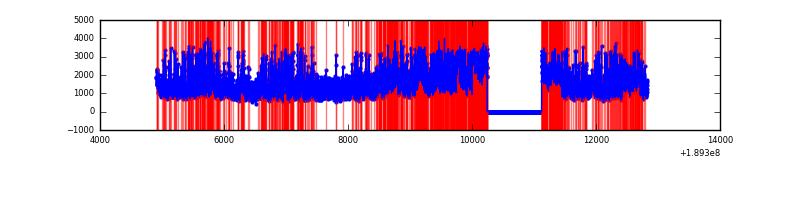 |
| B | 7910 | 7031 | 297 | 297 | 3.75% | 4.22% | 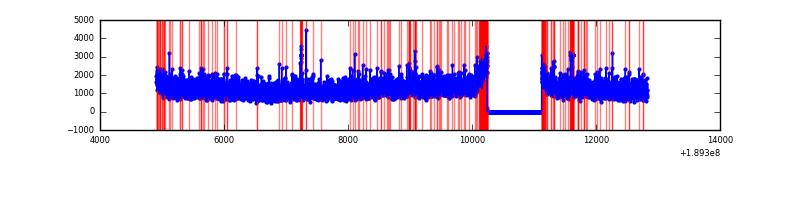 |
| C | 7910 | 7031 | 137 | 137 | 1.73% | 1.95% | 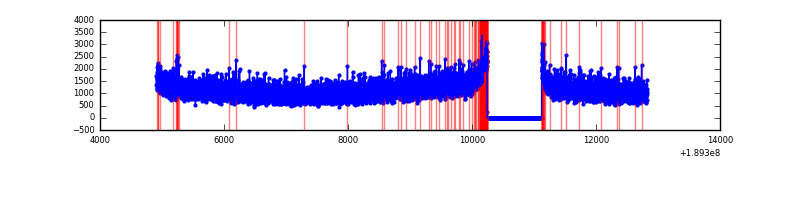 |
| D | 7910 | 7031 | 288 | 288 | 3.64% | 4.10% | 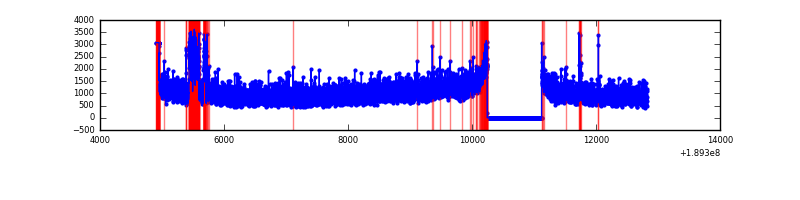 |
Top three noisy pixels from each quadrant. If the there are fewer than three noisy pixels in the level2.evt file, extra rows are filled as -1
| Pixel properties | Quadrant properties | ||||||
|---|---|---|---|---|---|---|---|
| Quadrant | DetID | PixID | Counts | Sigma | Mean | Median | Sigma |
| A | 15 | 127 | 2096363 | 4335.62 | 2007 | 2017 | 483.1 |
| A | 4 | 32 | 1179647 | 2437.88 | 2007 | 2017 | 483.1 |
| A | 0 | 36 | 42031 | 82.84 | 2007 | 2017 | 483.1 |
| B | 5 | 191 | 135678 | 263.36 | 2158 | 2167 | 507.0 |
| B | 6 | 53 | 91937 | 177.08 | 2158 | 2167 | 507.0 |
| B | 8 | 4 | 84503 | 162.41 | 2158 | 2167 | 507.0 |
| C | 15 | 241 | 260992 | 481.48 | 1938 | 2007 | 537.9 |
| C | 3 | 111 | 21280 | 35.83 | 1938 | 2007 | 537.9 |
| C | 3 | 79 | 17319 | 28.47 | 1938 | 2007 | 537.9 |
| D | 9 | 66 | 338823 | 589.91 | 1844 | 1911 | 571.1 |
| D | 15 | 217 | 103017 | 177.03 | 1844 | 1911 | 571.1 |
| D | 1 | 47 | 29173 | 47.73 | 1844 | 1911 | 571.1 |
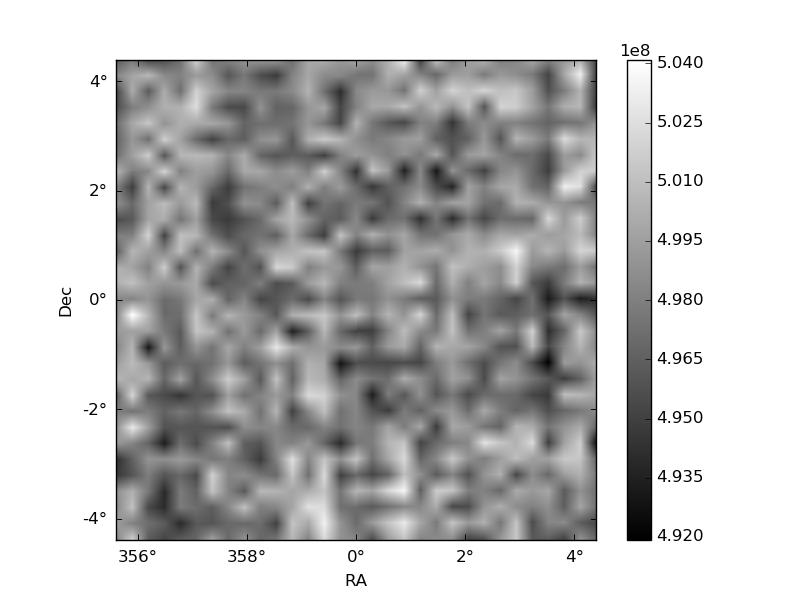
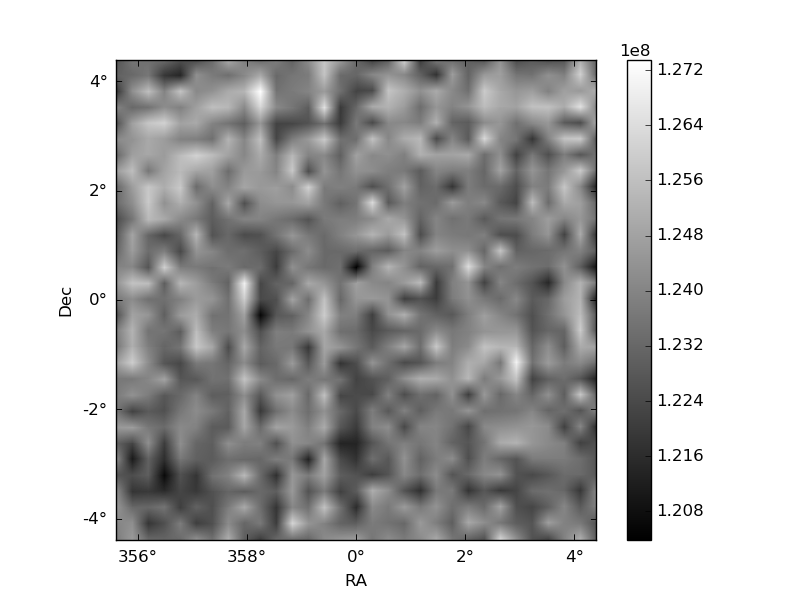
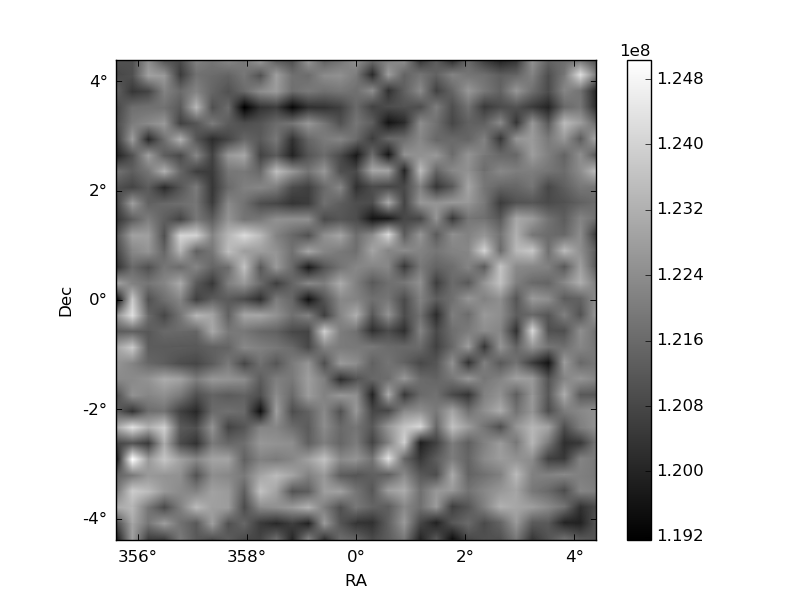
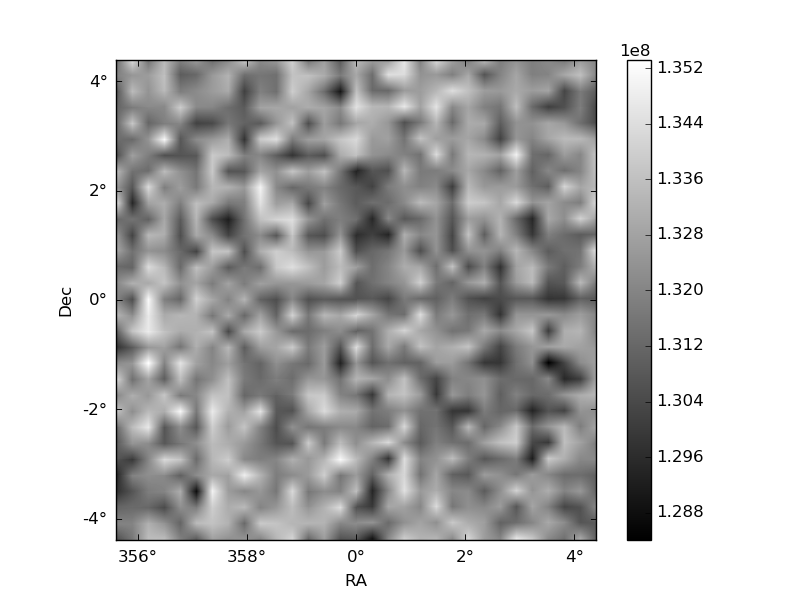
Histogram calculated using DETX and DETY for each event in the final _common_clean file
| Quadrant A | 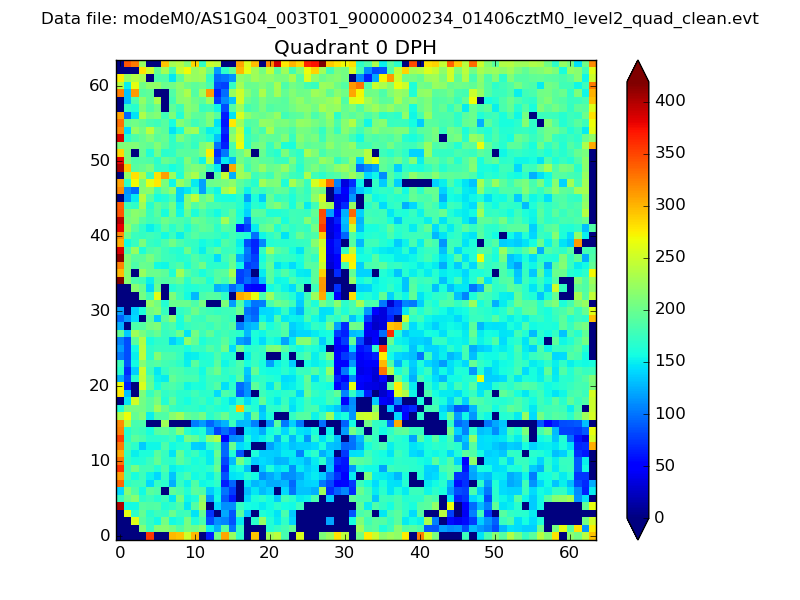 |
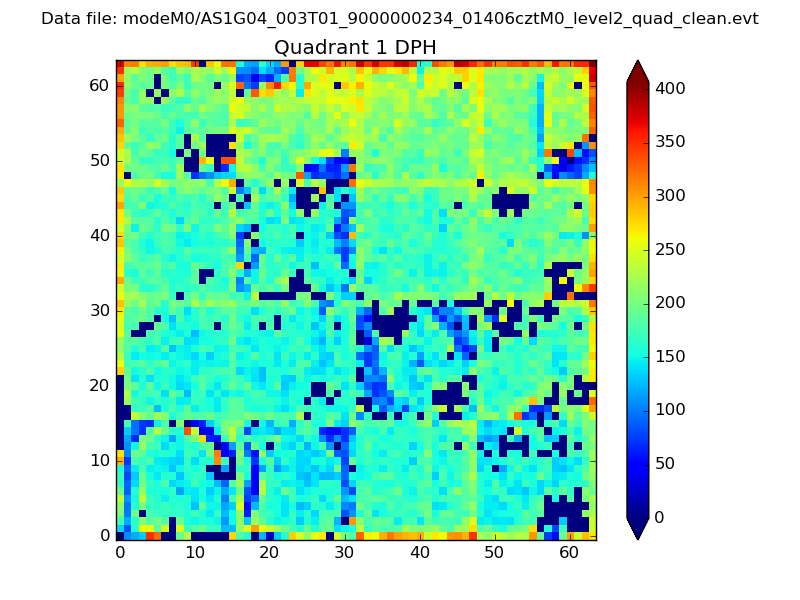 |
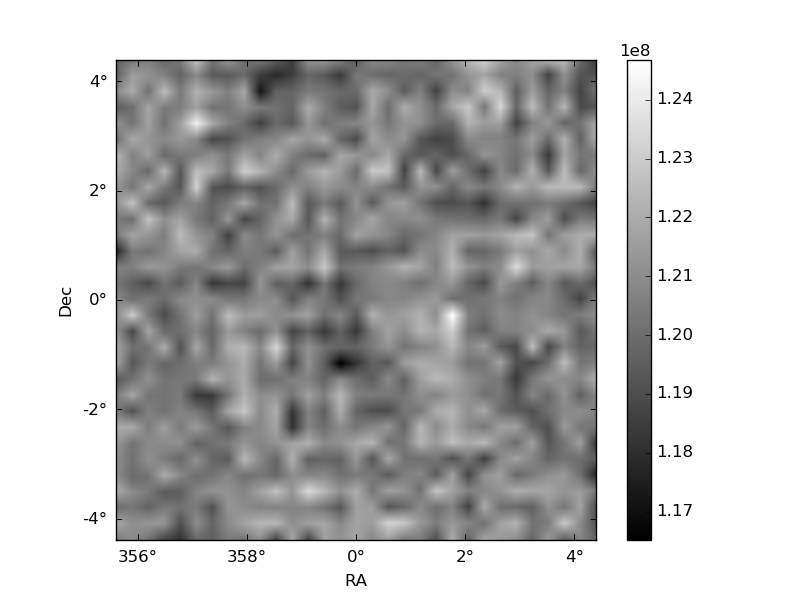
Quadrant B |
|---|---|---|---|
| Quadrant D | 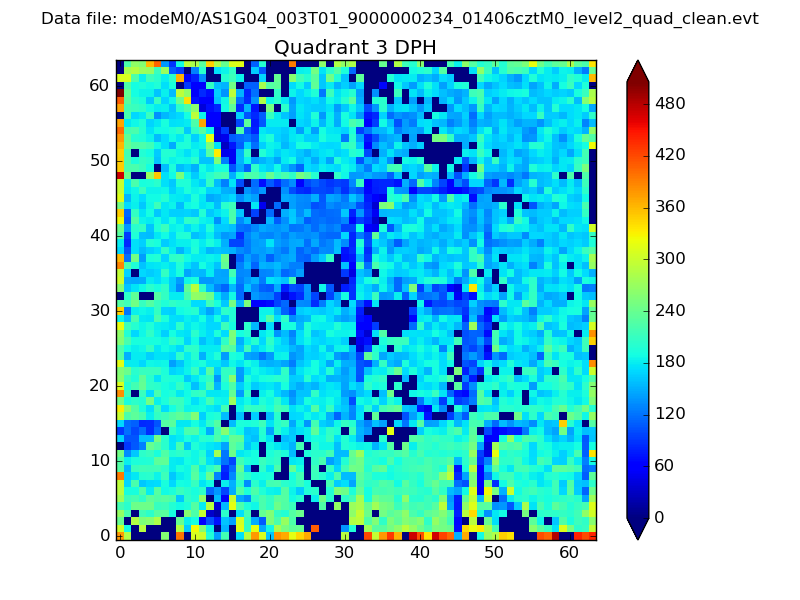 |
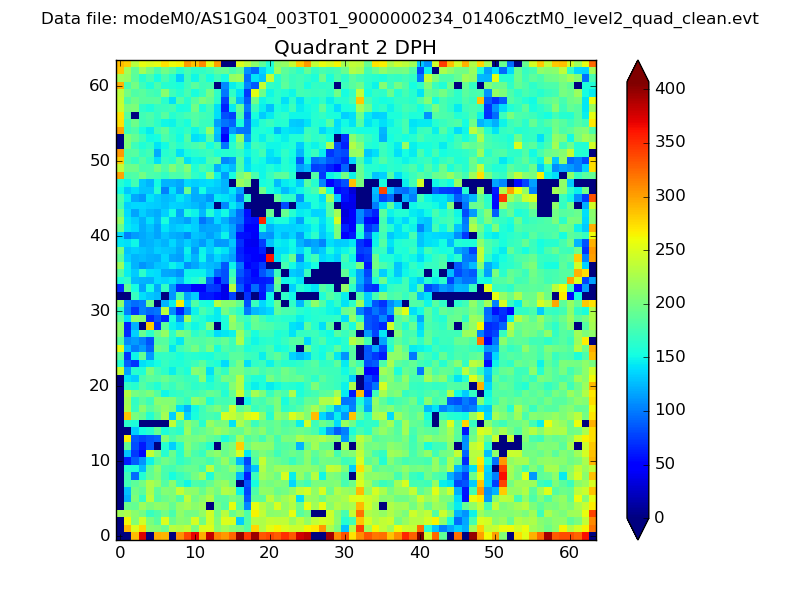 |
Quadrant C |
| Plot type | Count rate plots | Images |
|---|---|---|
| Comparison with Poisson distribution Blue bars denote a histogram of data divided into 1 sec bins. Red curve is a Poisson curve with rate = median count rate of data. |
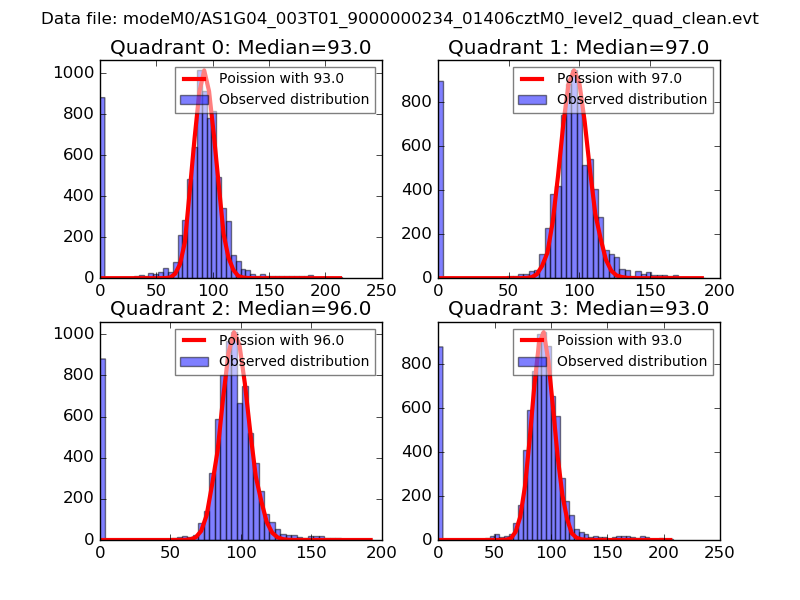 |
 |
| Quadrant-wise count rates Data is divided into 100 sec bins |
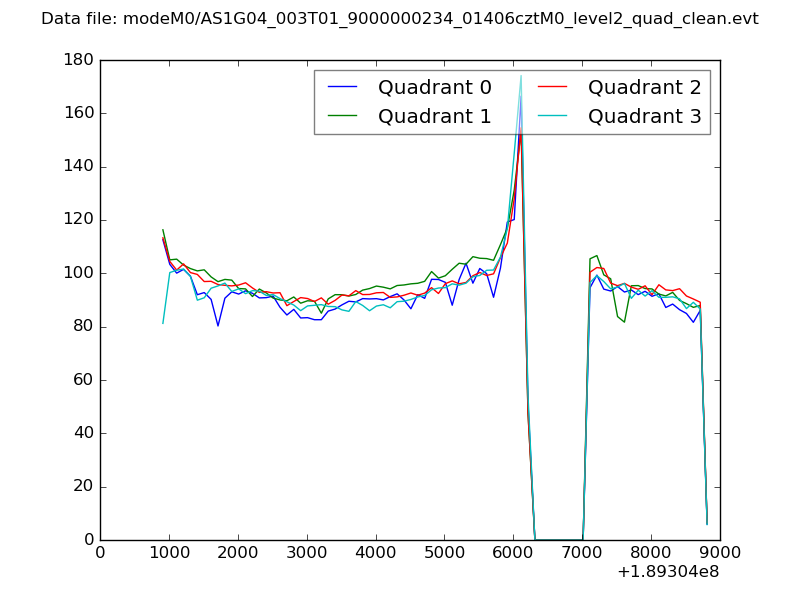 |
|
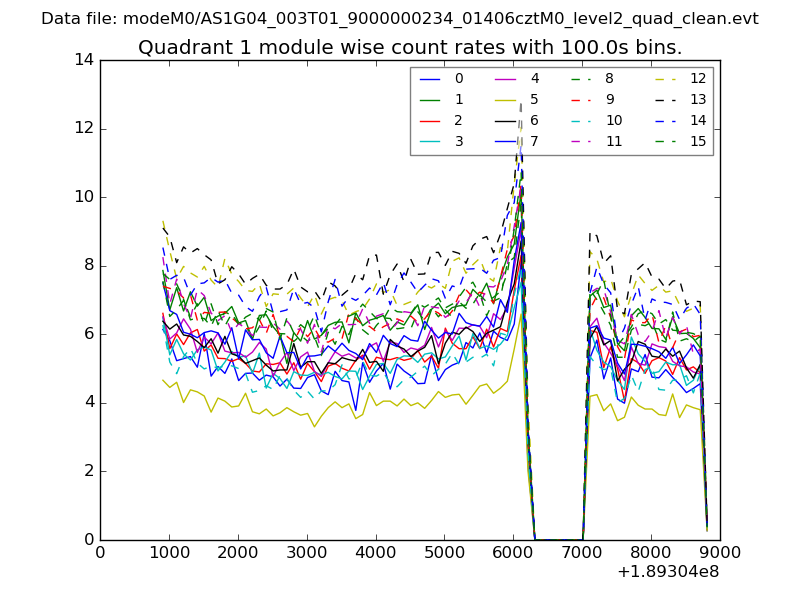
| Module-wise count rates for Quadrant A Data is divided into 100 sec bins |
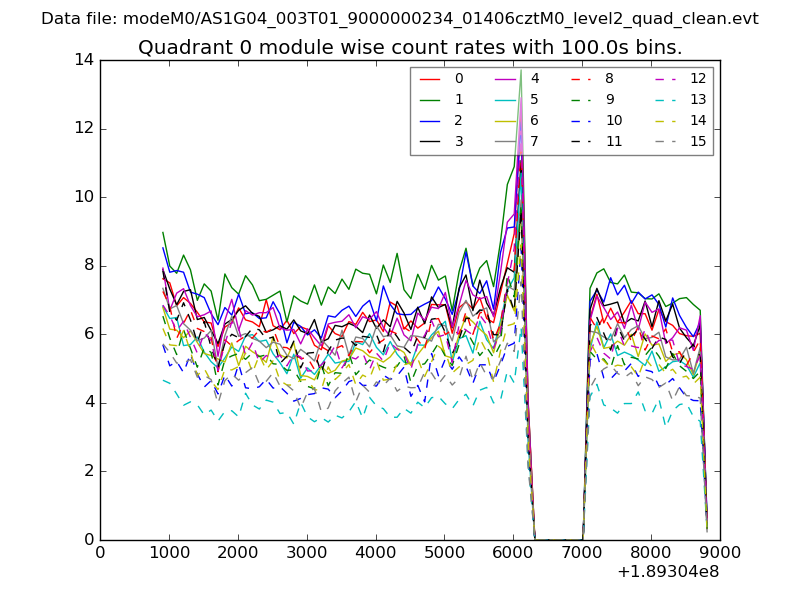 |
 |
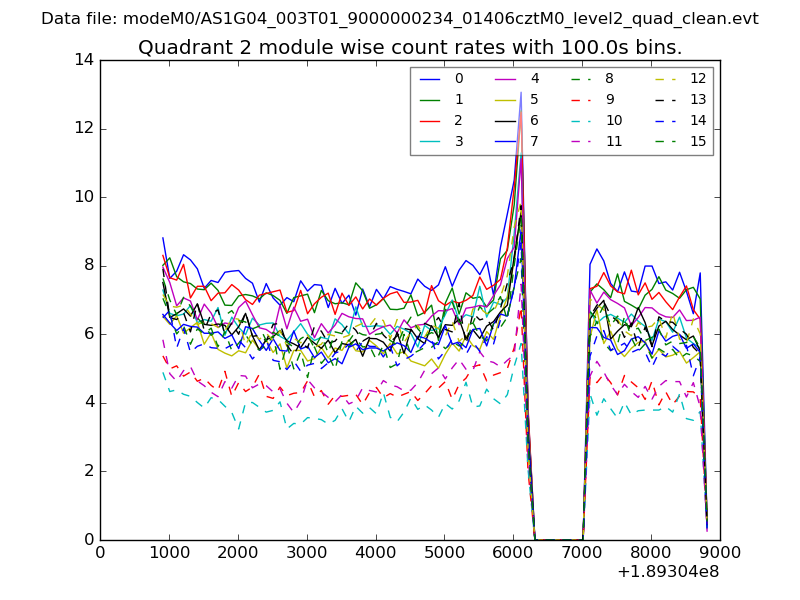
| Module-wise count rates for Quadrant B Data is divided into 100 sec bins |
 |
 |
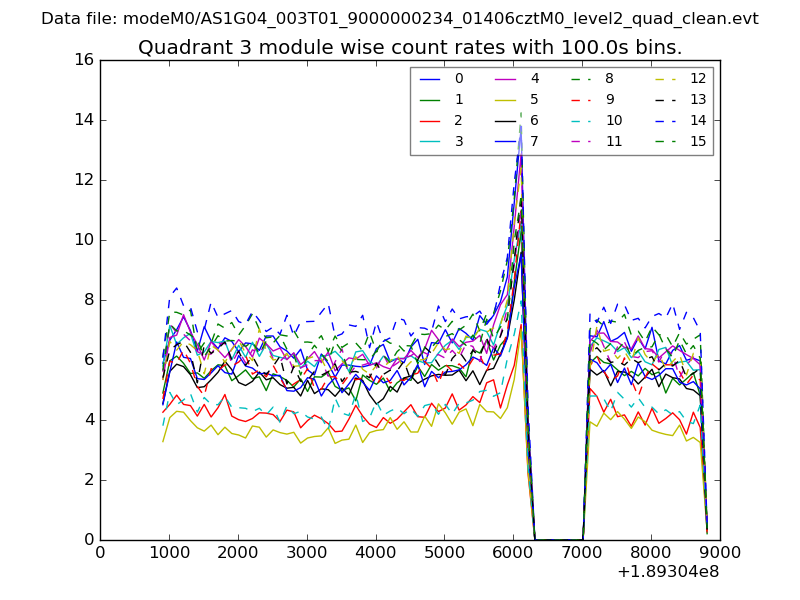
| Module-wise count rates for Quadrant C Data is divided into 100 sec bins |
 |
 |
| Module-wise count rates for Quadrant D Data is divided into 100 sec bins |
 |
 |
| Parameter | Plot |
|---|---|
| CZT HV Monitor | 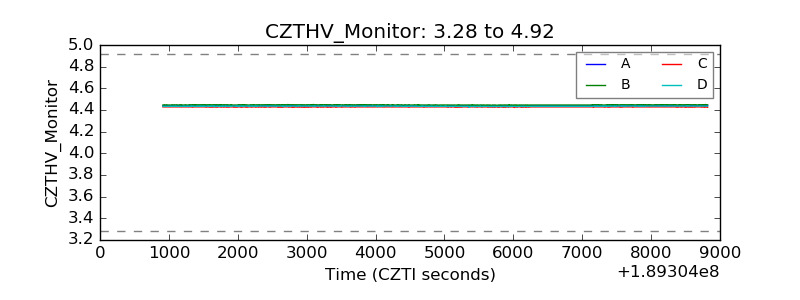 |
| D_VDD | 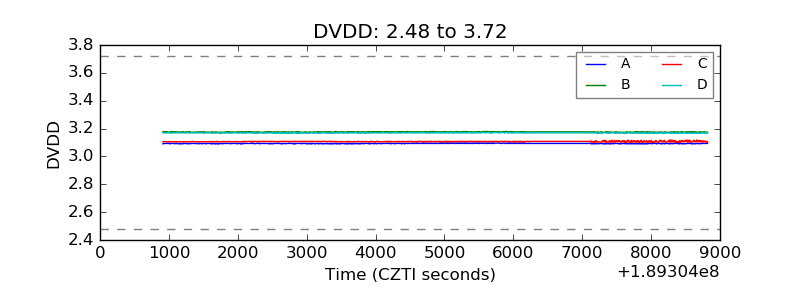 |
| Temperature 1 | 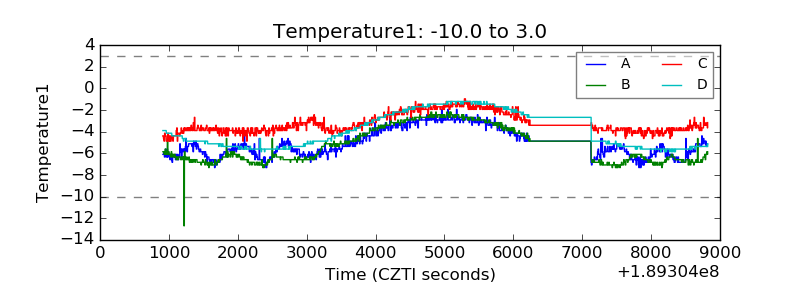 |
| Veto HV Monitor | 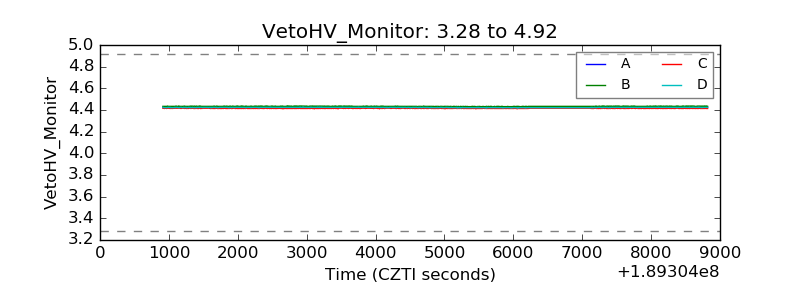 |
| Veto LLD | 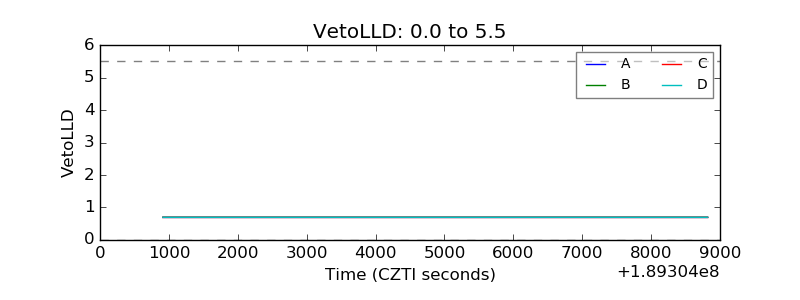 |
| Alpha Counter | 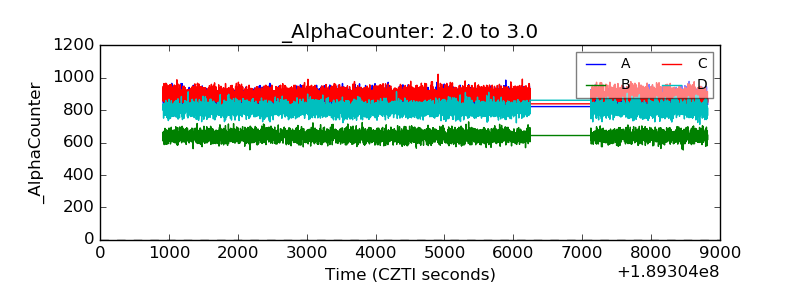 |
| _CPM_Rate | 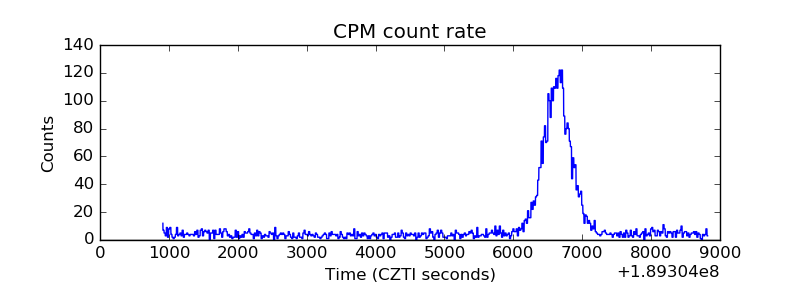 |
| CZT Counter | 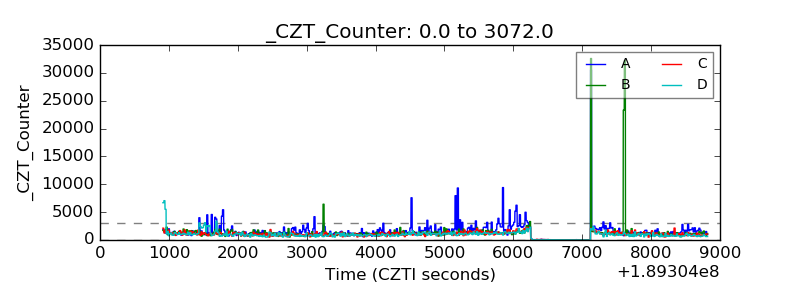 |
| +2.5 Volts monitor | 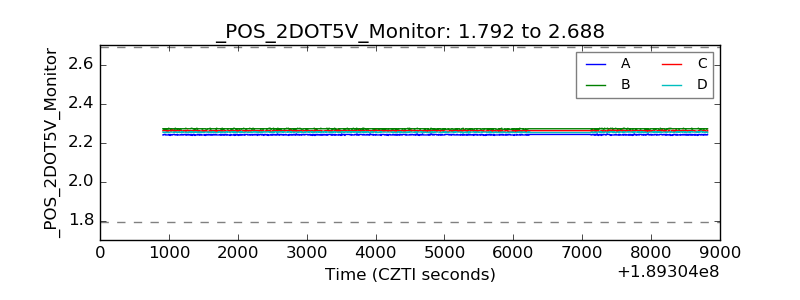 |
| +5 Volts monitor |  |
| _ROLL_ROT | 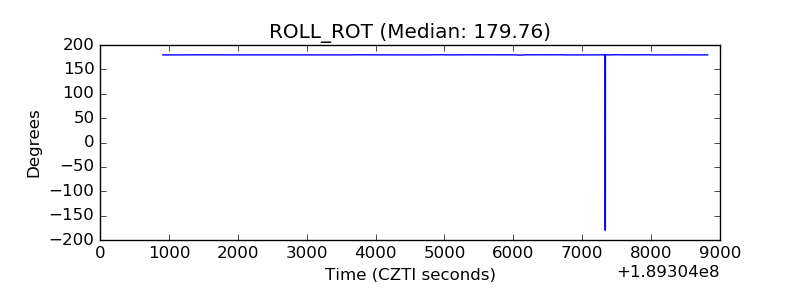 |
| _Roll_DEC | 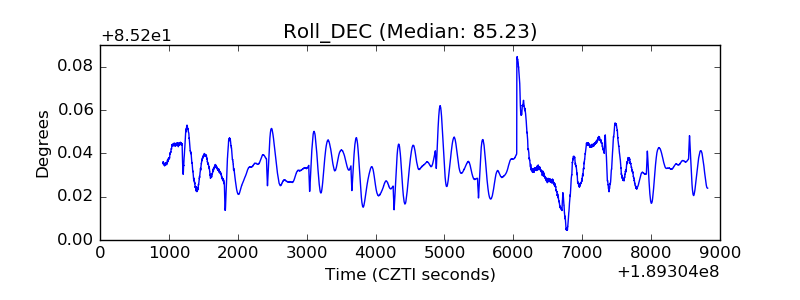 |
| _Roll_RA | 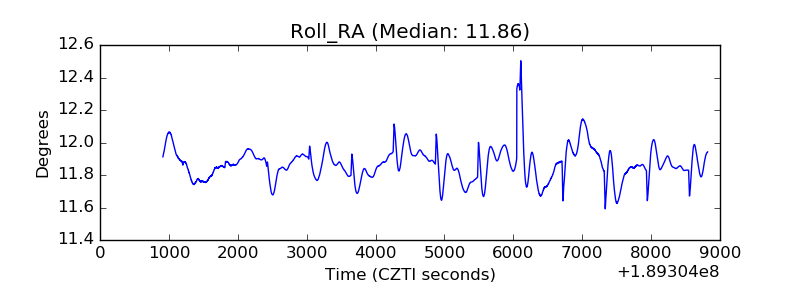 |
| Veto Counter | 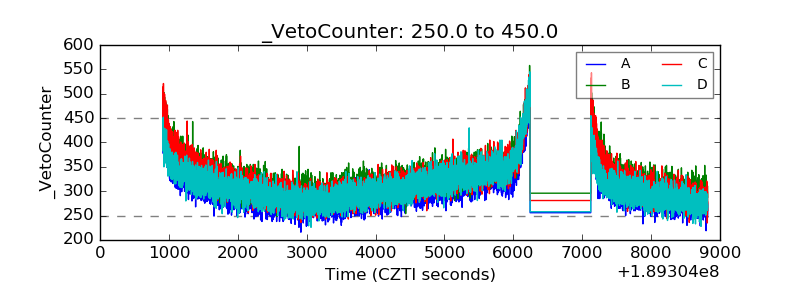 |