| Param | Original file | Final file |
|---|---|---|
| Filename | modeM0/AS1G04_003T01_9000000234_01408cztM0_level2.evt | modeM0/AS1G04_003T01_9000000234_01408cztM0_level2_quad_clean.evt |
| Size (bytes) | 1,298,836,800 | 107,939,520 |
| Size | 1.2 GB | 102.9 MB |
| Events in quadrant A | 12,759,543 | 673,599 |
| Events in quadrant B | 9,682,826 | 704,546 |
| Events in quadrant C | 8,481,398 | 695,017 |
| Events in quadrant D | 7,927,878 | 685,590 |
| Mode SS | |||
|---|---|---|---|
| Quadrant | BADHDUFLAG | Total packets | Discarded packets |
| A | 0 | 146 | 0 |
| B | 0 | 146 | 0 |
| C | 0 | 146 | 0 |
| D | 0 | 146 | 0 |
| Mode M0 | |||
|---|---|---|---|
| Quadrant | BADHDUFLAG | Total packets | Discarded packets |
| A | 0 | 43054 | 2 |
| B | 0 | 33937 | 1 |
| C | 0 | 30480 | 1 |
| D | 0 | 28781 | 1 |
| Quadrant | Total seconds | Saturated seconds | Saturation percentage |
|---|---|---|---|
| A | 7332 | 409 | 5.578287% |
| B | 7332 | 43 | 0.586470% |
| C | 7332 | 3 | 0.040917% |
| D | 7332 | 7 | 0.095472% |
Noise dominated data is calculated using 1-second bins in cleaned event files. If a bin has >2000 counts, and if more than 50% of those come from <1% of pixels, then it is considered to be noise-dominated and hence unusable.
| Quadrant | # 1 sec bins | Bins with >0 counts | Bins with >2000 counts | High rate bins dominated by noise | Noise dominated (total time) | Noise dominated (detector-on time) | Marked lightcurve |
|---|---|---|---|---|---|---|---|
| A | 7347 | 7333 | 2173 | 2173 | 29.58% | 29.63% | 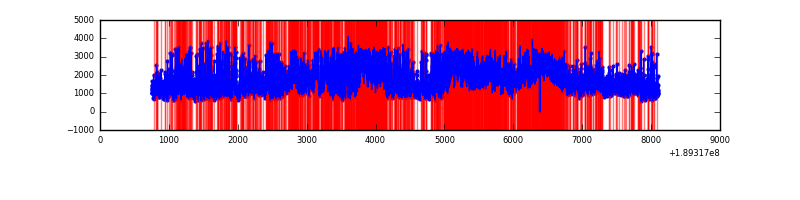 |
| B | 7347 | 7333 | 573 | 573 | 7.80% | 7.81% | 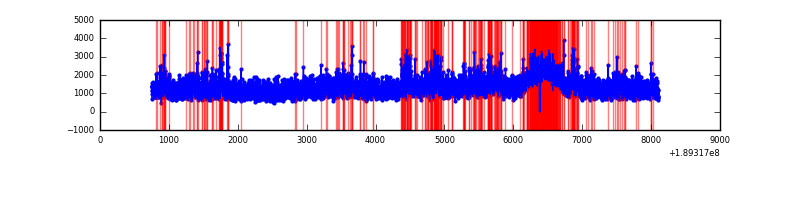 |
| C | 7347 | 7333 | 170 | 170 | 2.31% | 2.32% | 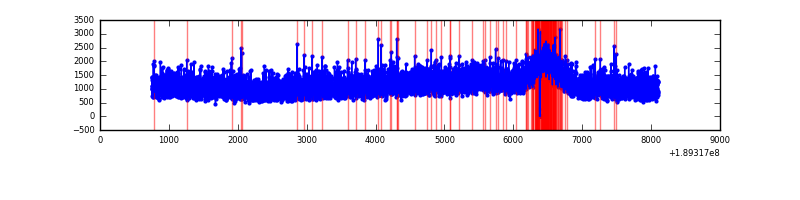 |
| D | 7347 | 7333 | 189 | 189 | 2.57% | 2.58% | 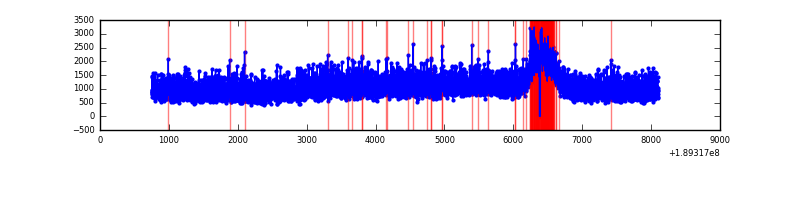 |
Top three noisy pixels from each quadrant. If the there are fewer than three noisy pixels in the level2.evt file, extra rows are filled as -1
| Pixel properties | Quadrant properties | ||||||
|---|---|---|---|---|---|---|---|
| Quadrant | DetID | PixID | Counts | Sigma | Mean | Median | Sigma |
| A | 15 | 127 | 4071847 | 7515.42 | 2218 | 2235 | 541.5 |
| A | 12 | 243 | 99127 | 178.93 | 2218 | 2235 | 541.5 |
| A | 15 | 233 | 72254 | 129.3 | 2218 | 2235 | 541.5 |
| B | 8 | 4 | 484210 | 863.51 | 2334 | 2347 | 558.0 |
| B | 6 | 53 | 113019 | 198.33 | 2334 | 2347 | 558.0 |
| B | 12 | 52 | 105775 | 185.35 | 2334 | 2347 | 558.0 |
| C | 15 | 241 | 278842 | 474.9 | 2086 | 2153 | 582.6 |
| C | 3 | 111 | 25804 | 40.59 | 2086 | 2153 | 582.6 |
| C | 3 | 79 | 23875 | 37.28 | 2086 | 2153 | 582.6 |
| D | 13 | 169 | 155820 | 243.6 | 2029 | 2098 | 631.1 |
| D | 9 | 66 | 82687 | 127.71 | 2029 | 2098 | 631.1 |
| D | 13 | 205 | 75535 | 116.37 | 2029 | 2098 | 631.1 |
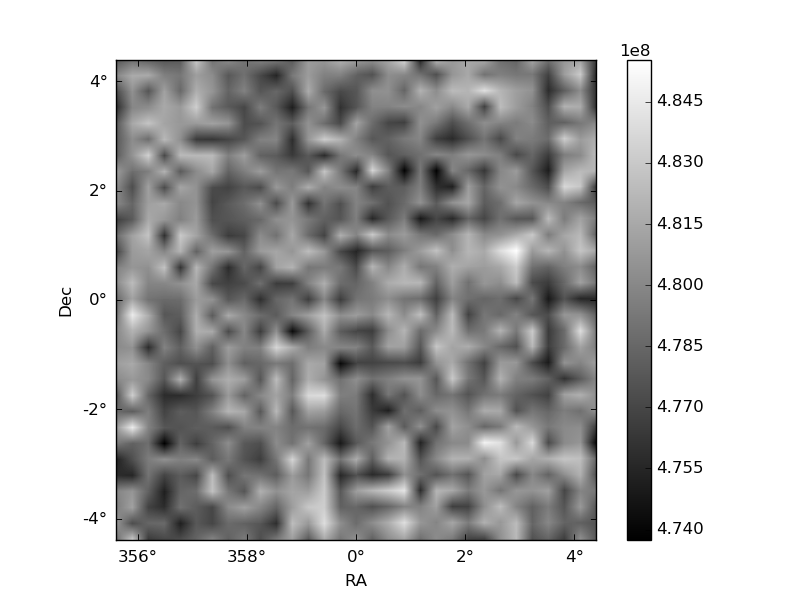
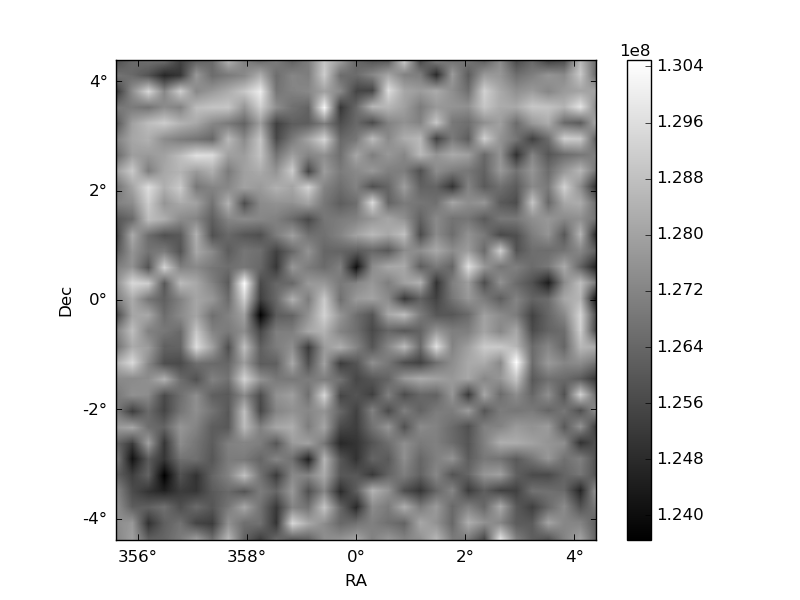
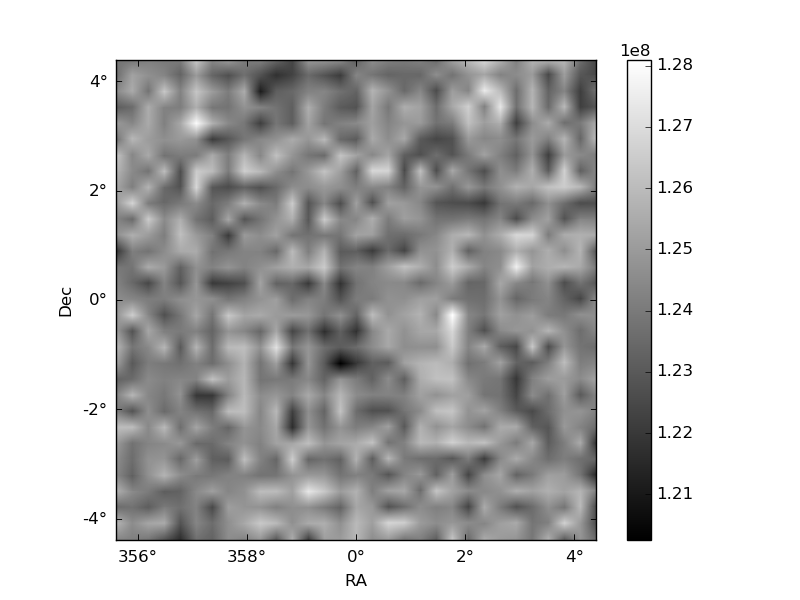
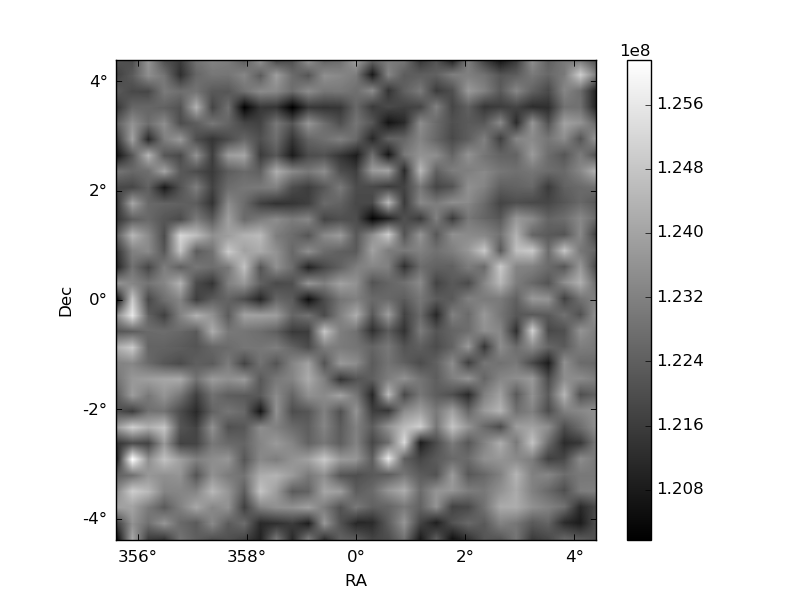
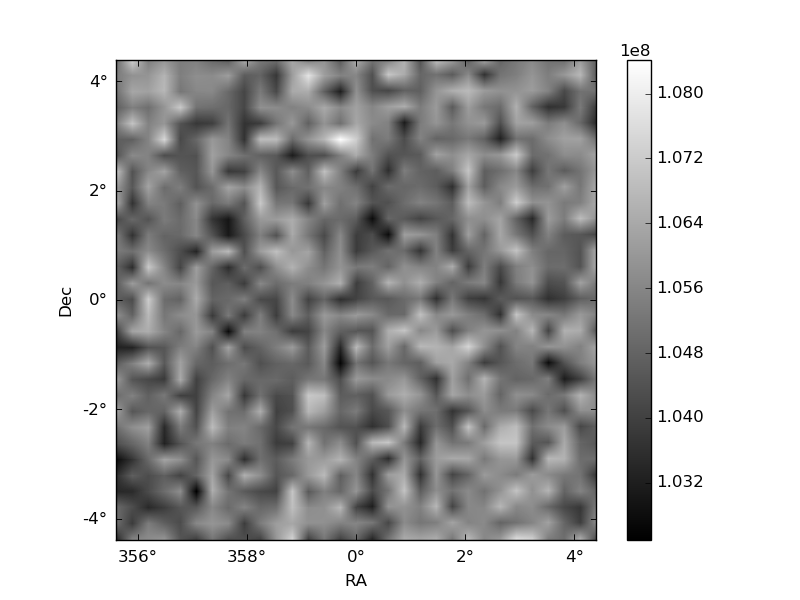
Histogram calculated using DETX and DETY for each event in the final _common_clean file
| Quadrant A | 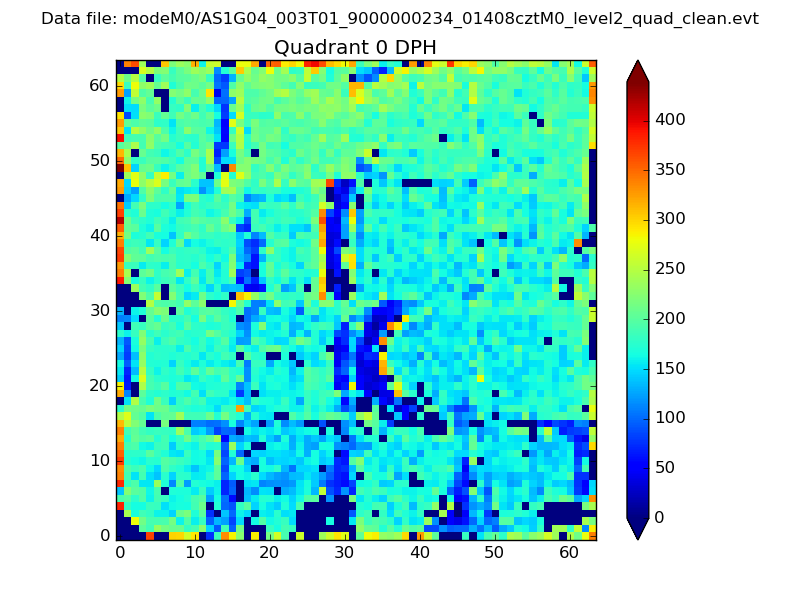 |
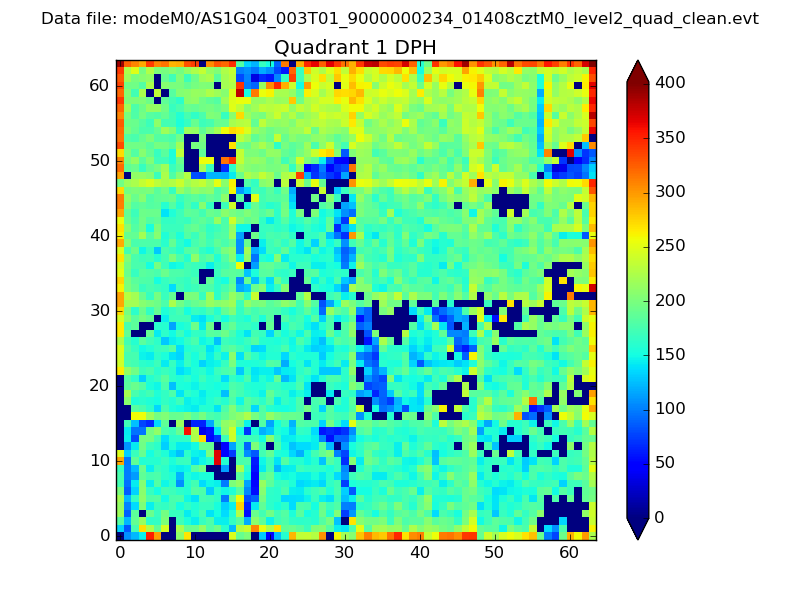 |
Quadrant B |
|---|---|---|---|
| Quadrant D | 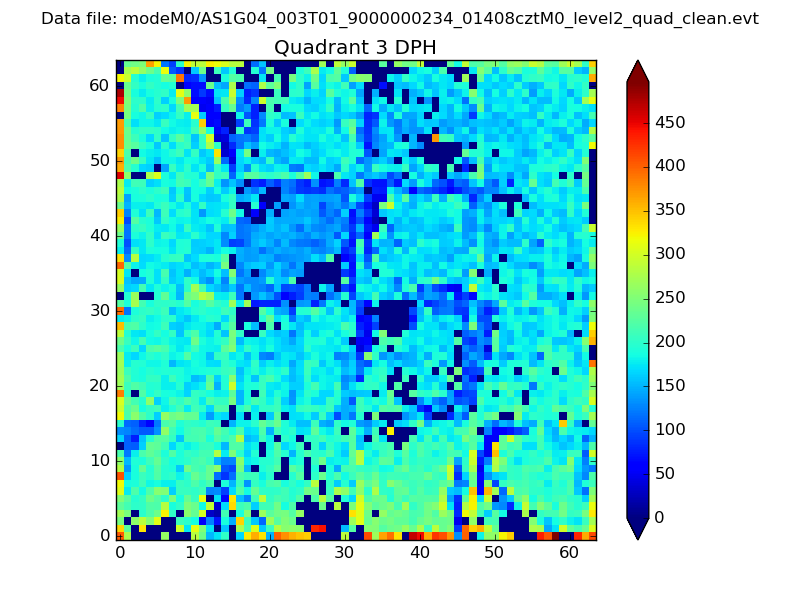 |
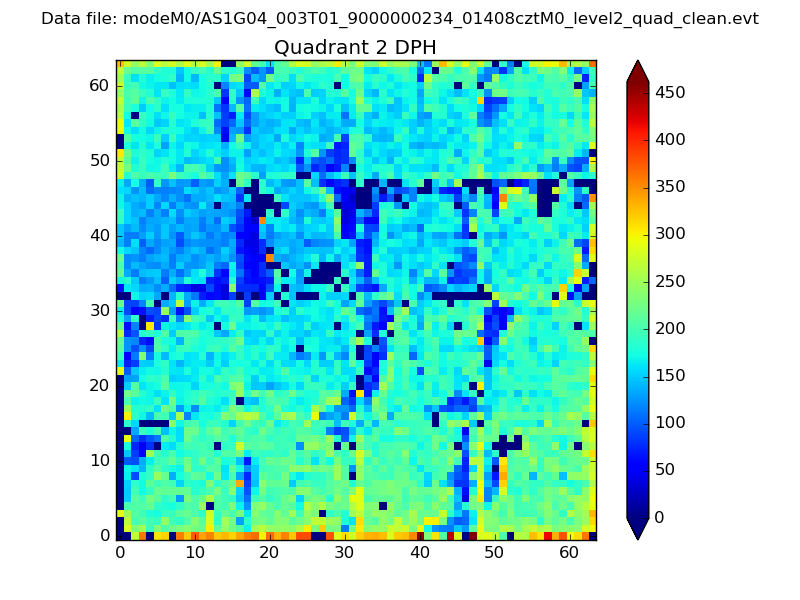 |
Quadrant C |
| Plot type | Count rate plots | Images |
|---|---|---|
| Comparison with Poisson distribution Blue bars denote a histogram of data divided into 1 sec bins. Red curve is a Poisson curve with rate = median count rate of data. |
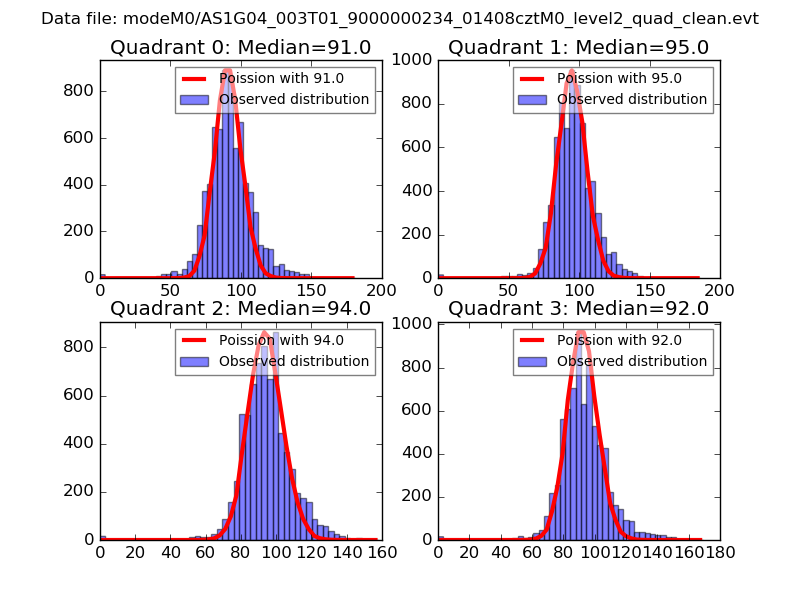 |
 |
| Quadrant-wise count rates Data is divided into 100 sec bins |
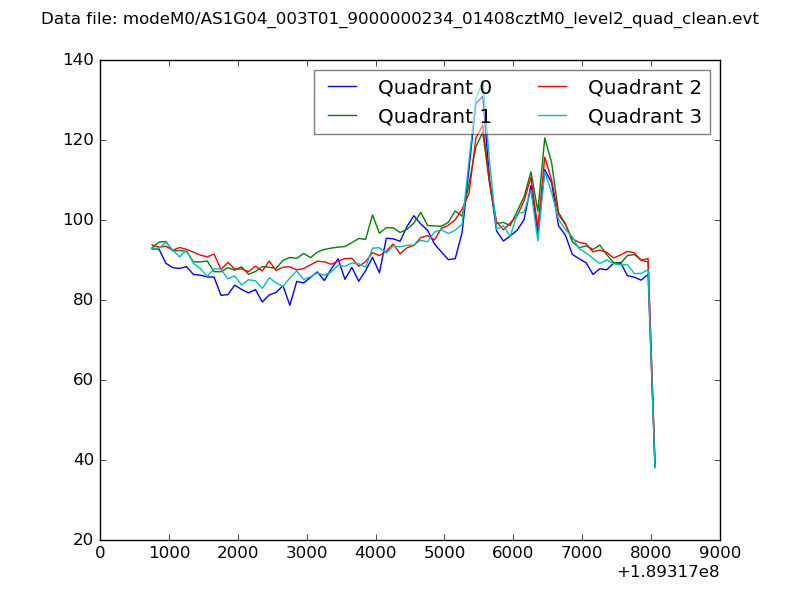 |
|
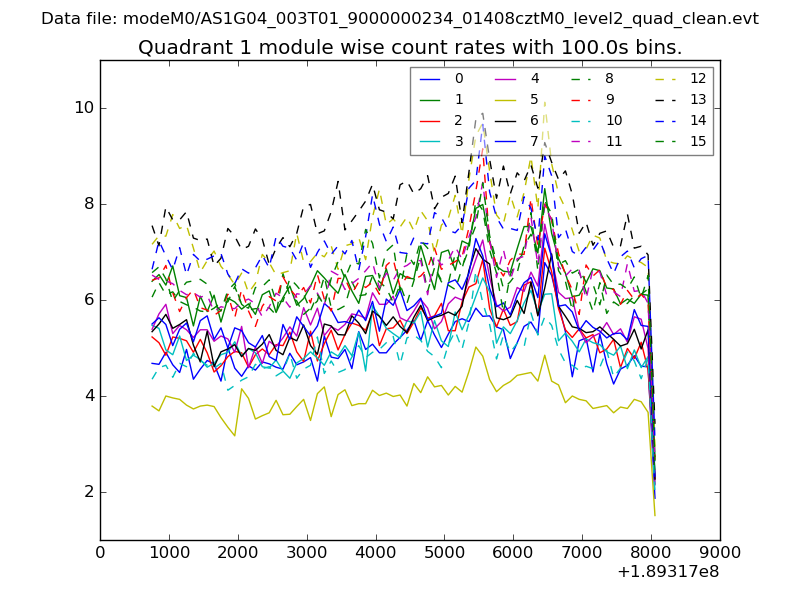
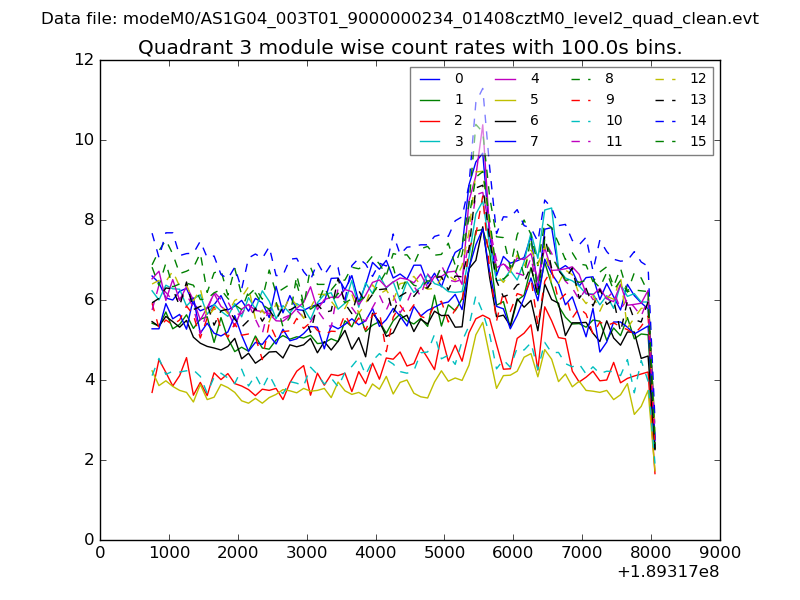
| Module-wise count rates for Quadrant A Data is divided into 100 sec bins |
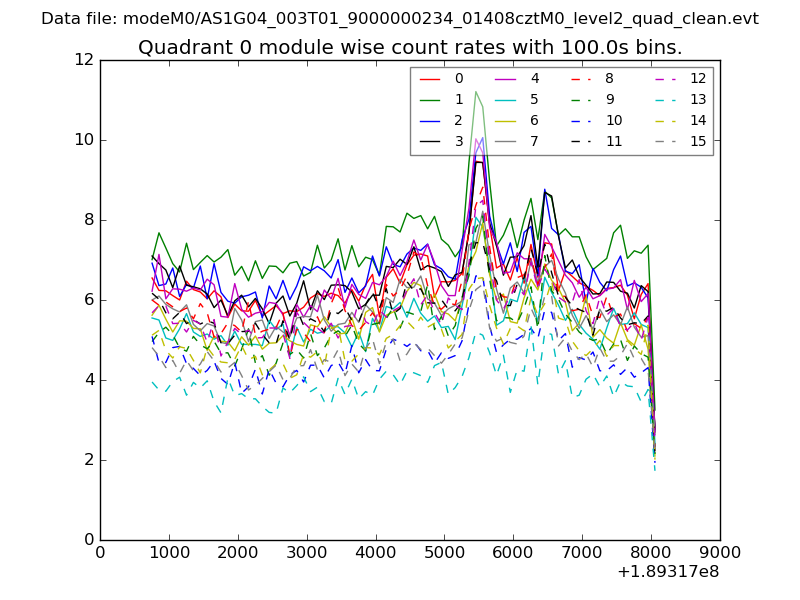 |
 |
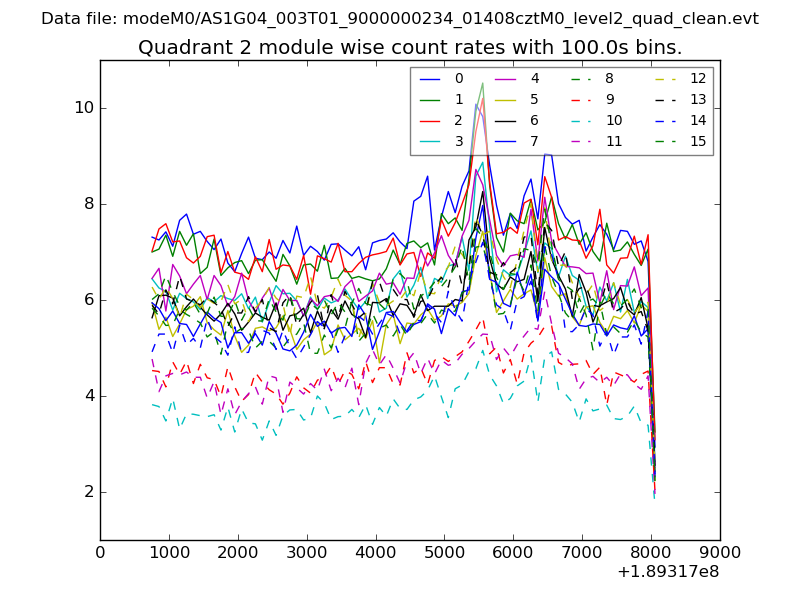
| Module-wise count rates for Quadrant B Data is divided into 100 sec bins |
 |
 |
| Module-wise count rates for Quadrant C Data is divided into 100 sec bins |
 |
 |
| Module-wise count rates for Quadrant D Data is divided into 100 sec bins |
 |
 |
| Parameter | Plot |
|---|---|
| CZT HV Monitor | 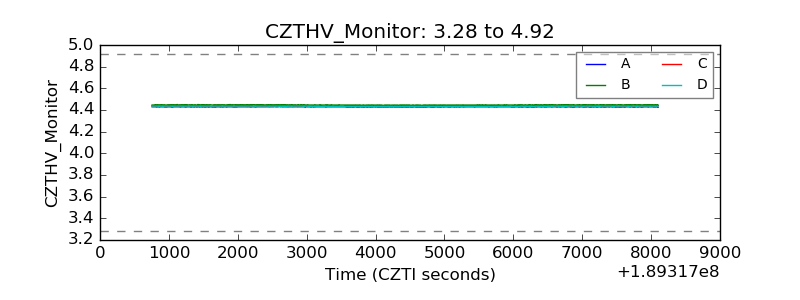 |
| D_VDD | 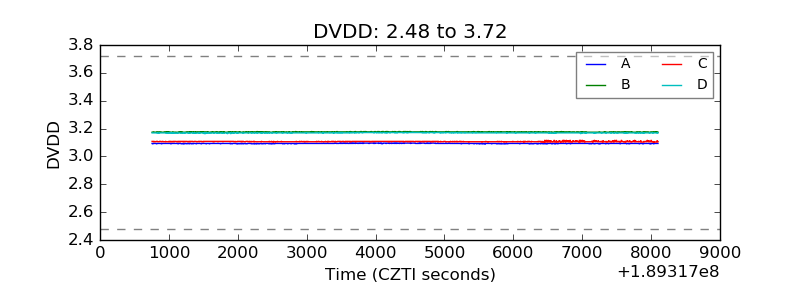 |
| Temperature 1 | 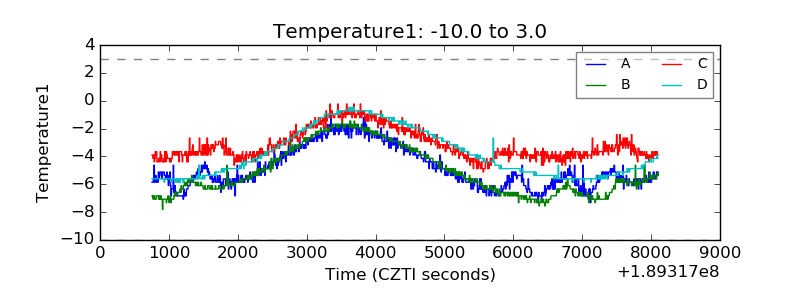 |
| Veto HV Monitor |  |
| Veto LLD | 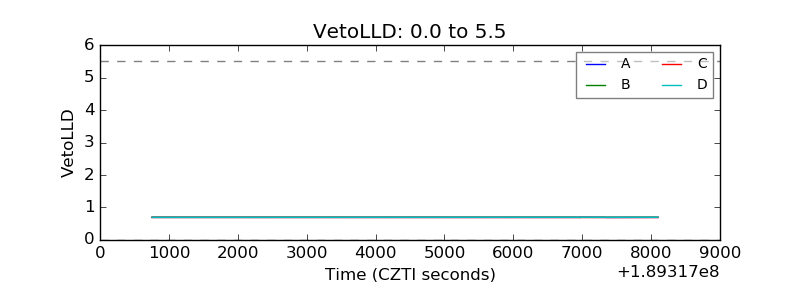 |
| Alpha Counter | 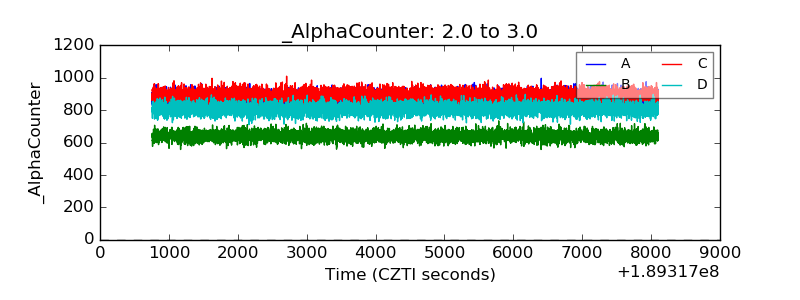 |
| _CPM_Rate | 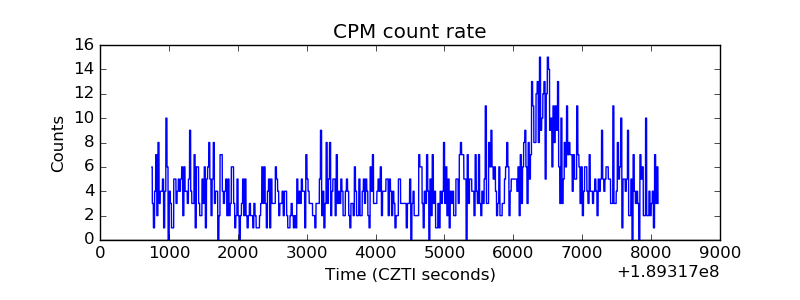 |
| CZT Counter | 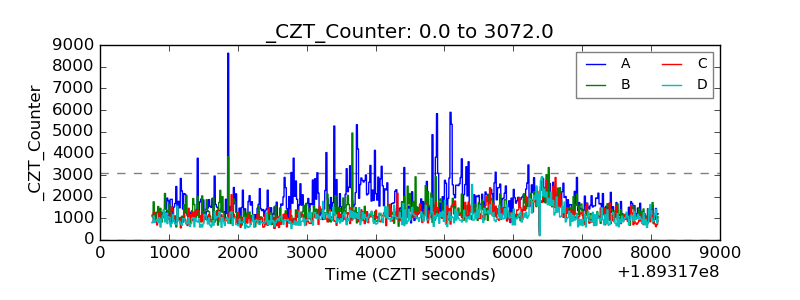 |
| +2.5 Volts monitor | 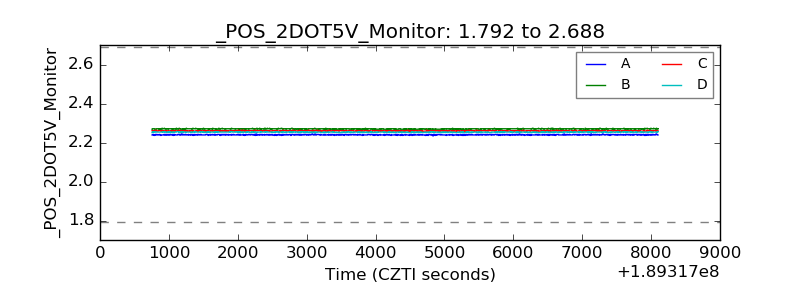 |
| +5 Volts monitor |  |
| _ROLL_ROT | 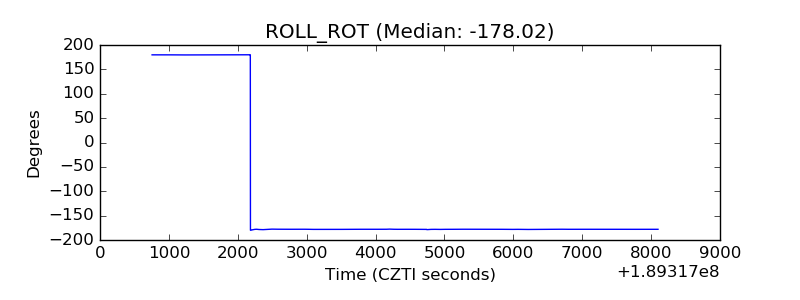 |
| _Roll_DEC | 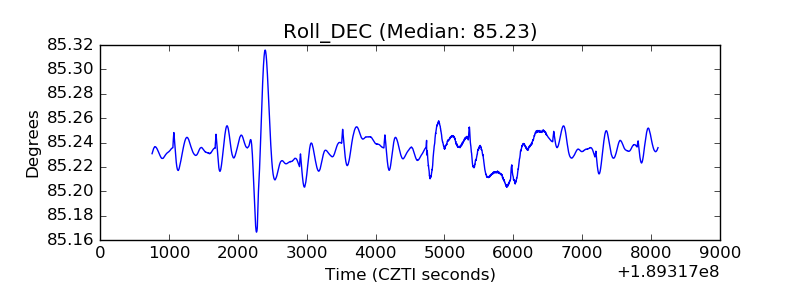 |
| _Roll_RA | 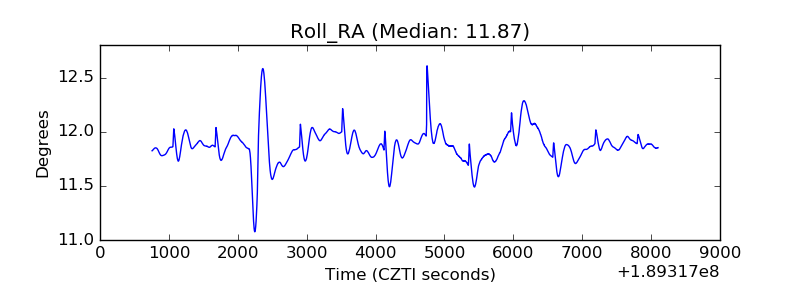 |
| Veto Counter | 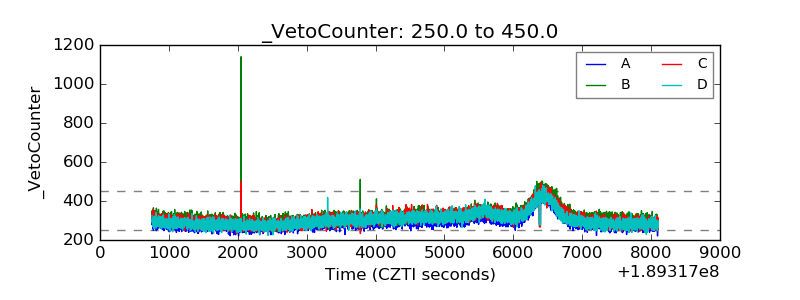 |