| Param | Original file | Final file |
|---|---|---|
| Filename | modeM0/AS1G04_003T01_9000000234_01409cztM0_level2.evt | modeM0/AS1G04_003T01_9000000234_01409cztM0_level2_quad_clean.evt |
| Size (bytes) | 1,279,465,920 | 109,707,840 |
| Size | 1.2 GB | 104.6 MB |
| Events in quadrant A | 11,215,511 | 697,075 |
| Events in quadrant B | 9,884,239 | 714,200 |
| Events in quadrant C | 8,735,406 | 704,526 |
| Events in quadrant D | 8,422,622 | 689,491 |
| Mode SS | |||
|---|---|---|---|
| Quadrant | BADHDUFLAG | Total packets | Discarded packets |
| A | 0 | 148 | 0 |
| B | 0 | 148 | 0 |
| C | 0 | 148 | 0 |
| D | 0 | 148 | 0 |
| Mode M0 | |||
|---|---|---|---|
| Quadrant | BADHDUFLAG | Total packets | Discarded packets |
| A | 0 | 38599 | 1 |
| B | 0 | 34663 | 0 |
| C | 0 | 31213 | 0 |
| D | 0 | 30313 | 0 |
| Quadrant | Total seconds | Saturated seconds | Saturation percentage |
|---|---|---|---|
| A | 7435 | 201 | 2.703430% |
| B | 7435 | 64 | 0.860794% |
| C | 7435 | 5 | 0.067249% |
| D | 7435 | 26 | 0.349697% |
Noise dominated data is calculated using 1-second bins in cleaned event files. If a bin has >2000 counts, and if more than 50% of those come from <1% of pixels, then it is considered to be noise-dominated and hence unusable.
| Quadrant | # 1 sec bins | Bins with >0 counts | Bins with >2000 counts | High rate bins dominated by noise | Noise dominated (total time) | Noise dominated (detector-on time) | Marked lightcurve |
|---|---|---|---|---|---|---|---|
| A | 7435 | 7435 | 1113 | 1113 | 14.97% | 14.97% | 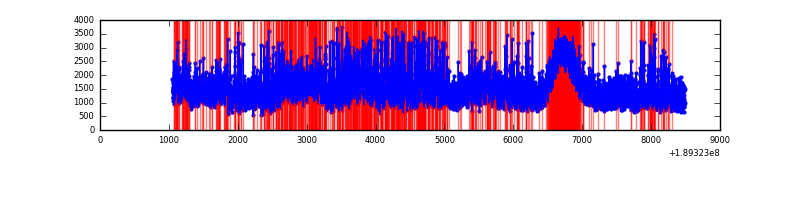 |
| B | 7435 | 7435 | 621 | 621 | 8.35% | 8.35% | 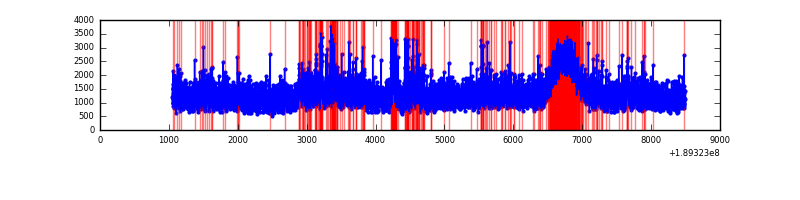 |
| C | 7435 | 7435 | 296 | 296 | 3.98% | 3.98% | 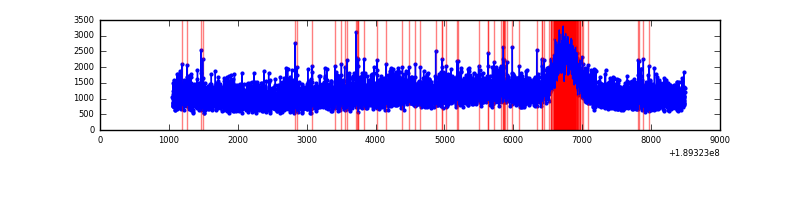 |
| D | 7435 | 7435 | 329 | 329 | 4.43% | 4.43% | 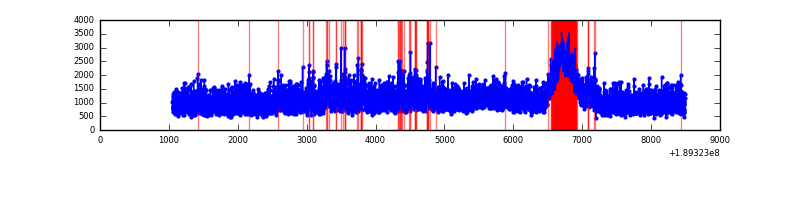 |
Top three noisy pixels from each quadrant. If the there are fewer than three noisy pixels in the level2.evt file, extra rows are filled as -1
| Pixel properties | Quadrant properties | ||||||
|---|---|---|---|---|---|---|---|
| Quadrant | DetID | PixID | Counts | Sigma | Mean | Median | Sigma |
| A | 15 | 127 | 2226766 | 3957.45 | 2322 | 2338 | 562.1 |
| A | 12 | 243 | 29764 | 48.79 | 2322 | 2338 | 562.1 |
| A | 15 | 233 | 20346 | 32.04 | 2322 | 2338 | 562.1 |
| B | 8 | 4 | 374070 | 647.45 | 2403 | 2417 | 574.0 |
| B | 12 | 52 | 100252 | 170.44 | 2403 | 2417 | 574.0 |
| B | 6 | 53 | 90763 | 153.9 | 2403 | 2417 | 574.0 |
| C | 15 | 241 | 282001 | 465.3 | 2147 | 2220 | 601.3 |
| C | 3 | 79 | 29786 | 45.84 | 2147 | 2220 | 601.3 |
| C | 3 | 111 | 28588 | 43.85 | 2147 | 2220 | 601.3 |
| D | 13 | 169 | 216932 | 324.69 | 2113 | 2193 | 661.4 |
| D | 9 | 53 | 116457 | 172.77 | 2113 | 2193 | 661.4 |
| D | 2 | 16 | 56413 | 81.98 | 2113 | 2193 | 661.4 |
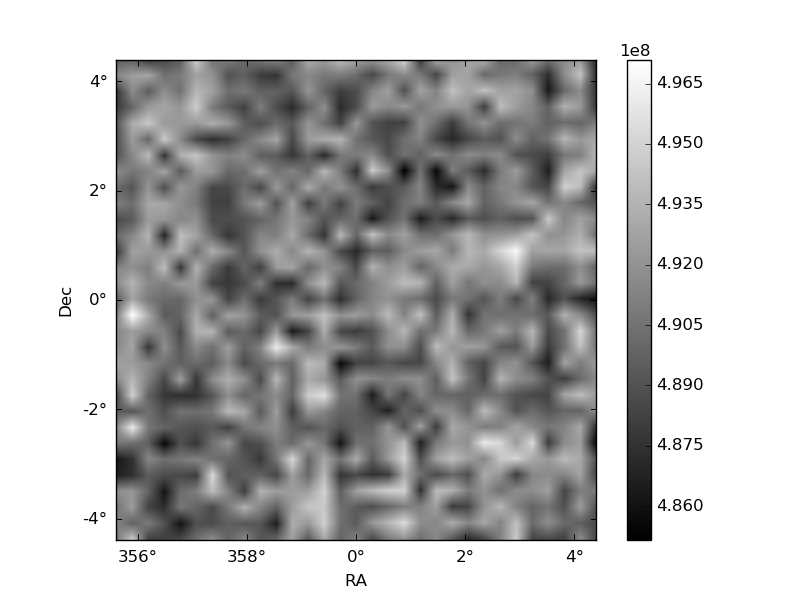
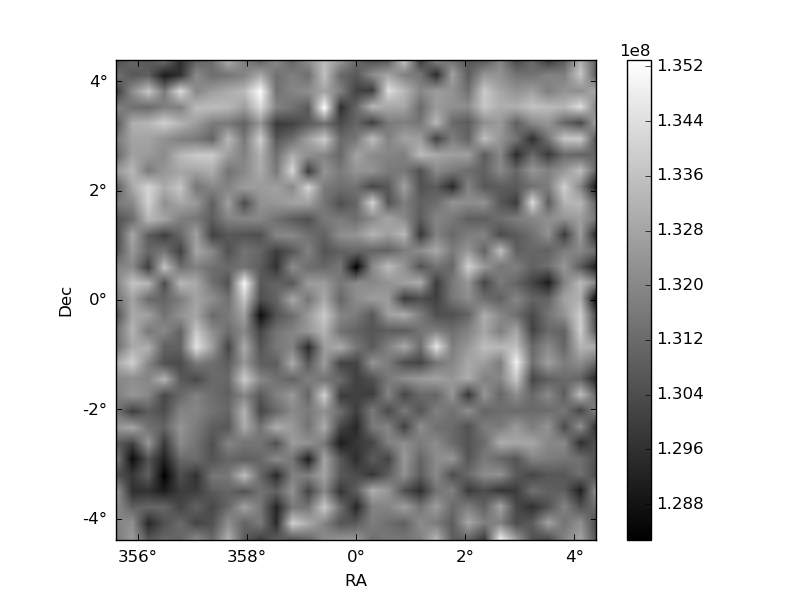
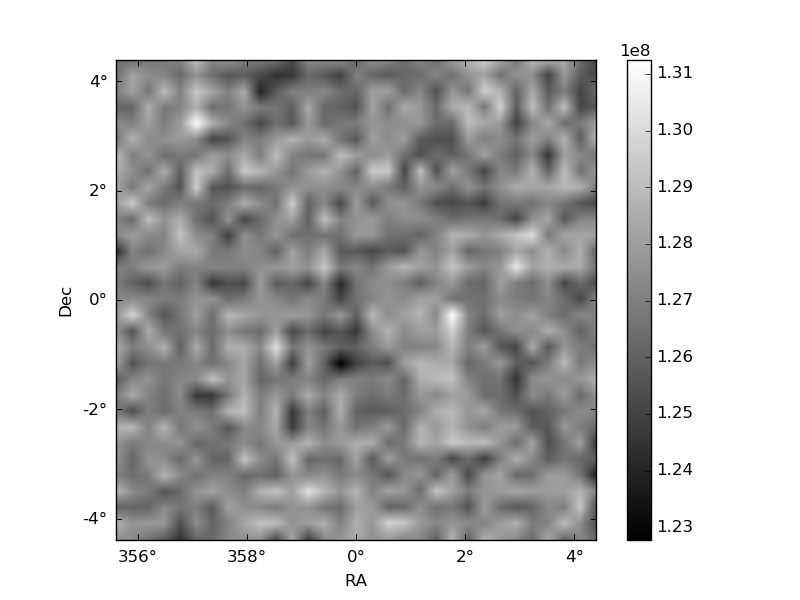
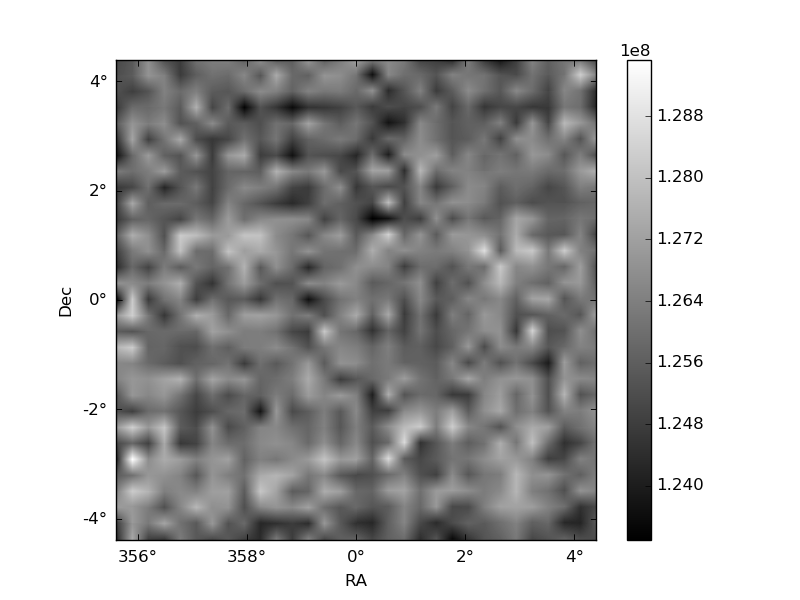
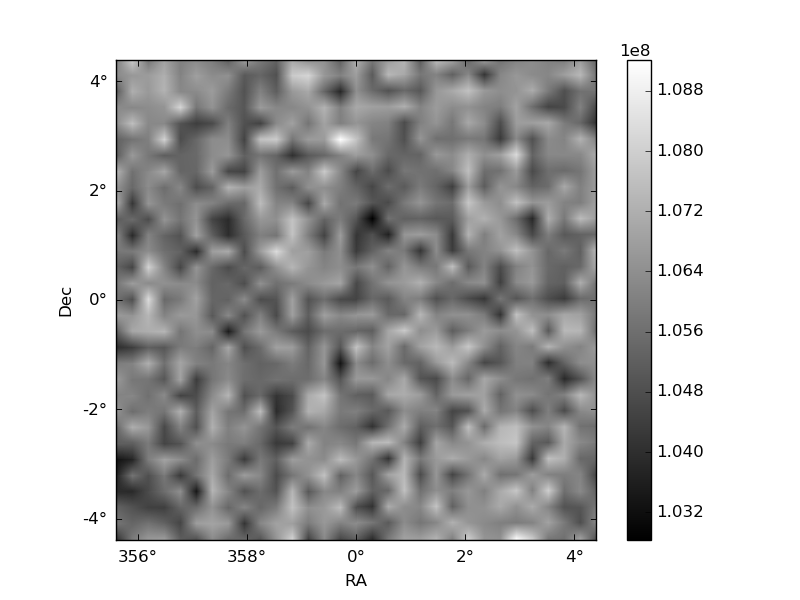
Histogram calculated using DETX and DETY for each event in the final _common_clean file
| Quadrant A | 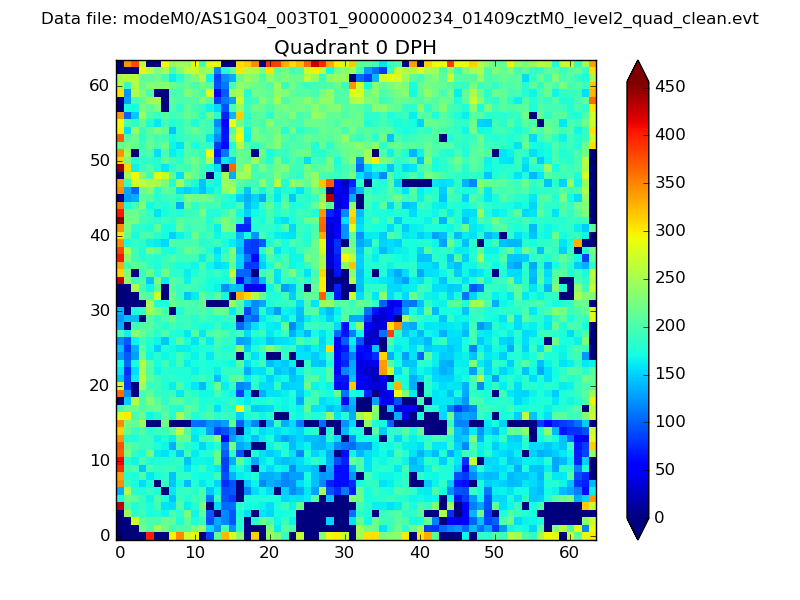 |
 |
Quadrant B |
|---|---|---|---|
| Quadrant D | 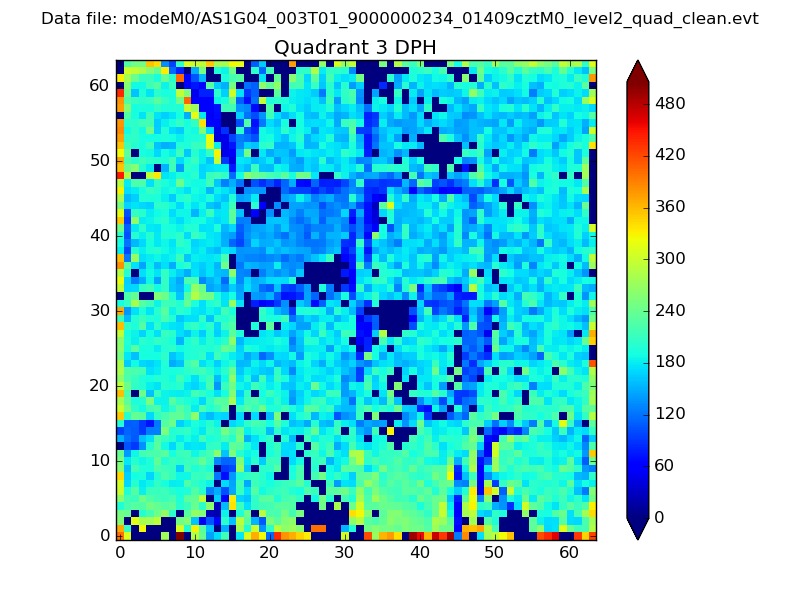 |
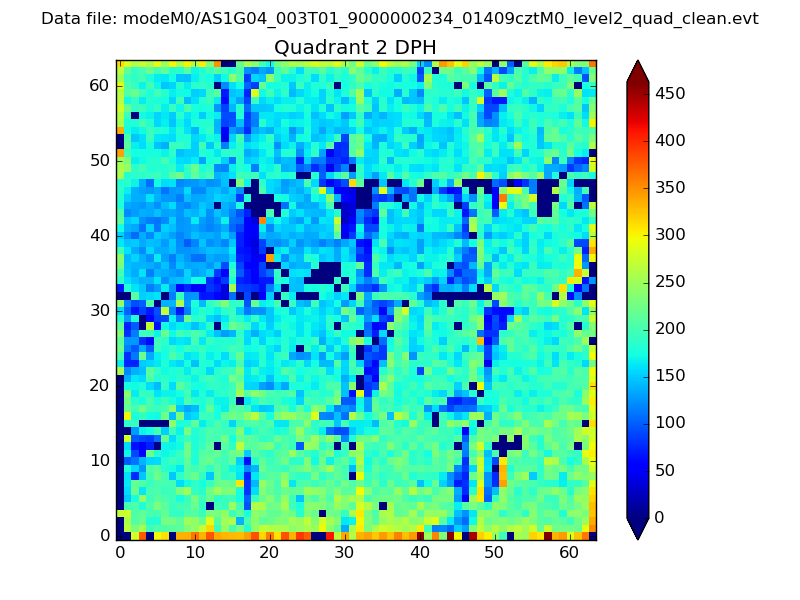 |
Quadrant C |
| Plot type | Count rate plots | Images |
|---|---|---|
| Comparison with Poisson distribution Blue bars denote a histogram of data divided into 1 sec bins. Red curve is a Poisson curve with rate = median count rate of data. |
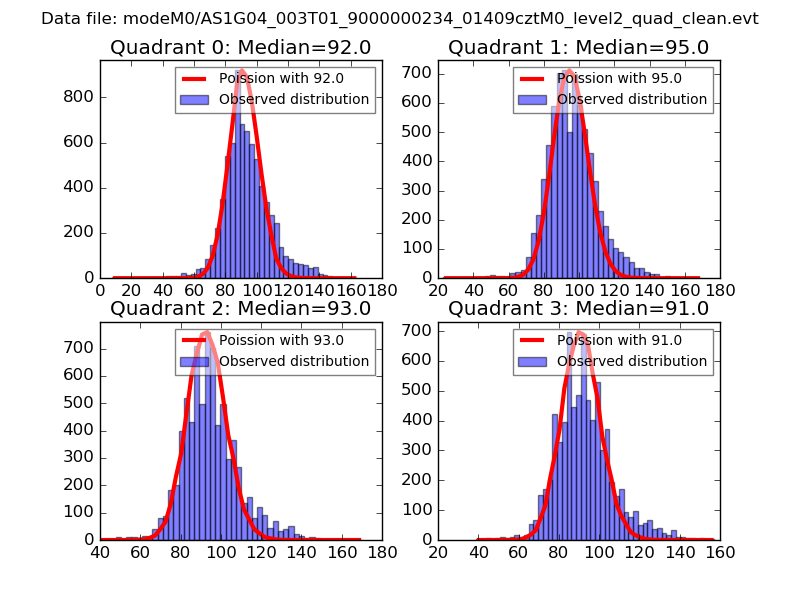 |
 |
| Quadrant-wise count rates Data is divided into 100 sec bins |
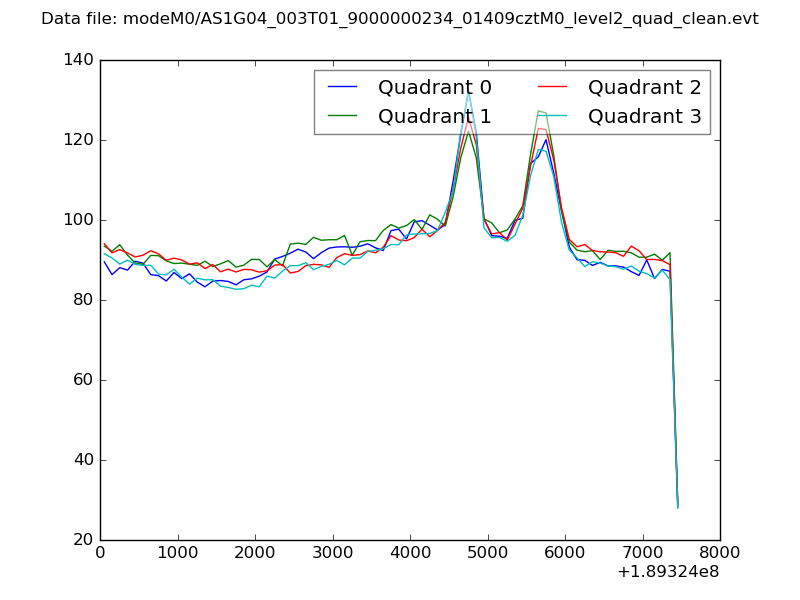 |
|
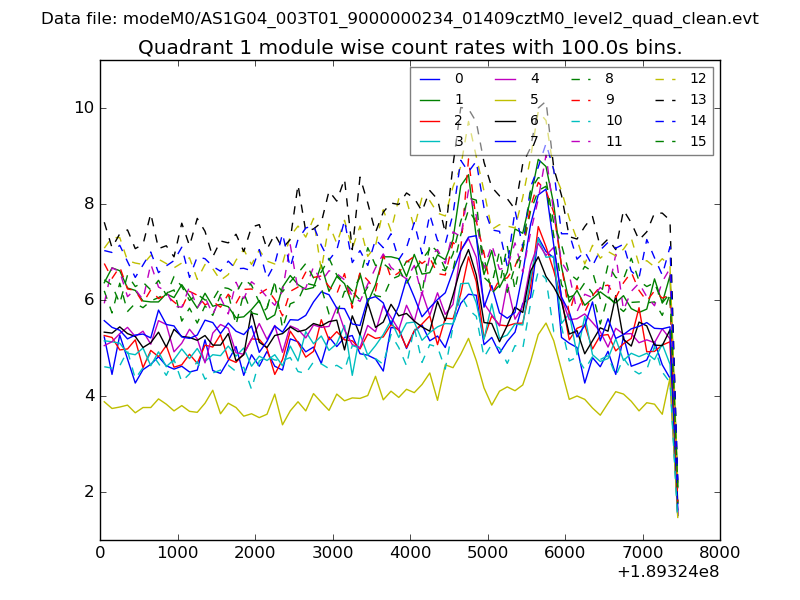
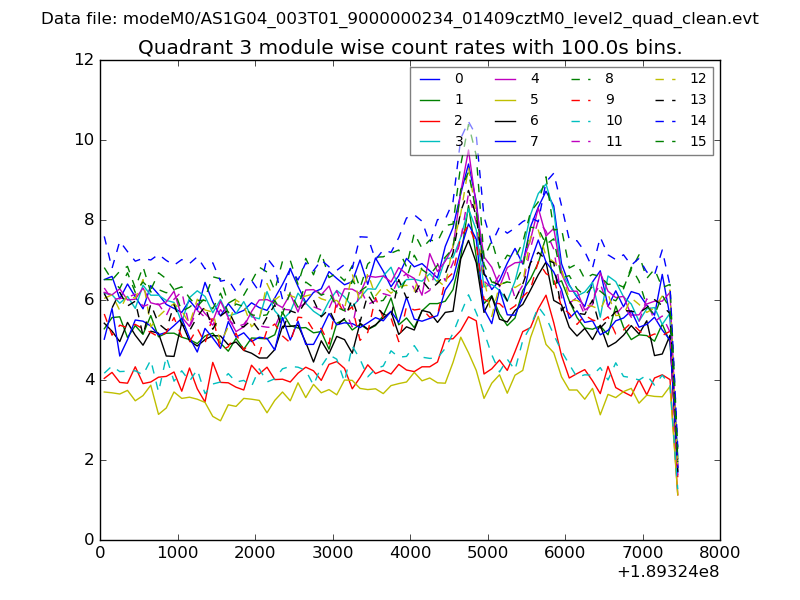
| Module-wise count rates for Quadrant A Data is divided into 100 sec bins |
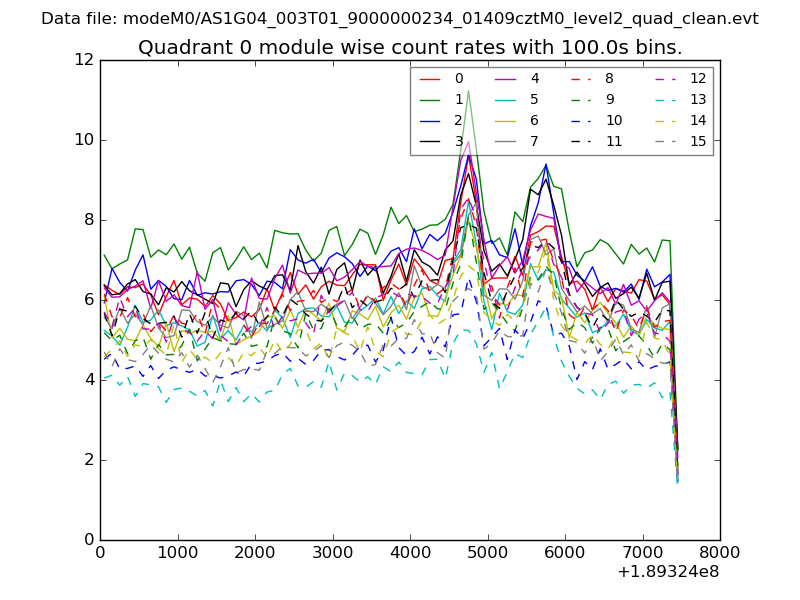 |
 |
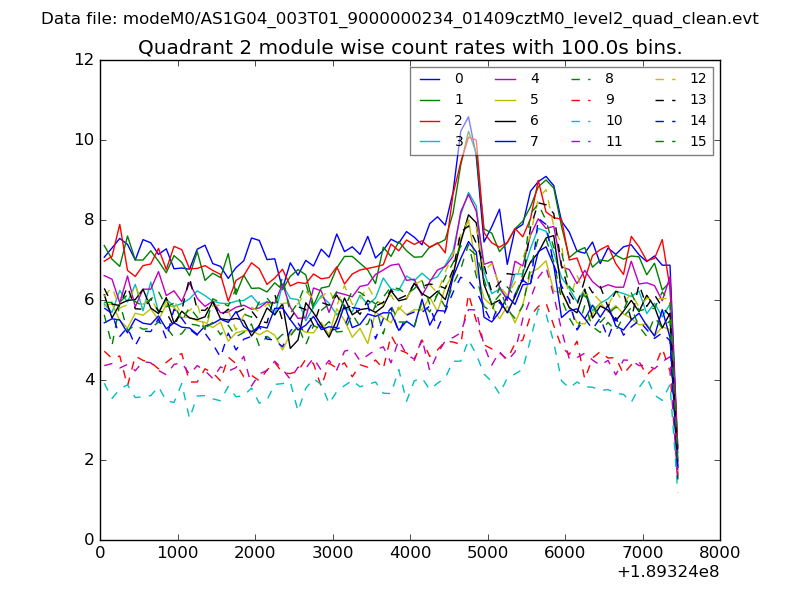
| Module-wise count rates for Quadrant B Data is divided into 100 sec bins |
 |
 |
| Module-wise count rates for Quadrant C Data is divided into 100 sec bins |
 |
 |
| Module-wise count rates for Quadrant D Data is divided into 100 sec bins |
 |
 |
| Parameter | Plot |
|---|---|
| CZT HV Monitor | 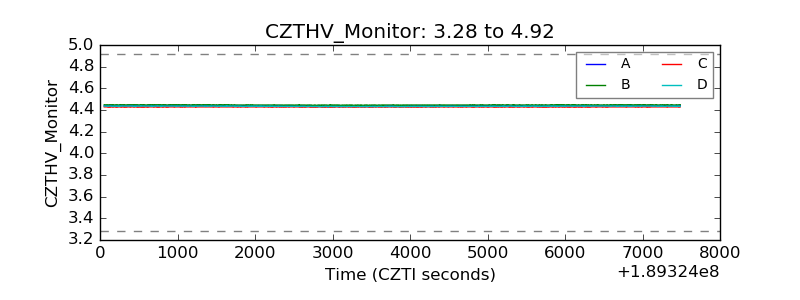 |
| D_VDD | 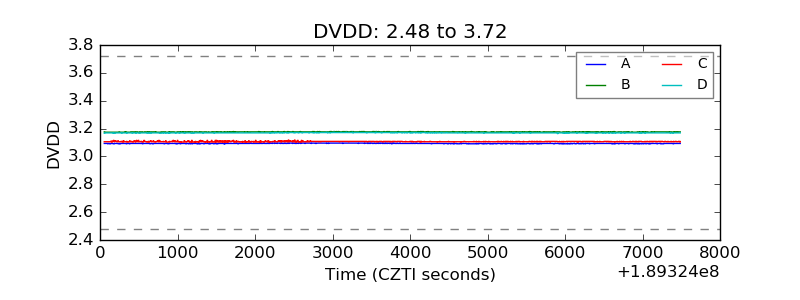 |
| Temperature 1 | 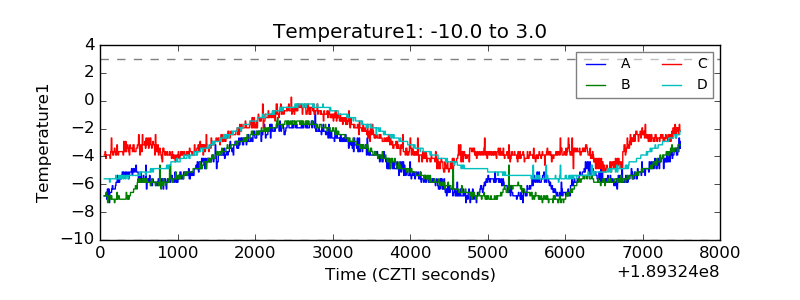 |
| Veto HV Monitor | 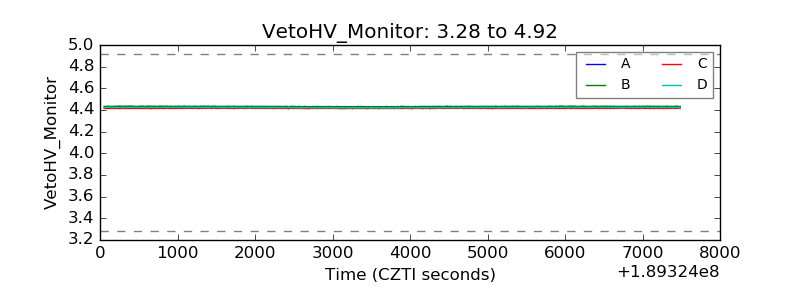 |
| Veto LLD | 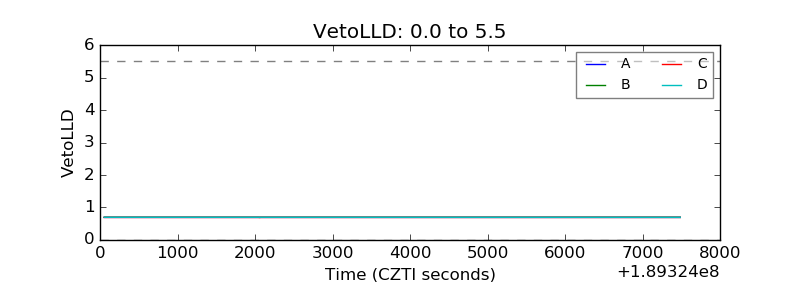 |
| Alpha Counter | 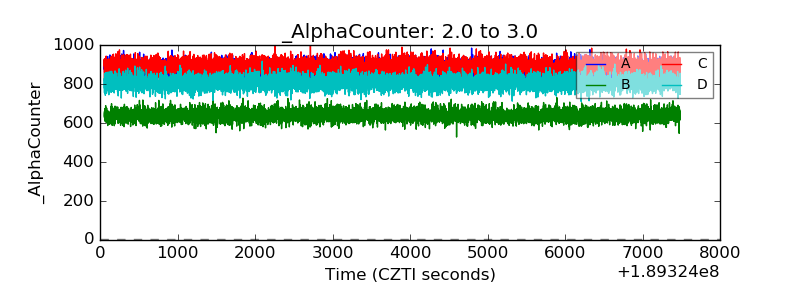 |
| _CPM_Rate | 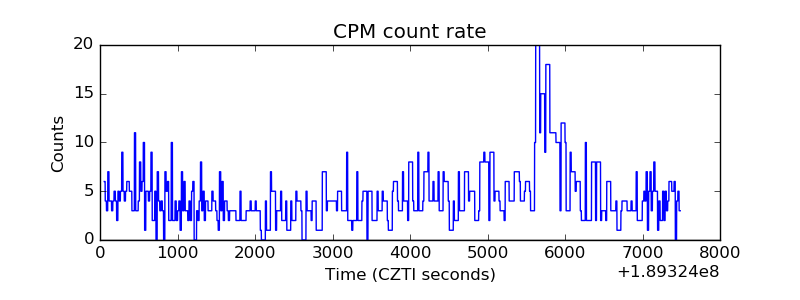 |
| CZT Counter | 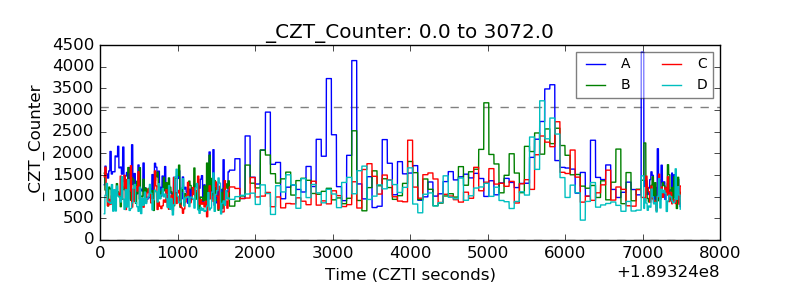 |
| +2.5 Volts monitor | 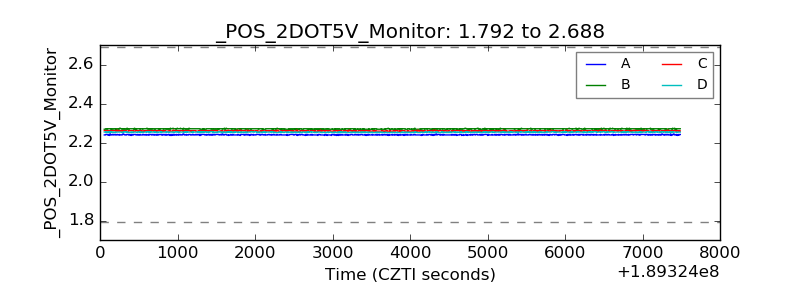 |
| +5 Volts monitor | 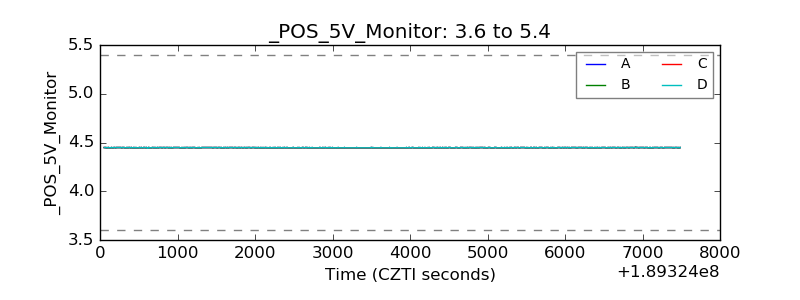 |
| _ROLL_ROT | 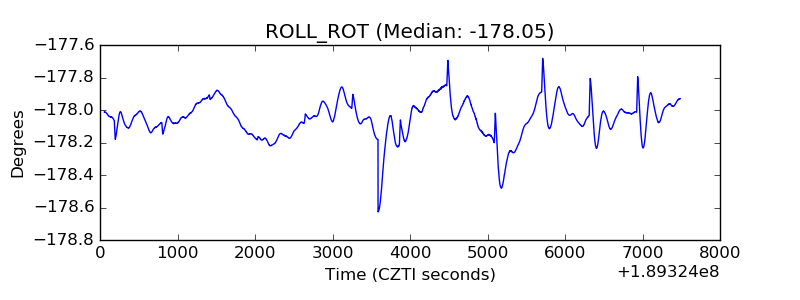 |
| _Roll_DEC | 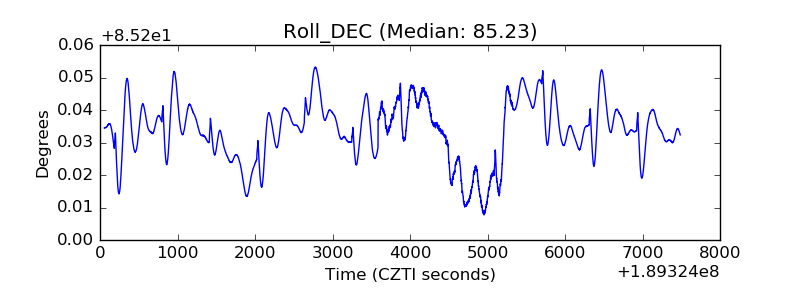 |
| _Roll_RA | 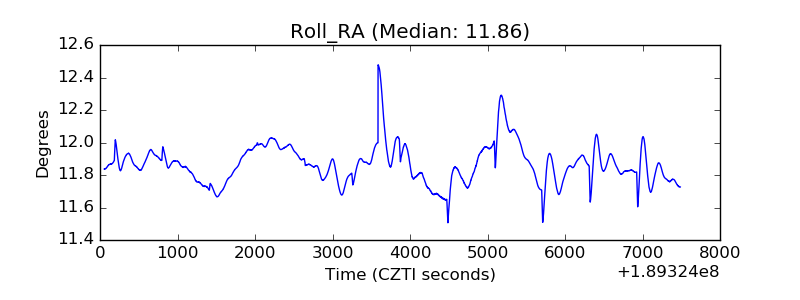 |
| Veto Counter | 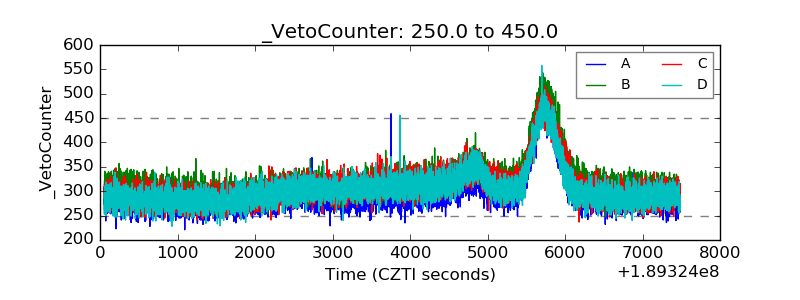 |