| Param | Original file | Final file |
|---|---|---|
| Filename | modeM0/AS1G04_003T01_9000000234_01410cztM0_level2.evt | modeM0/AS1G04_003T01_9000000234_01410cztM0_level2_quad_clean.evt |
| Size (bytes) | 1,215,077,760 | 106,286,400 |
| Size | 1.1 GB | 101.4 MB |
| Events in quadrant A | 9,984,175 | 682,687 |
| Events in quadrant B | 9,858,407 | 687,683 |
| Events in quadrant C | 8,377,251 | 677,989 |
| Events in quadrant D | 8,102,598 | 669,067 |
| Mode M9 | |||
|---|---|---|---|
| Quadrant | BADHDUFLAG | Total packets | Discarded packets |
| A | 0 | 4 | 0 |
| B | 0 | 4 | 0 |
| C | 0 | 4 | 0 |
| D | 0 | 4 | 0 |
| Mode SS | |||
|---|---|---|---|
| Quadrant | BADHDUFLAG | Total packets | Discarded packets |
| A | 0 | 146 | 0 |
| B | 0 | 146 | 0 |
| C | 0 | 146 | 0 |
| D | 0 | 146 | 0 |
| Mode M0 | |||
|---|---|---|---|
| Quadrant | BADHDUFLAG | Total packets | Discarded packets |
| A | 0 | 34739 | 2 |
| B | 0 | 34419 | 1 |
| C | 0 | 29975 | 1 |
| D | 0 | 29190 | 1 |
| Quadrant | Total seconds | Saturated seconds | Saturation percentage |
|---|---|---|---|
| A | 7209 | 140 | 1.942017% |
| B | 7209 | 122 | 1.692329% |
| C | 7209 | 21 | 0.291303% |
| D | 7209 | 63 | 0.873908% |
Noise dominated data is calculated using 1-second bins in cleaned event files. If a bin has >2000 counts, and if more than 50% of those come from <1% of pixels, then it is considered to be noise-dominated and hence unusable.
| Quadrant | # 1 sec bins | Bins with >0 counts | Bins with >2000 counts | High rate bins dominated by noise | Noise dominated (total time) | Noise dominated (detector-on time) | Marked lightcurve |
|---|---|---|---|---|---|---|---|
| A | 7524 | 7209 | 698 | 698 | 9.28% | 9.68% | 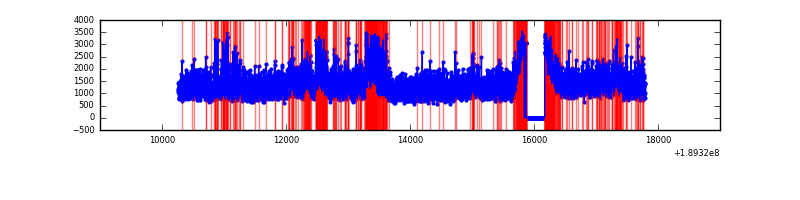 |
| B | 7524 | 7210 | 657 | 657 | 8.73% | 9.11% | 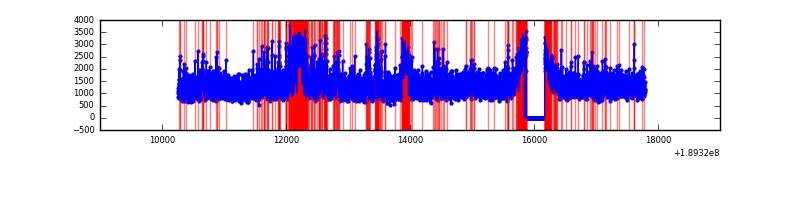 |
| C | 7524 | 7211 | 177 | 177 | 2.35% | 2.45% | 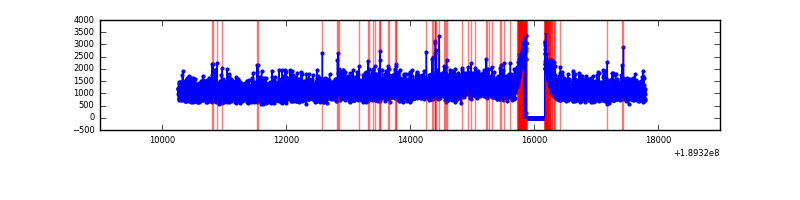 |
| D | 7524 | 7210 | 255 | 255 | 3.39% | 3.54% | 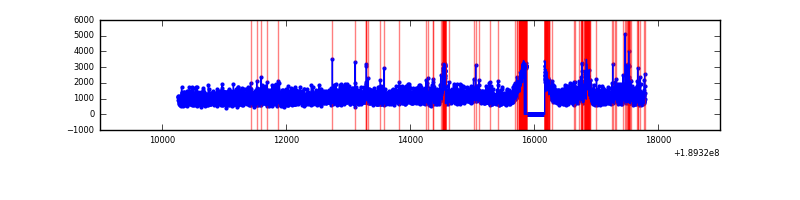 |
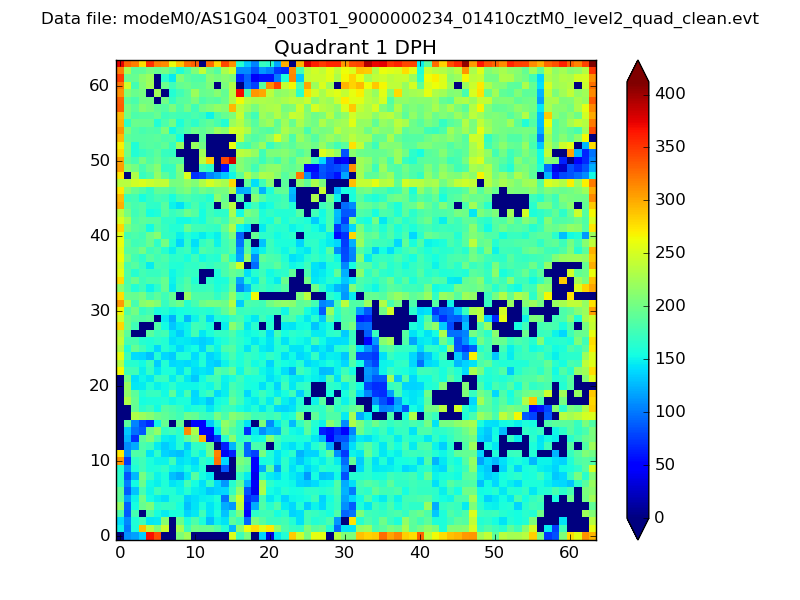
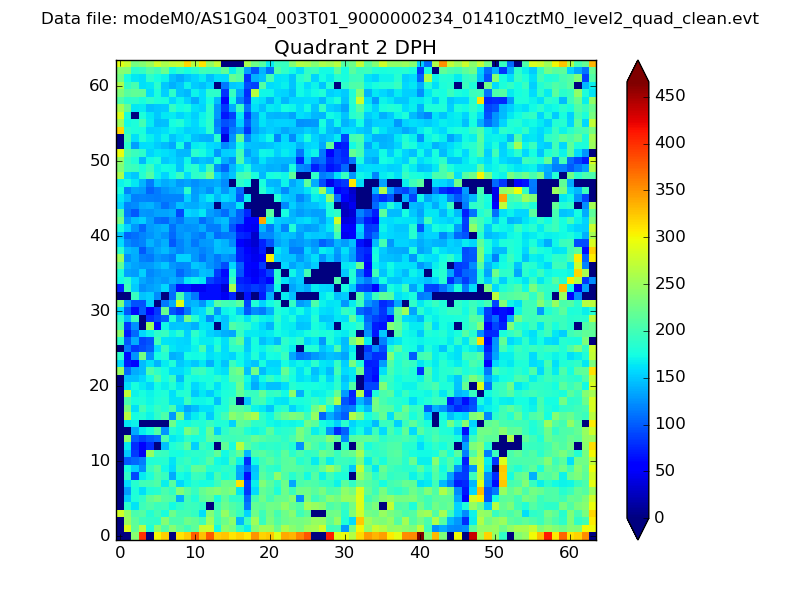
Top three noisy pixels from each quadrant. If the there are fewer than three noisy pixels in the level2.evt file, extra rows are filled as -1
| Pixel properties | Quadrant properties | ||||||
|---|---|---|---|---|---|---|---|
| Quadrant | DetID | PixID | Counts | Sigma | Mean | Median | Sigma |
| A | 15 | 127 | 1426327 | 2630.8 | 2219 | 2235 | 541.3 |
| A | 15 | 233 | 31615 | 54.28 | 2219 | 2235 | 541.3 |
| A | 13 | 235 | 9463 | 13.35 | 2219 | 2235 | 541.3 |
| B | 8 | 4 | 915233 | 1682.65 | 2285 | 2303 | 542.6 |
| B | 6 | 53 | 118622 | 214.39 | 2285 | 2303 | 542.6 |
| B | 12 | 52 | 58859 | 104.24 | 2285 | 2303 | 542.6 |
| C | 15 | 241 | 271144 | 467.55 | 2052 | 2120 | 575.4 |
| C | 3 | 79 | 34263 | 55.86 | 2052 | 2120 | 575.4 |
| C | 3 | 111 | 27003 | 43.24 | 2052 | 2120 | 575.4 |
| D | 9 | 53 | 277170 | 447.48 | 2029 | 2097 | 614.7 |
| D | 13 | 205 | 78441 | 124.19 | 2029 | 2097 | 614.7 |
| D | 13 | 169 | 66038 | 104.02 | 2029 | 2097 | 614.7 |
Histogram calculated using DETX and DETY for each event in the final _common_clean file
| Quadrant A | 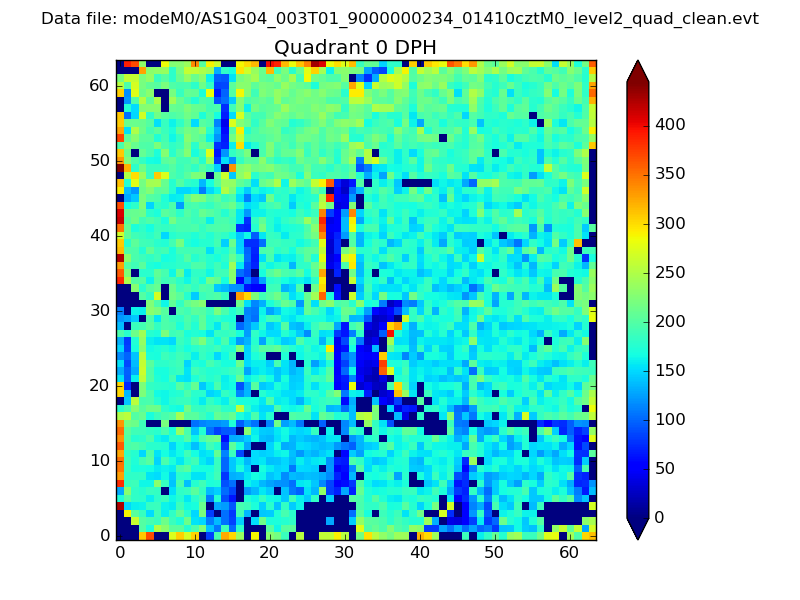 |
 |
Quadrant B |
|---|---|---|---|
| Quadrant D | 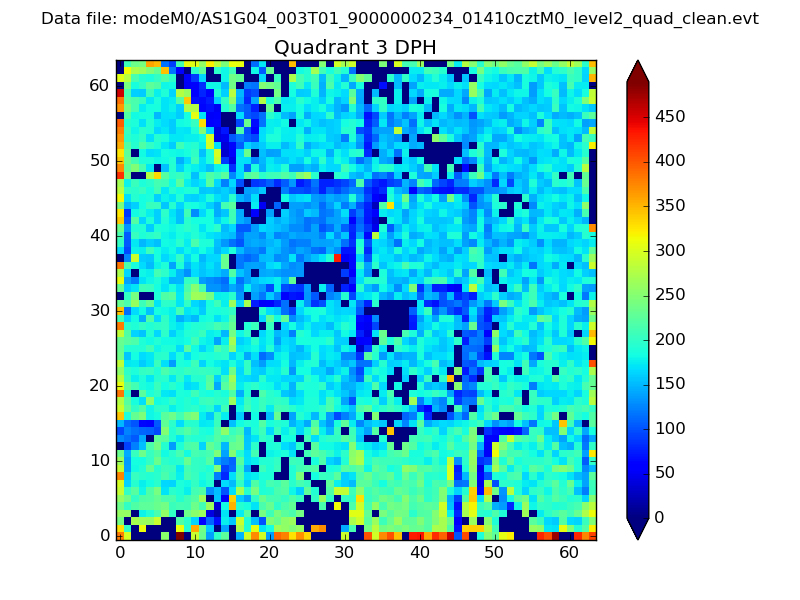 |
 |
Quadrant C |
| Plot type | Count rate plots | Images |
|---|---|---|
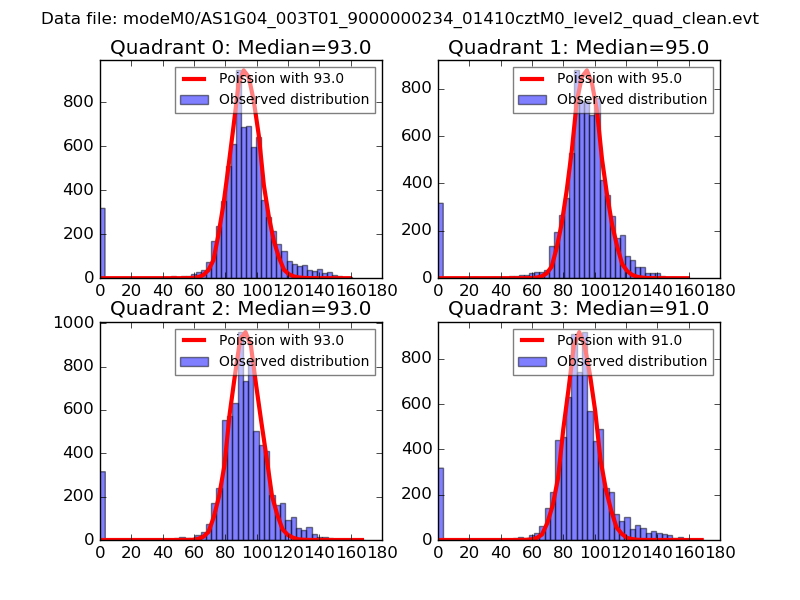
| Comparison with Poisson distribution Blue bars denote a histogram of data divided into 1 sec bins. Red curve is a Poisson curve with rate = median count rate of data. |
 |
 |
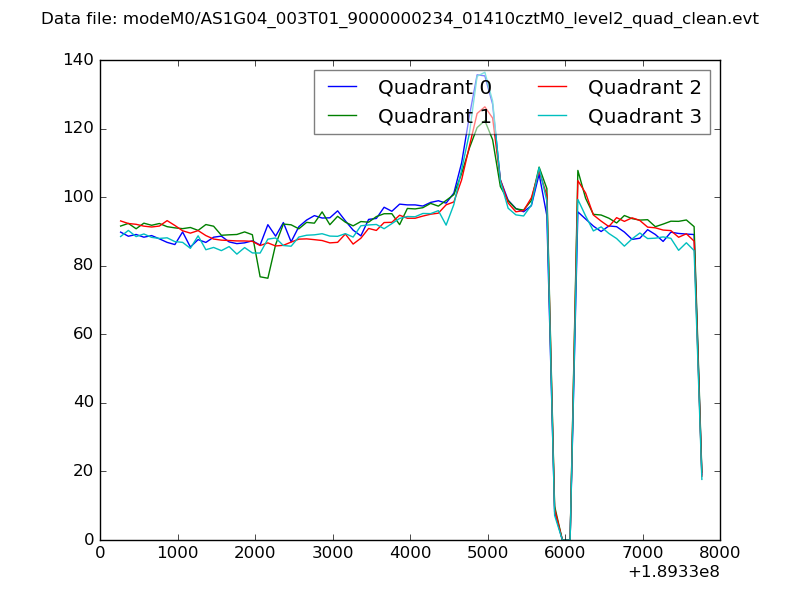
| Quadrant-wise count rates Data is divided into 100 sec bins |
 |
|
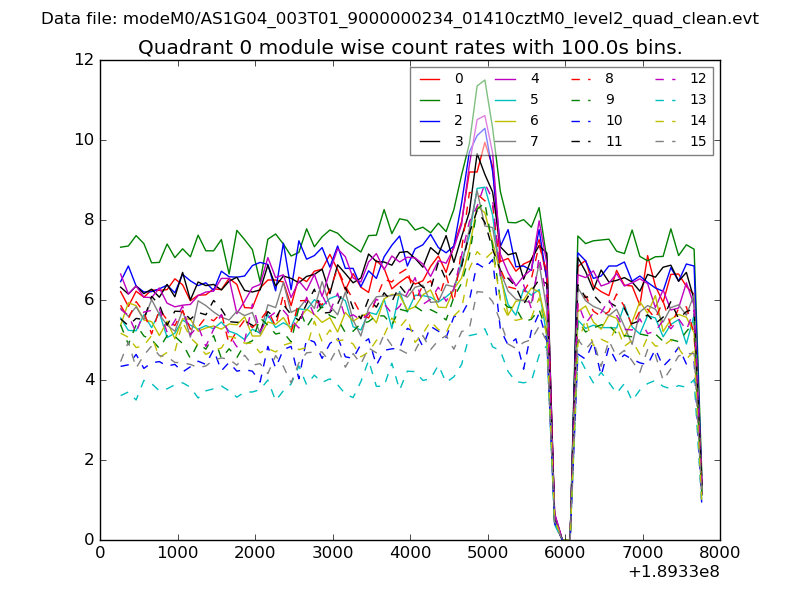
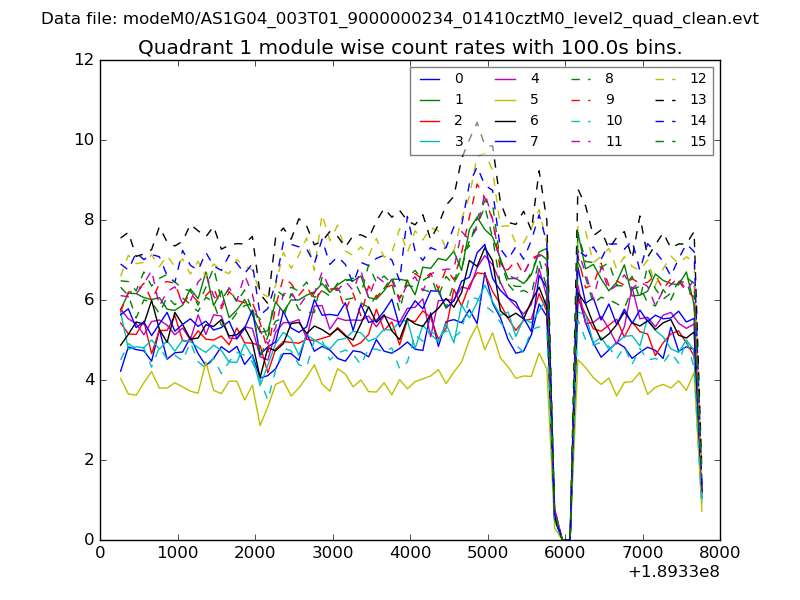
| Module-wise count rates for Quadrant A Data is divided into 100 sec bins |
 |
 |
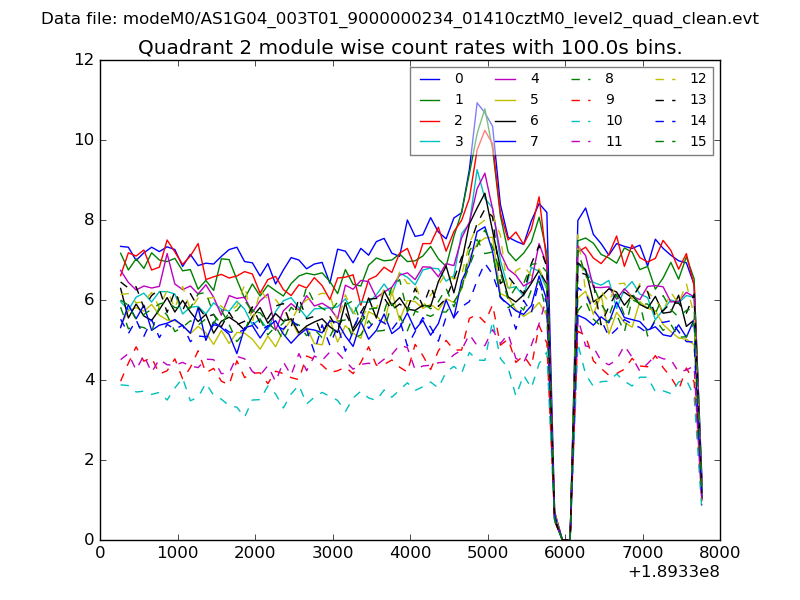
| Module-wise count rates for Quadrant B Data is divided into 100 sec bins |
 |
 |
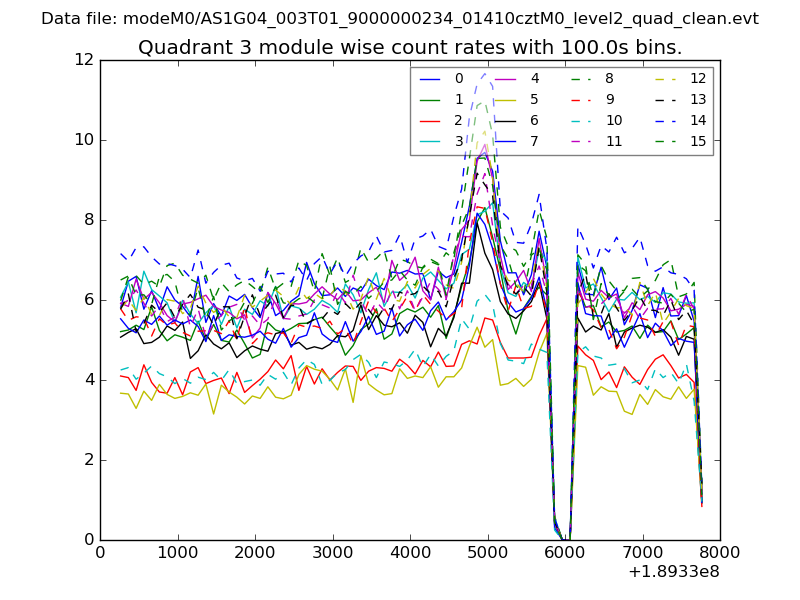
| Module-wise count rates for Quadrant C Data is divided into 100 sec bins |
 |
 |
| Module-wise count rates for Quadrant D Data is divided into 100 sec bins |
 |
 |
| Parameter | Plot |
|---|---|
| CZT HV Monitor | 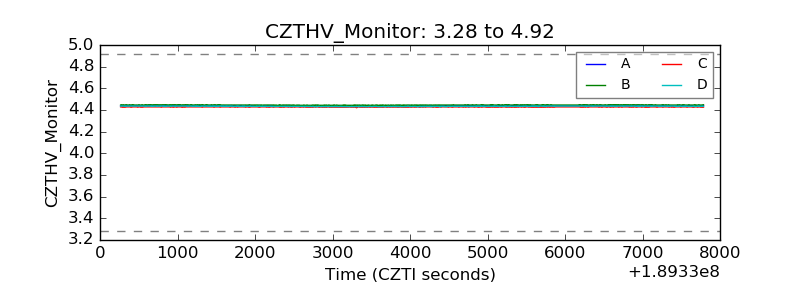 |
| D_VDD | 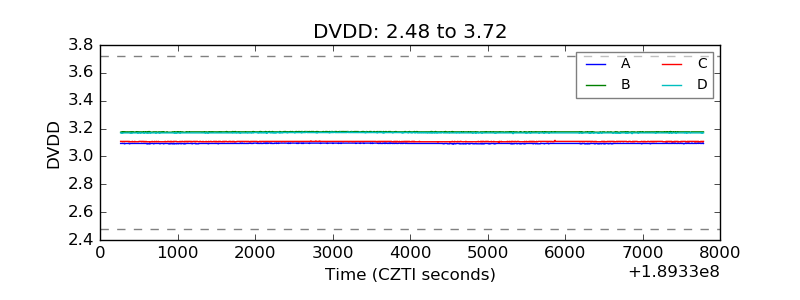 |
| Temperature 1 | 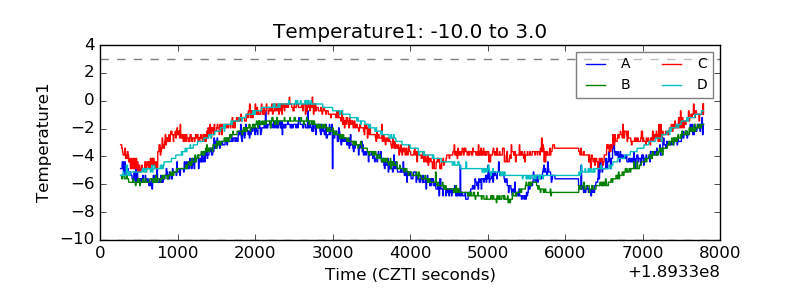 |
| Veto HV Monitor | 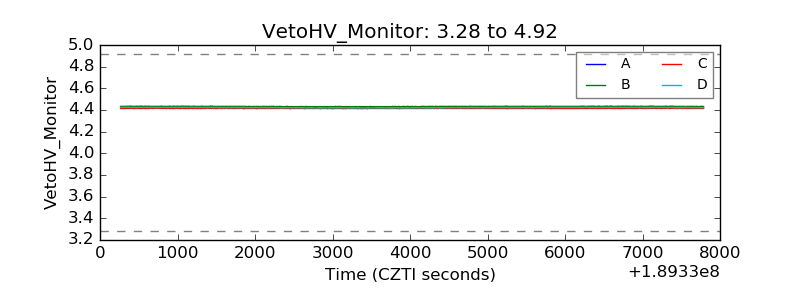 |
| Veto LLD | 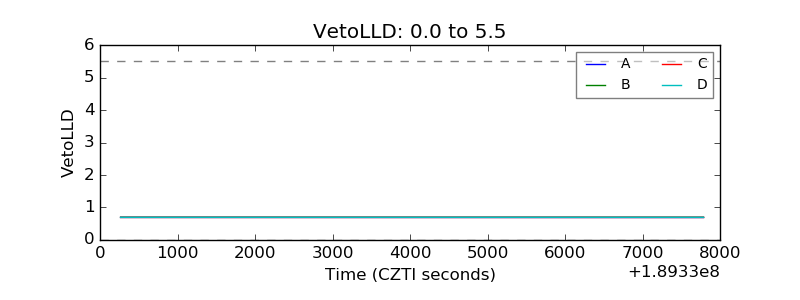 |
| Alpha Counter | 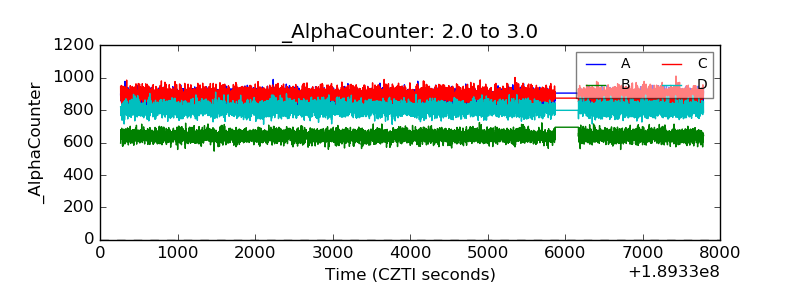 |
| _CPM_Rate | 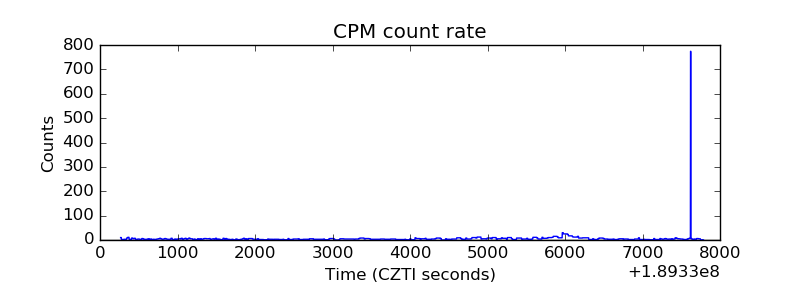 |
| CZT Counter | 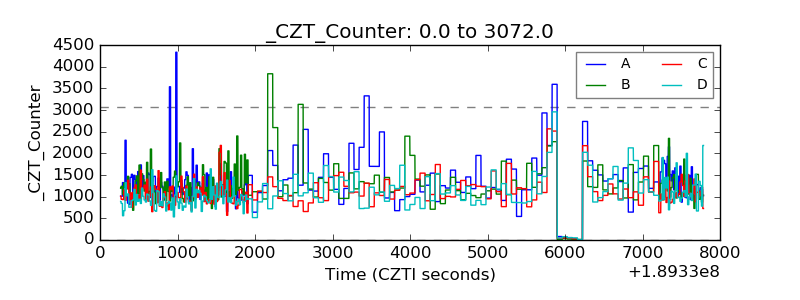 |
| +2.5 Volts monitor | 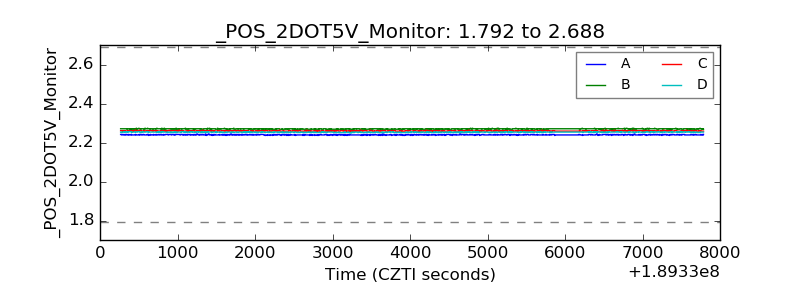 |
| +5 Volts monitor | 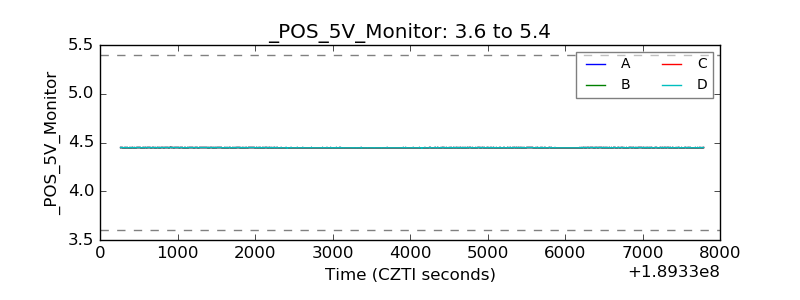 |
| _ROLL_ROT | 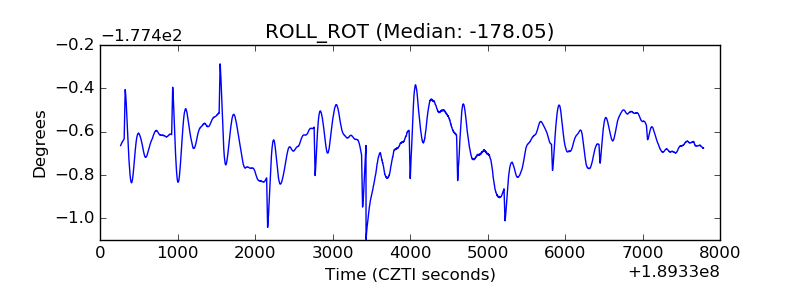 |
| _Roll_DEC | 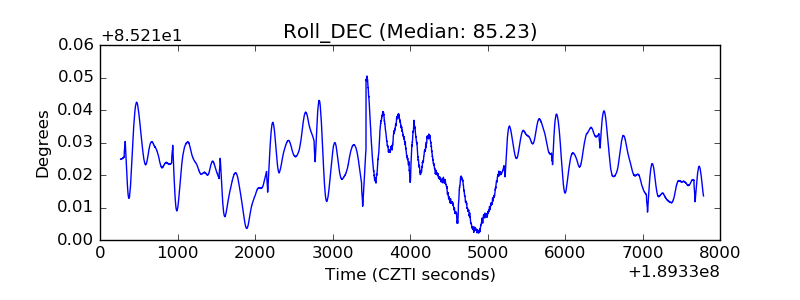 |
| _Roll_RA | 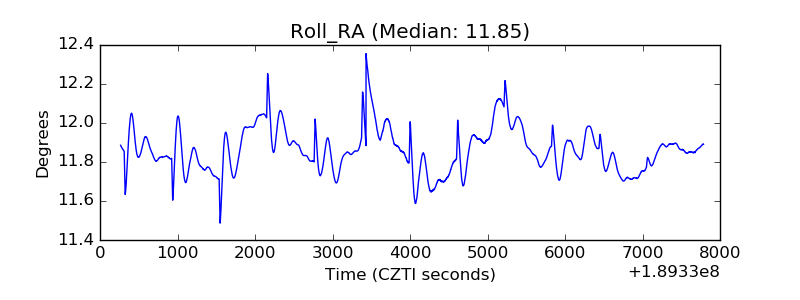 |
| Veto Counter | 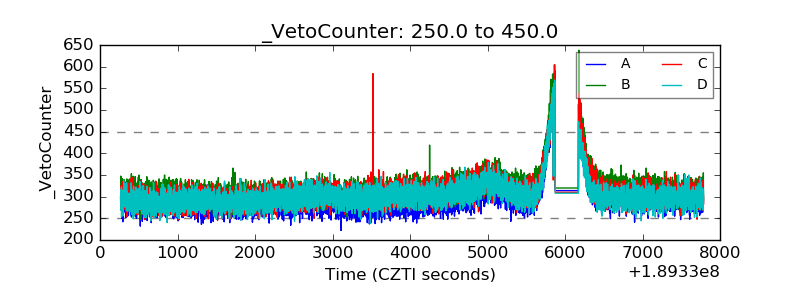 |