| Param | Original file | Final file |
|---|---|---|
| Filename | modeM0/AS1G04_003T01_9000000234_01411cztM0_level2.evt | modeM0/AS1G04_003T01_9000000234_01411cztM0_level2_quad_clean.evt |
| Size (bytes) | 1,075,452,480 | 91,514,880 |
| Size | 1.0 GB | 87.3 MB |
| Events in quadrant A | 8,673,023 | 589,842 |
| Events in quadrant B | 8,813,267 | 588,623 |
| Events in quadrant C | 7,671,170 | 578,315 |
| Events in quadrant D | 6,997,120 | 576,337 |
| Mode M9 | |||
|---|---|---|---|
| Quadrant | BADHDUFLAG | Total packets | Discarded packets |
| A | 0 | 5 | 0 |
| B | 0 | 5 | 0 |
| C | 0 | 5 | 0 |
| D | 0 | 5 | 0 |
| Mode SS | |||
|---|---|---|---|
| Quadrant | BADHDUFLAG | Total packets | Discarded packets |
| A | 0 | 128 | 0 |
| B | 0 | 128 | 0 |
| C | 0 | 128 | 0 |
| D | 0 | 128 | 0 |
| Mode M0 | |||
|---|---|---|---|
| Quadrant | BADHDUFLAG | Total packets | Discarded packets |
| A | 0 | 30157 | 2 |
| B | 0 | 30637 | 1 |
| C | 0 | 27255 | 1 |
| D | 0 | 25246 | 1 |
| Quadrant | Total seconds | Saturated seconds | Saturation percentage |
|---|---|---|---|
| A | 6276 | 69 | 1.099426% |
| B | 6276 | 199 | 3.170809% |
| C | 6276 | 151 | 2.405991% |
| D | 6276 | 37 | 0.589547% |
Noise dominated data is calculated using 1-second bins in cleaned event files. If a bin has >2000 counts, and if more than 50% of those come from <1% of pixels, then it is considered to be noise-dominated and hence unusable.
| Quadrant | # 1 sec bins | Bins with >0 counts | Bins with >2000 counts | High rate bins dominated by noise | Noise dominated (total time) | Noise dominated (detector-on time) | Marked lightcurve |
|---|---|---|---|---|---|---|---|
| A | 6806 | 6276 | 497 | 497 | 7.30% | 7.92% | 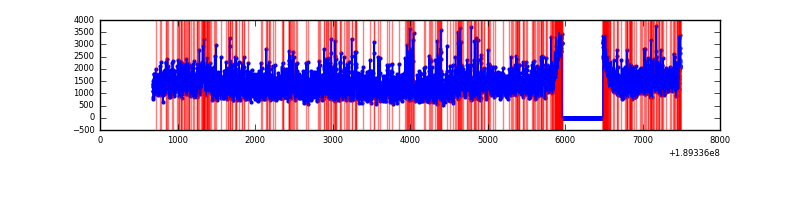 |
| B | 6806 | 6276 | 662 | 662 | 9.73% | 10.55% | 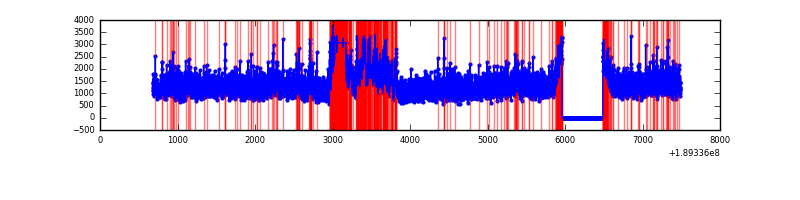 |
| C | 6806 | 6277 | 295 | 295 | 4.33% | 4.70% | 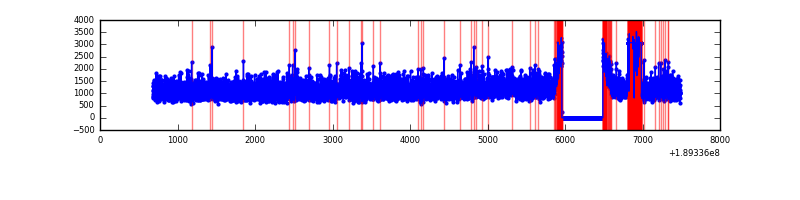 |
| D | 6806 | 6277 | 198 | 198 | 2.91% | 3.15% | 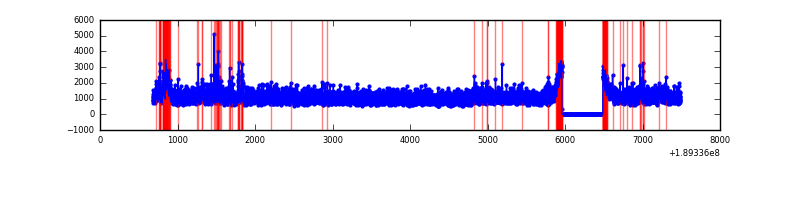 |
Top three noisy pixels from each quadrant. If the there are fewer than three noisy pixels in the level2.evt file, extra rows are filled as -1
| Pixel properties | Quadrant properties | ||||||
|---|---|---|---|---|---|---|---|
| Quadrant | DetID | PixID | Counts | Sigma | Mean | Median | Sigma |
| A | 15 | 127 | 1178781 | 2521.01 | 1924 | 1933 | 466.8 |
| A | 4 | 32 | 84745 | 177.4 | 1924 | 1933 | 466.8 |
| A | 15 | 233 | 9503 | 16.22 | 1924 | 1933 | 466.8 |
| B | 8 | 4 | 1039582 | 2224.88 | 1962 | 1971 | 466.4 |
| B | 12 | 52 | 99387 | 208.88 | 1962 | 1971 | 466.4 |
| B | 6 | 53 | 94514 | 198.43 | 1962 | 1971 | 466.4 |
| C | 2 | 53 | 407188 | 813.55 | 1782 | 1840 | 498.2 |
| C | 15 | 241 | 244003 | 486.03 | 1782 | 1840 | 498.2 |
| C | 3 | 79 | 37092 | 70.75 | 1782 | 1840 | 498.2 |
| D | 9 | 53 | 187770 | 349.95 | 1764 | 1818 | 531.4 |
| D | 13 | 205 | 84669 | 155.92 | 1764 | 1818 | 531.4 |
| D | 2 | 88 | 78532 | 144.37 | 1764 | 1818 | 531.4 |
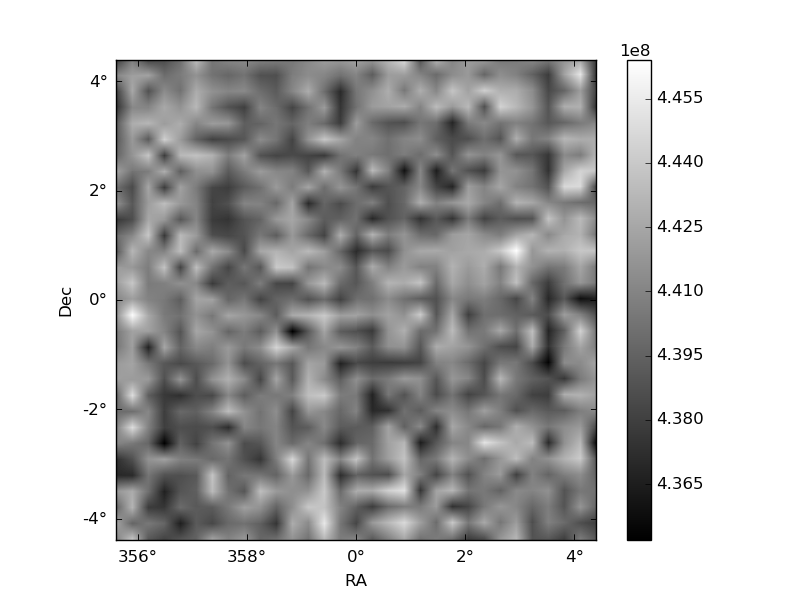
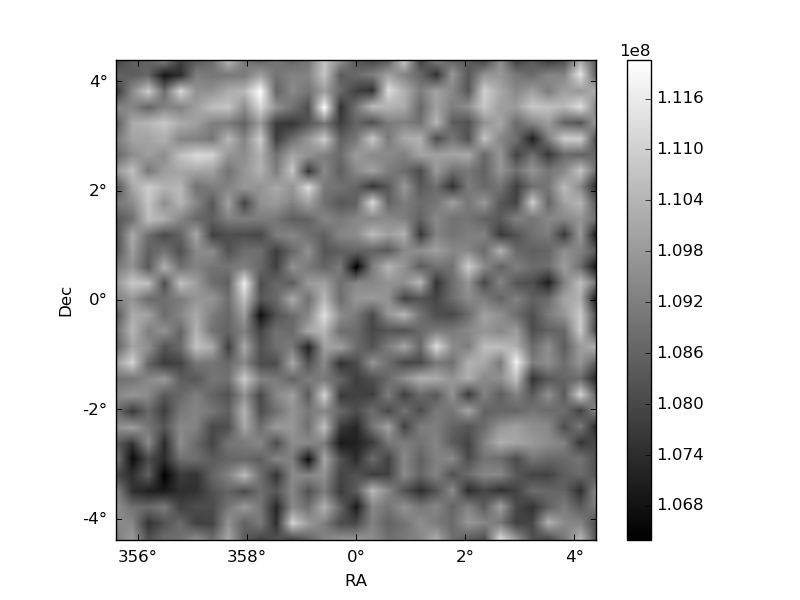
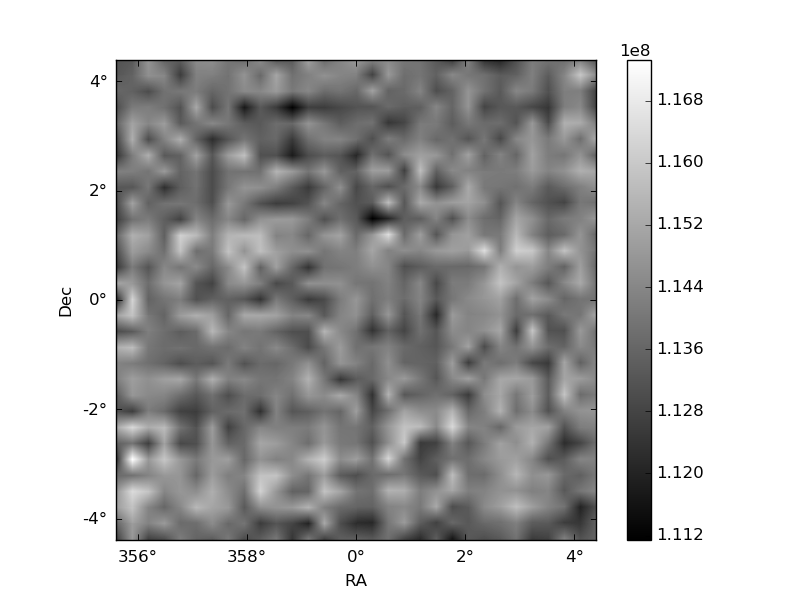
Histogram calculated using DETX and DETY for each event in the final _common_clean file
| Quadrant A | 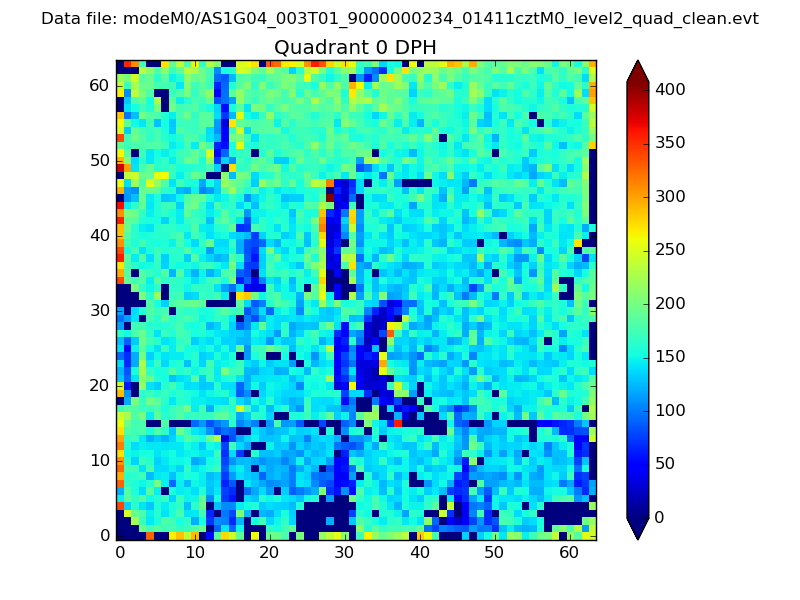 |
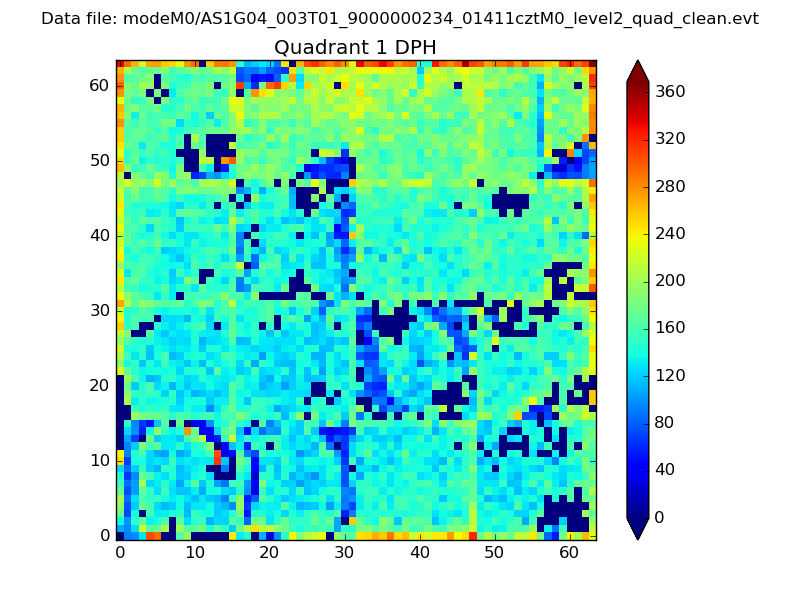 |
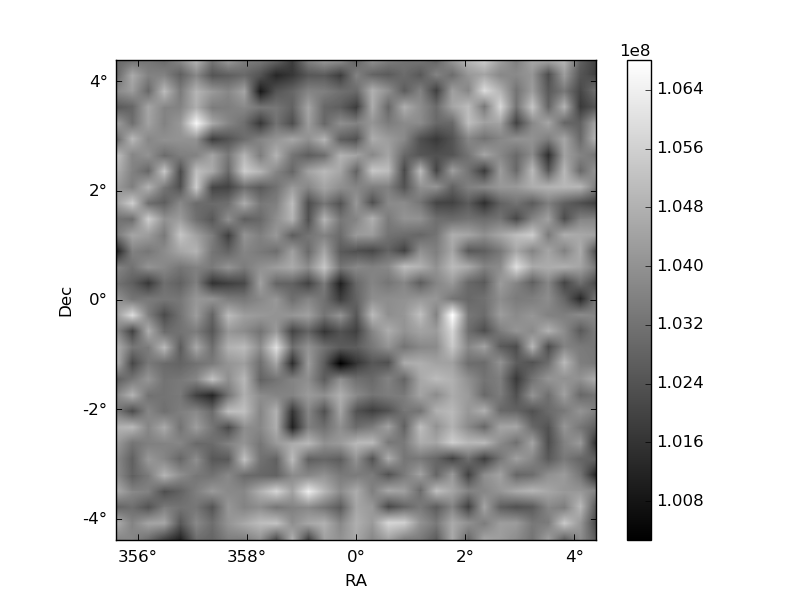
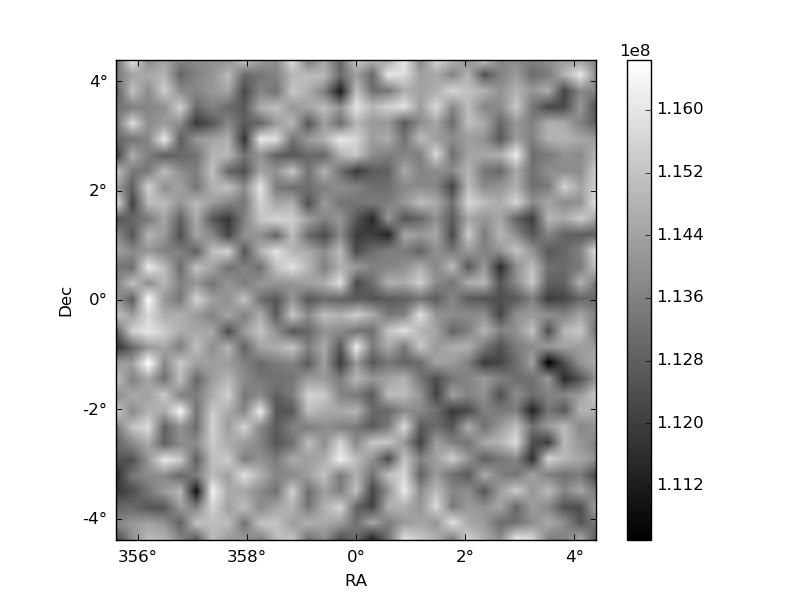
Quadrant B |
|---|---|---|---|
| Quadrant D | 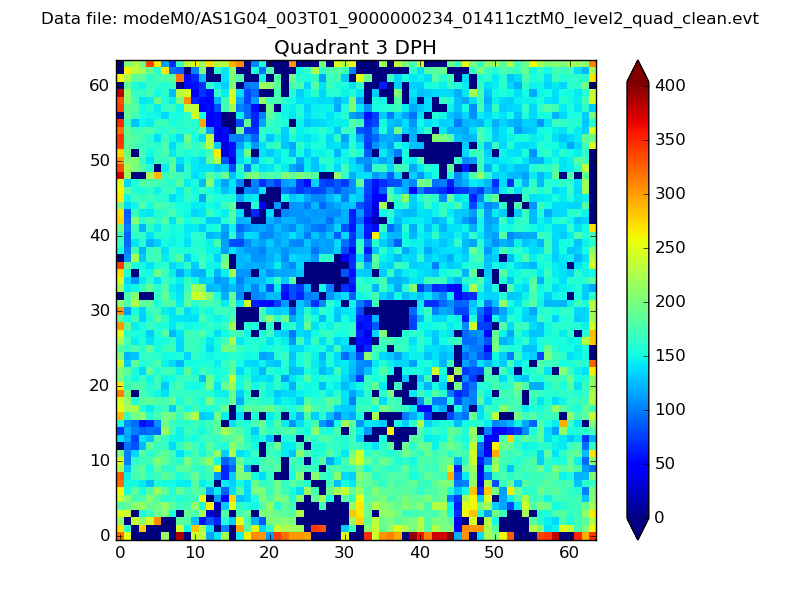 |
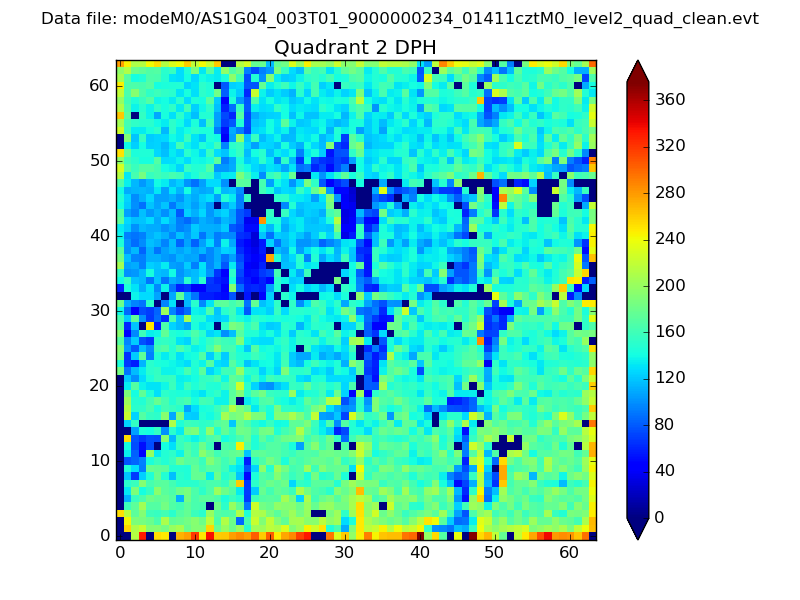 |
Quadrant C |
| Plot type | Count rate plots | Images |
|---|---|---|
| Comparison with Poisson distribution Blue bars denote a histogram of data divided into 1 sec bins. Red curve is a Poisson curve with rate = median count rate of data. |
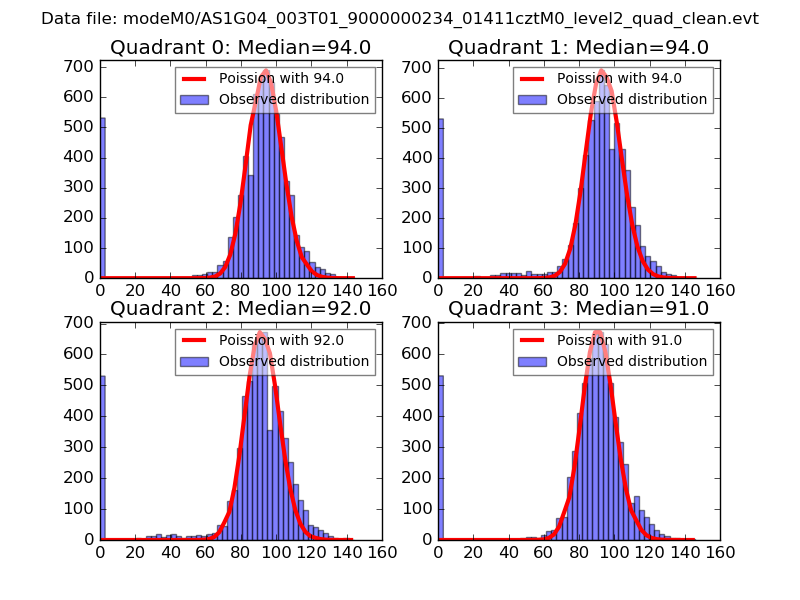 |
 |
| Quadrant-wise count rates Data is divided into 100 sec bins |
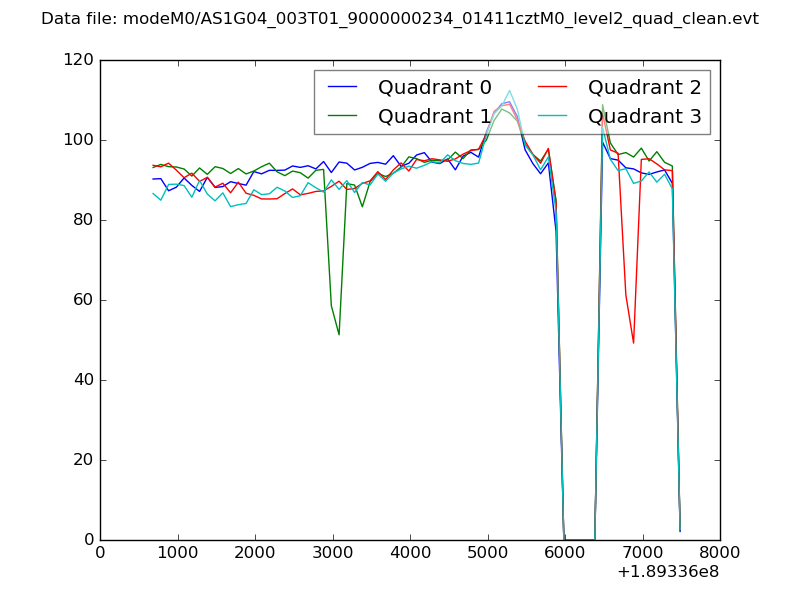 |
|
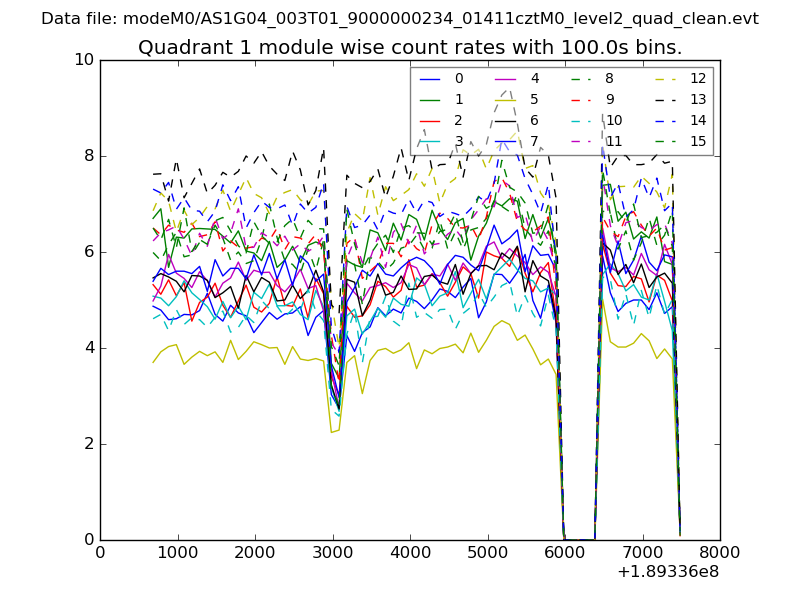
| Module-wise count rates for Quadrant A Data is divided into 100 sec bins |
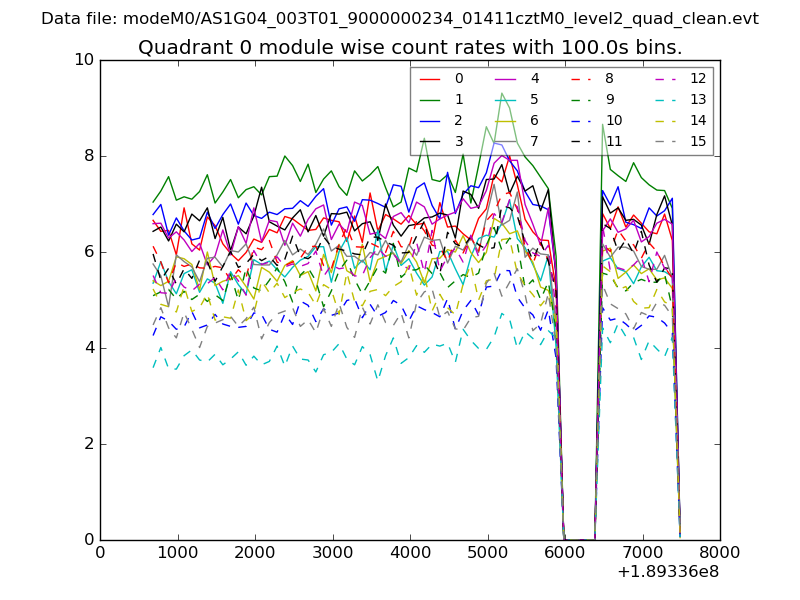 |
 |
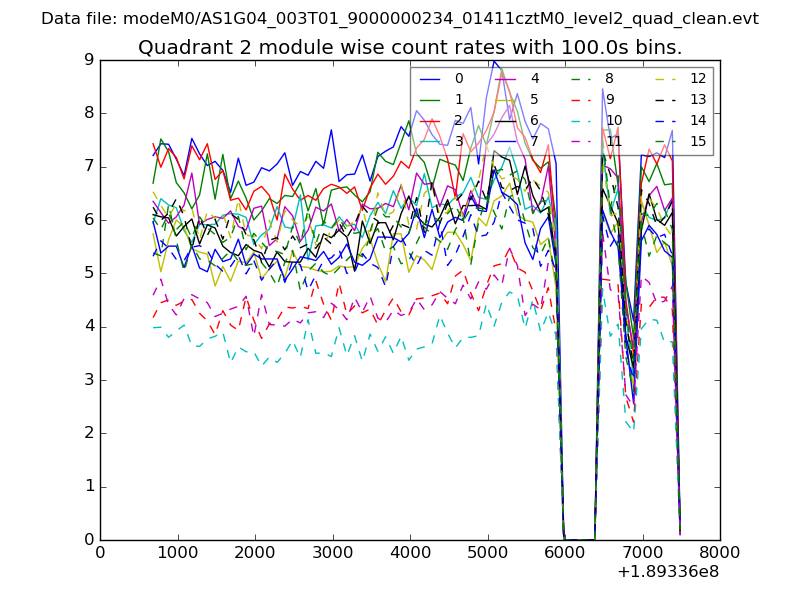
| Module-wise count rates for Quadrant B Data is divided into 100 sec bins |
 |
 |
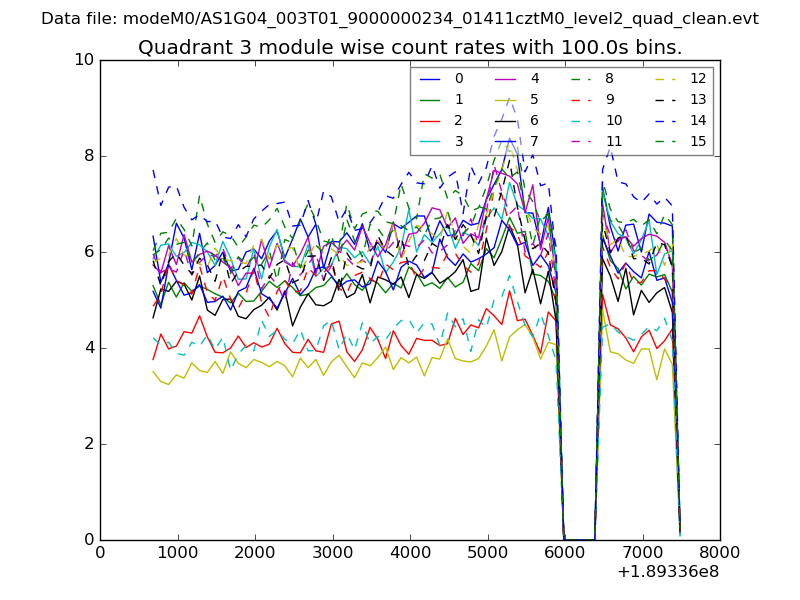
| Module-wise count rates for Quadrant C Data is divided into 100 sec bins |
 |
 |
| Module-wise count rates for Quadrant D Data is divided into 100 sec bins |
 |
 |
| Parameter | Plot |
|---|---|
| CZT HV Monitor | 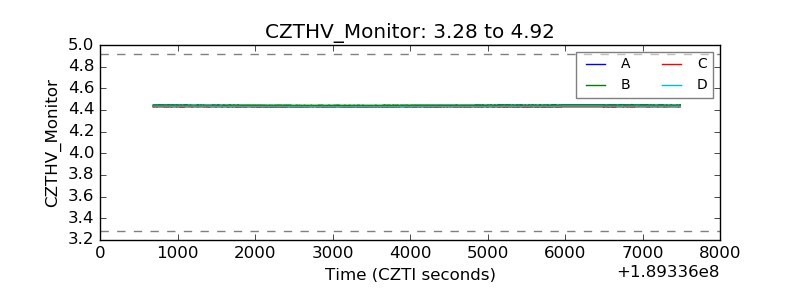 |
| D_VDD | 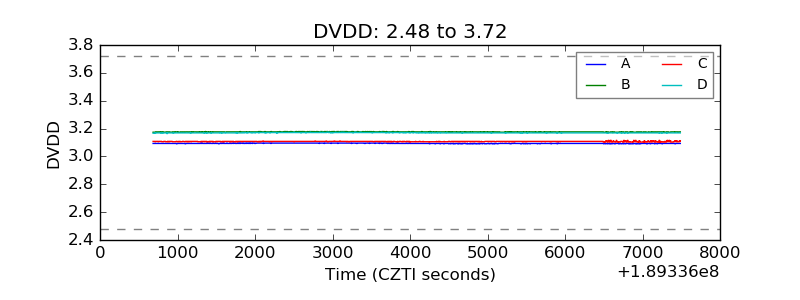 |
| Temperature 1 | 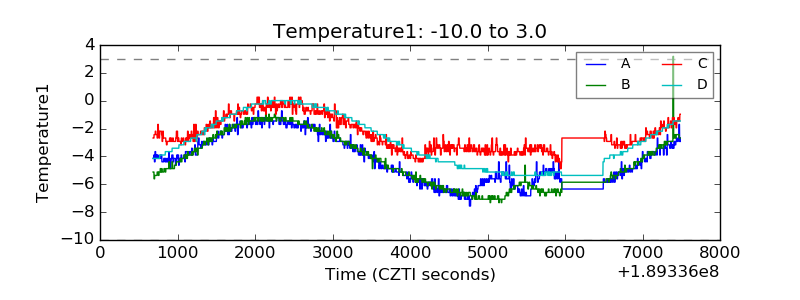 |
| Veto HV Monitor | 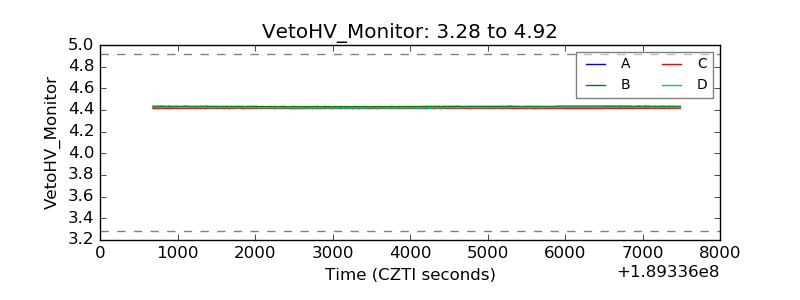 |
| Veto LLD | 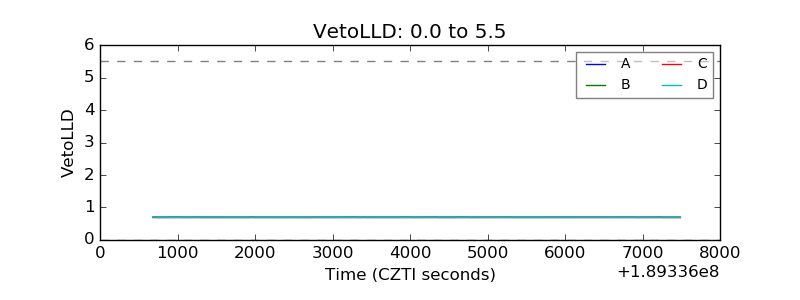 |
| Alpha Counter | 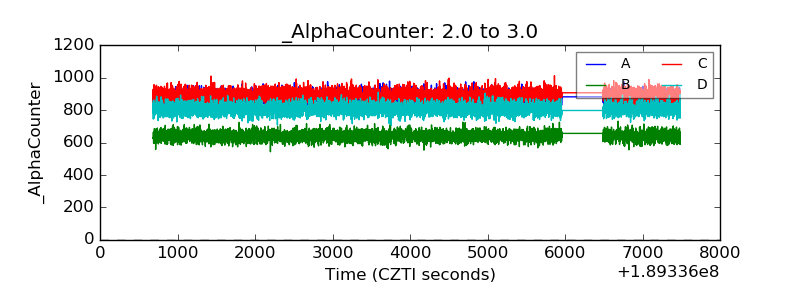 |
| _CPM_Rate | 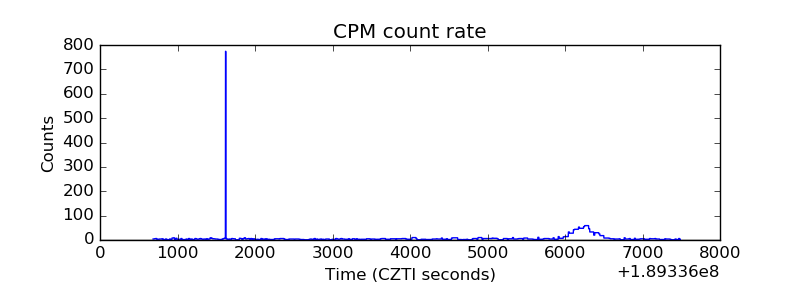 |
| CZT Counter | 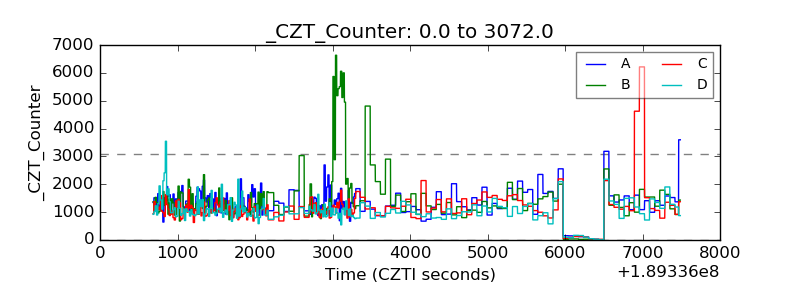 |
| +2.5 Volts monitor |  |
| +5 Volts monitor |  |
| _ROLL_ROT | 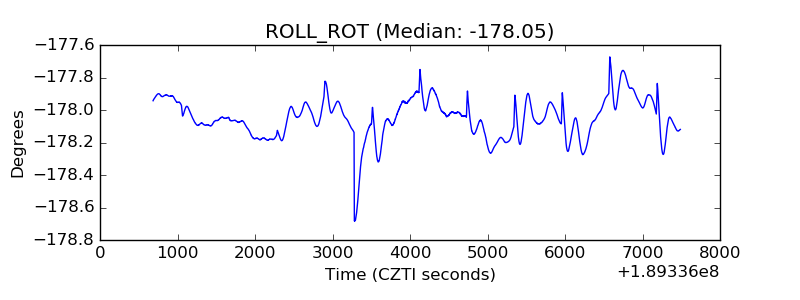 |
| _Roll_DEC | 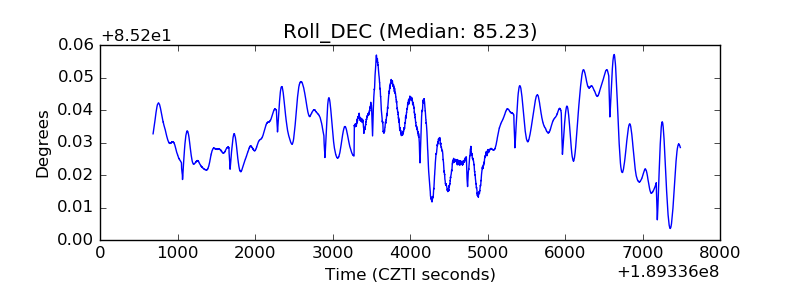 |
| _Roll_RA | 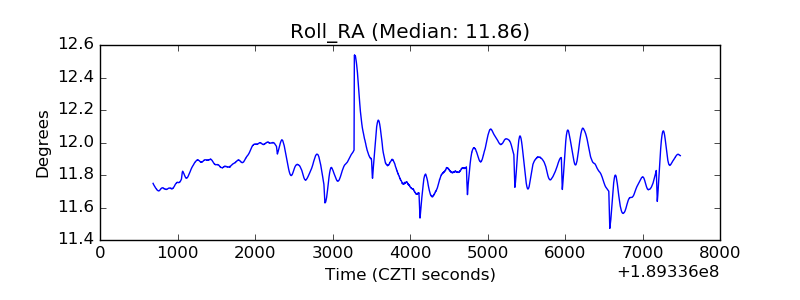 |
| Veto Counter | 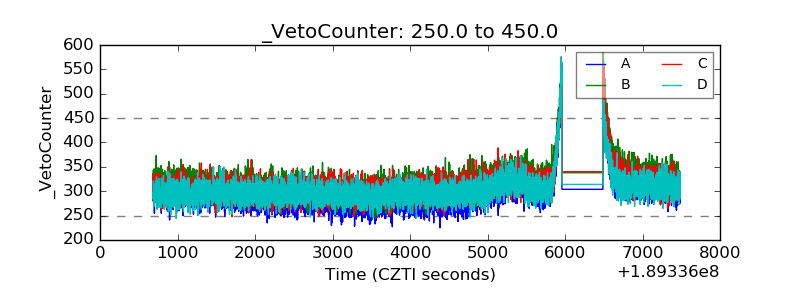 |