| Param | Original file | Final file |
|---|---|---|
| Filename | modeM0/AS1G04_003T01_9000000234_01412cztM0_level2.evt | modeM0/AS1G04_003T01_9000000234_01412cztM0_level2_quad_clean.evt |
| Size (bytes) | 107,835,840 | 8,720,640 |
| Size | 102.8 MB | 8.3 MB |
| Events in quadrant A | 1,049,869 | 52,647 |
| Events in quadrant B | 835,839 | 55,907 |
| Events in quadrant C | 682,307 | 53,968 |
| Events in quadrant D | 655,846 | 52,376 |
| Mode SS | |||
|---|---|---|---|
| Quadrant | BADHDUFLAG | Total packets | Discarded packets |
| A | 0 | 10 | 0 |
| B | 0 | 10 | 0 |
| C | 0 | 10 | 0 |
| D | 0 | 10 | 0 |
| Mode M0 | |||
|---|---|---|---|
| Quadrant | BADHDUFLAG | Total packets | Discarded packets |
| A | 0 | 3537 | 0 |
| B | 0 | 2892 | 0 |
| C | 0 | 2435 | 0 |
| D | 0 | 2359 | 0 |
| Quadrant | Total seconds | Saturated seconds | Saturation percentage |
|---|---|---|---|
| A | 589 | 17 | 2.886248% |
| B | 589 | 1 | 0.169779% |
| C | 589 | 0 | 0.000000% |
| D | 589 | 0 | 0.000000% |
Noise dominated data is calculated using 1-second bins in cleaned event files. If a bin has >2000 counts, and if more than 50% of those come from <1% of pixels, then it is considered to be noise-dominated and hence unusable.
| Quadrant | # 1 sec bins | Bins with >0 counts | Bins with >2000 counts | High rate bins dominated by noise | Noise dominated (total time) | Noise dominated (detector-on time) | Marked lightcurve |
|---|---|---|---|---|---|---|---|
| A | 589 | 589 | 161 | 161 | 27.33% | 27.33% | 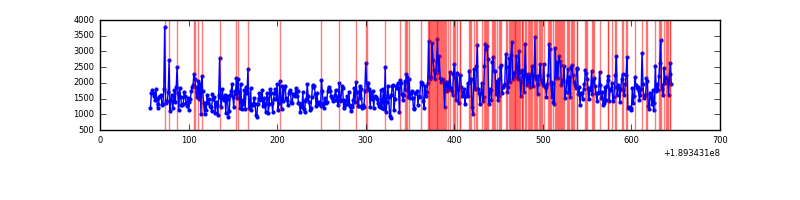 |
| B | 589 | 589 | 37 | 37 | 6.28% | 6.28% | 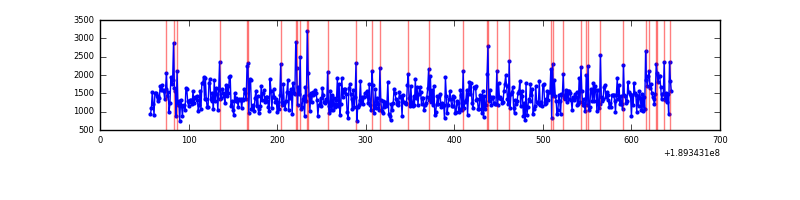 |
| C | 589 | 589 | 8 | 8 | 1.36% | 1.36% | 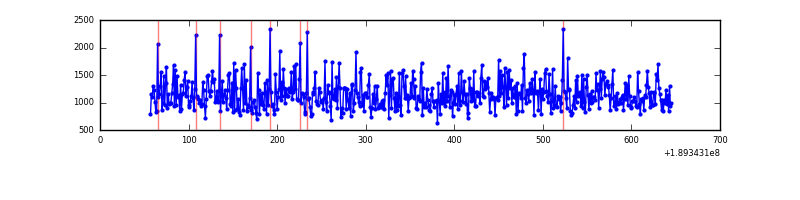 |
| D | 589 | 589 | 3 | 3 | 0.51% | 0.51% | 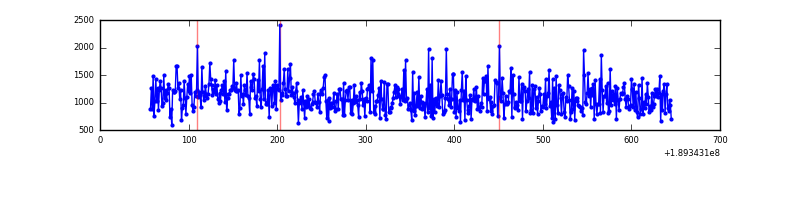 |
Top three noisy pixels from each quadrant. If the there are fewer than three noisy pixels in the level2.evt file, extra rows are filled as -1
| Pixel properties | Quadrant properties | ||||||
|---|---|---|---|---|---|---|---|
| Quadrant | DetID | PixID | Counts | Sigma | Mean | Median | Sigma |
| A | 15 | 127 | 244531 | 5059.83 | 191 | 193 | 48.3 |
| A | 4 | 32 | 64139 | 1324.22 | 191 | 193 | 48.3 |
| A | 12 | 251 | 4280 | 84.63 | 191 | 193 | 48.3 |
| B | 12 | 52 | 53801 | 1108.09 | 191 | 193 | 48.4 |
| B | 6 | 53 | 19479 | 398.65 | 191 | 193 | 48.4 |
| B | 15 | 22 | 17364 | 354.93 | 191 | 193 | 48.4 |
| C | 15 | 241 | 24312 | 492.67 | 167 | 172 | 49.0 |
| C | 3 | 111 | 2322 | 43.88 | 167 | 172 | 49.0 |
| C | 3 | 79 | 2062 | 38.57 | 167 | 172 | 49.0 |
| D | 13 | 138 | 16228 | 296.49 | 166 | 170 | 54.2 |
| D | 13 | 205 | 7244 | 130.61 | 166 | 170 | 54.2 |
| D | 2 | 88 | 3466 | 60.86 | 166 | 170 | 54.2 |
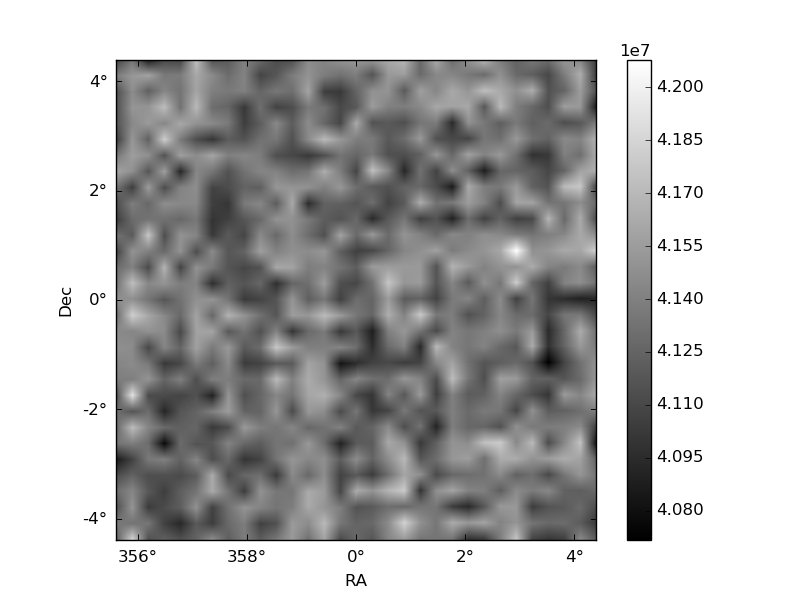
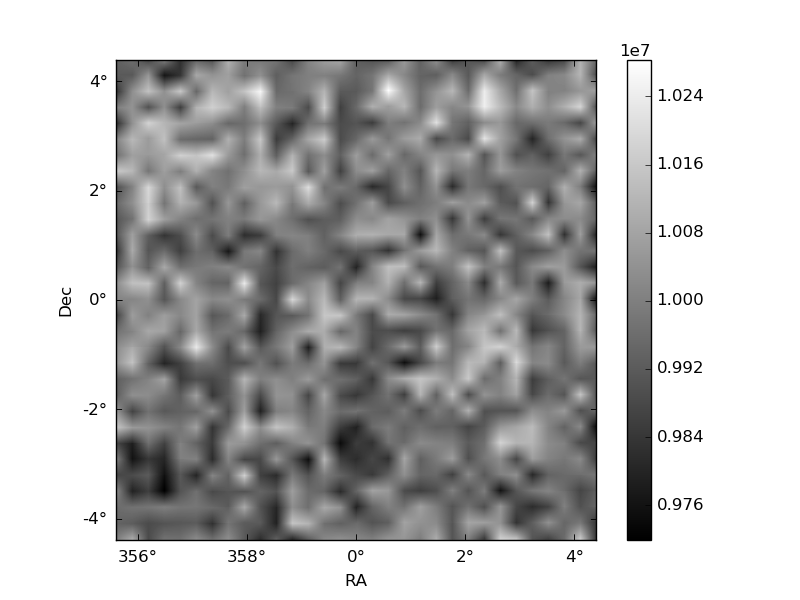
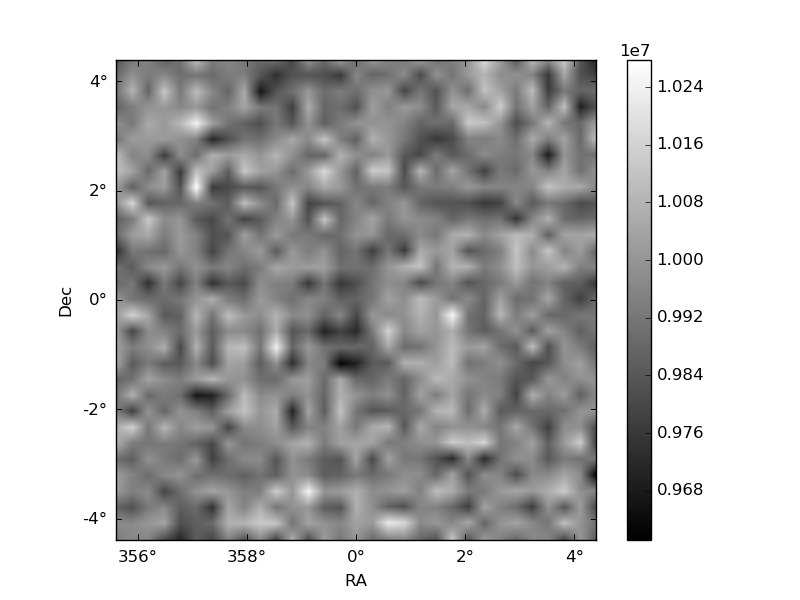
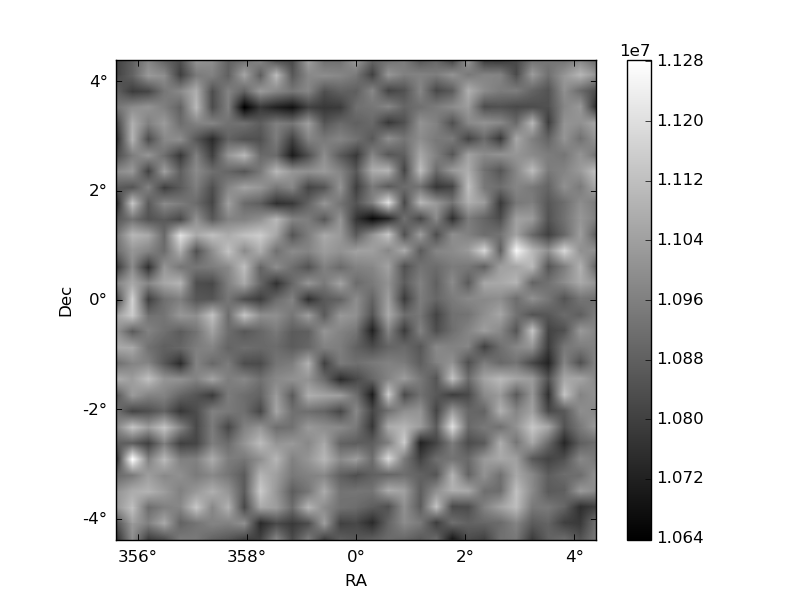
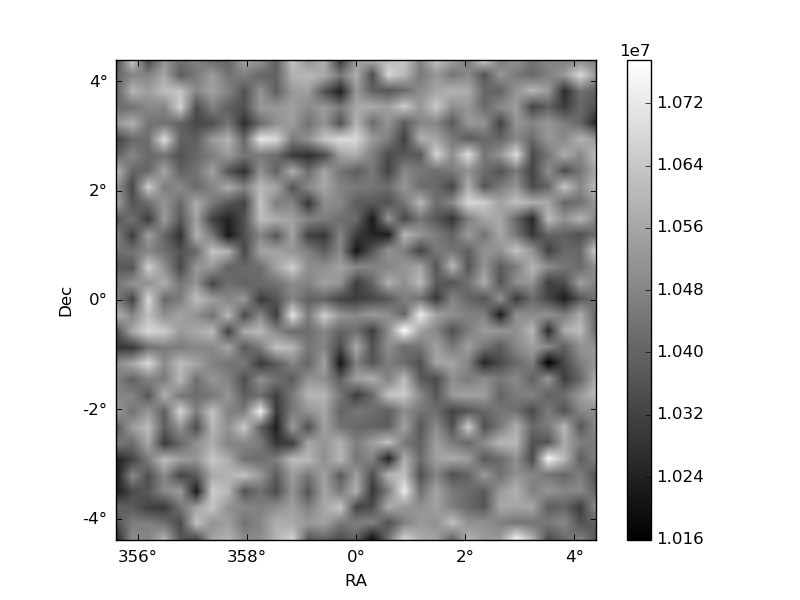
Histogram calculated using DETX and DETY for each event in the final _common_clean file
| Quadrant A | 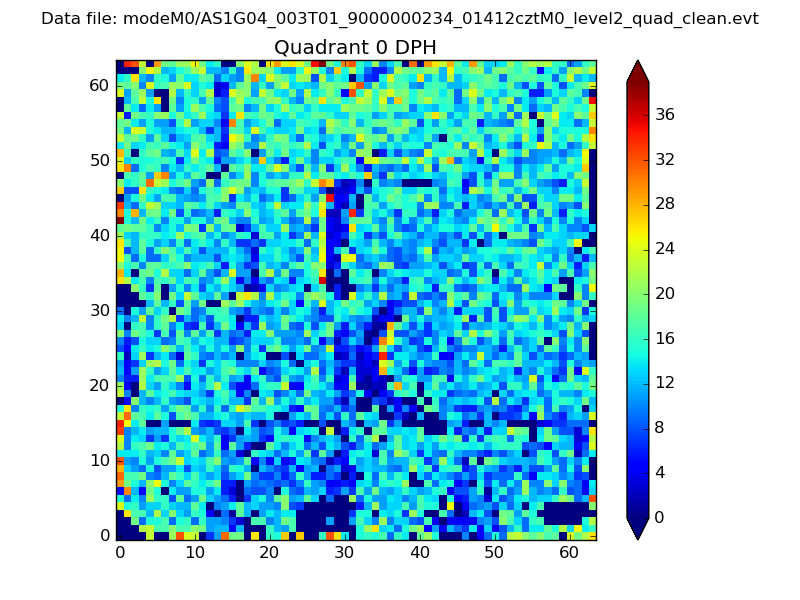 |
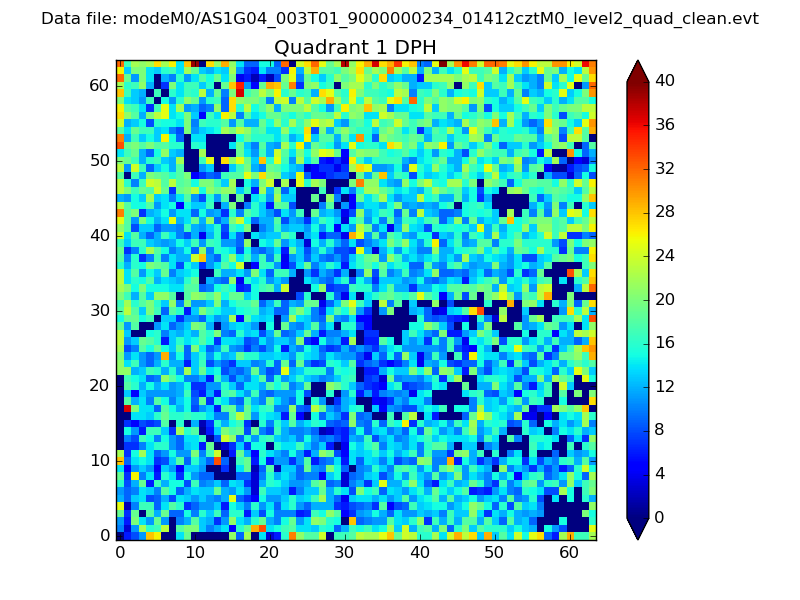 |
Quadrant B |
|---|---|---|---|
| Quadrant D | 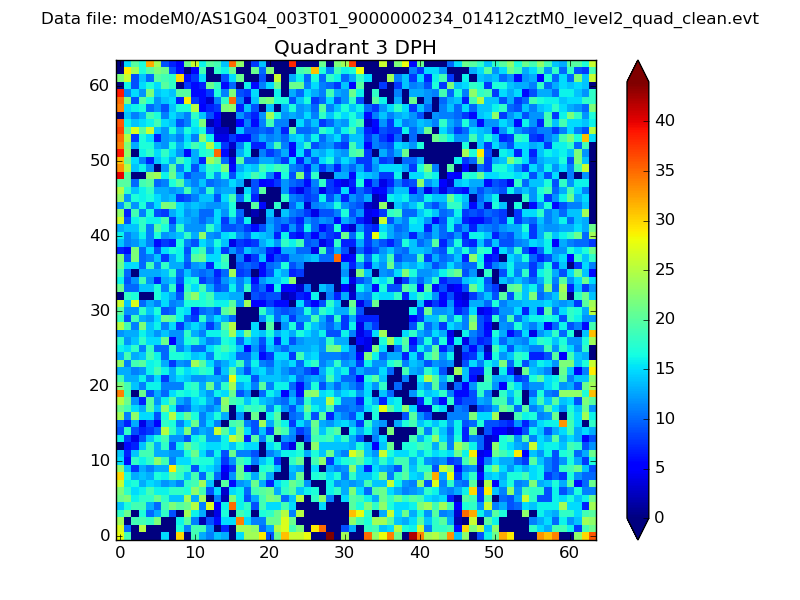 |
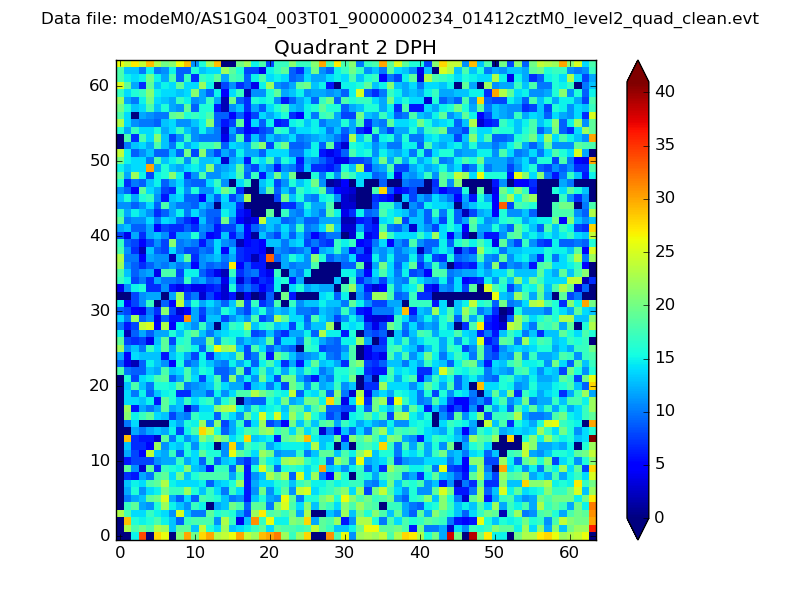 |
Quadrant C |
| Plot type | Count rate plots | Images |
|---|---|---|
| Comparison with Poisson distribution Blue bars denote a histogram of data divided into 1 sec bins. Red curve is a Poisson curve with rate = median count rate of data. |
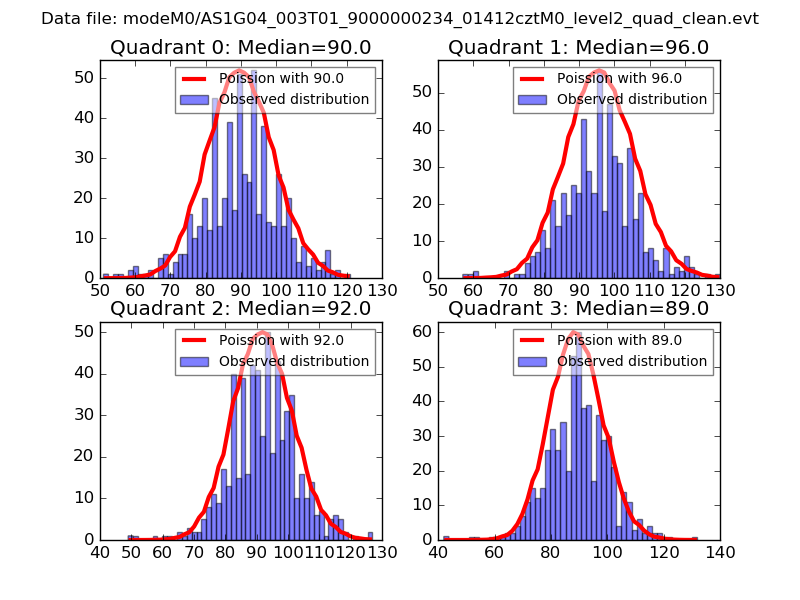 |
 |
| Quadrant-wise count rates Data is divided into 100 sec bins |
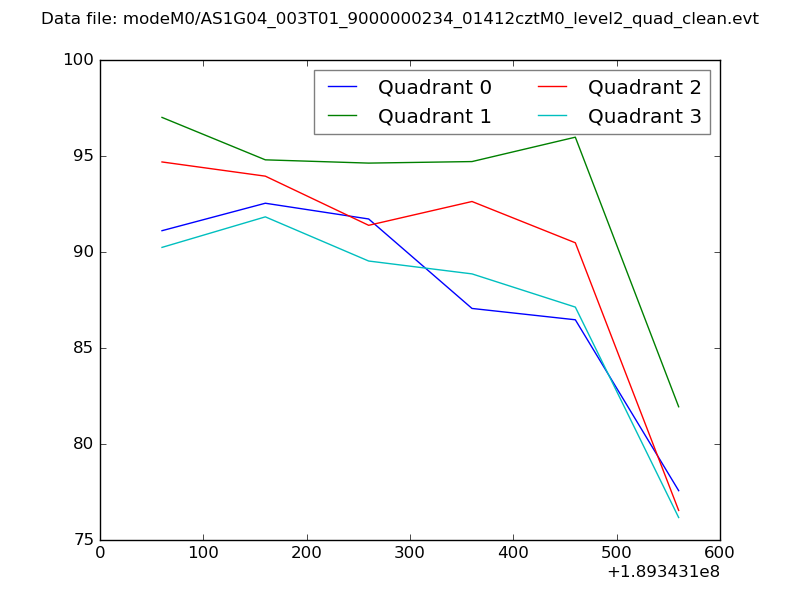 |
|
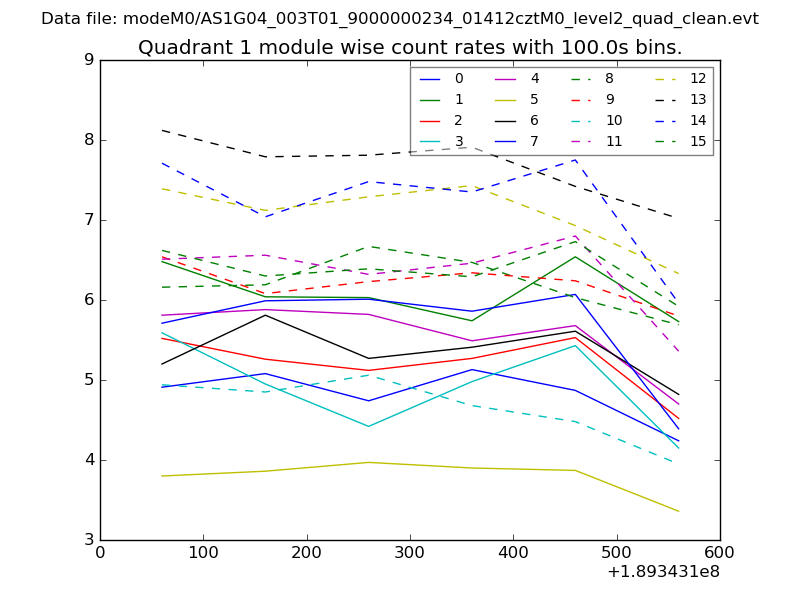
| Module-wise count rates for Quadrant A Data is divided into 100 sec bins |
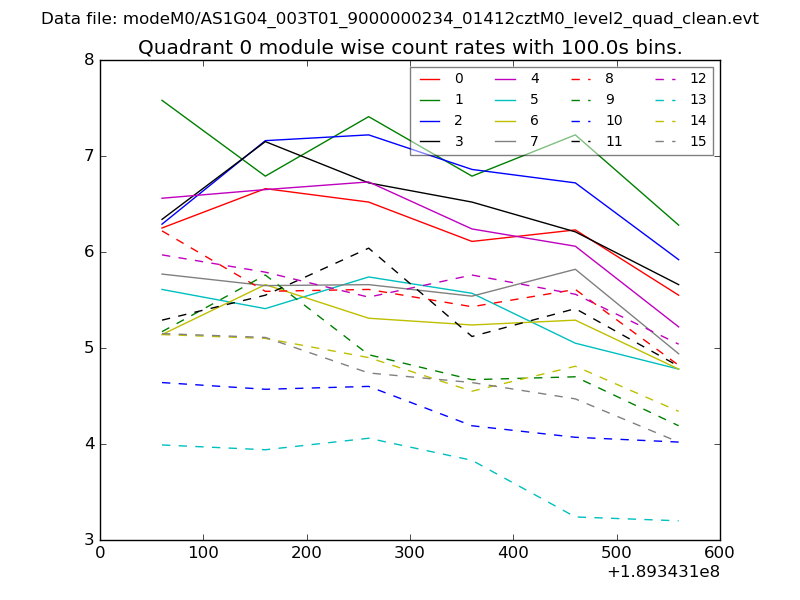 |
 |
| Module-wise count rates for Quadrant B Data is divided into 100 sec bins |
 |
 |
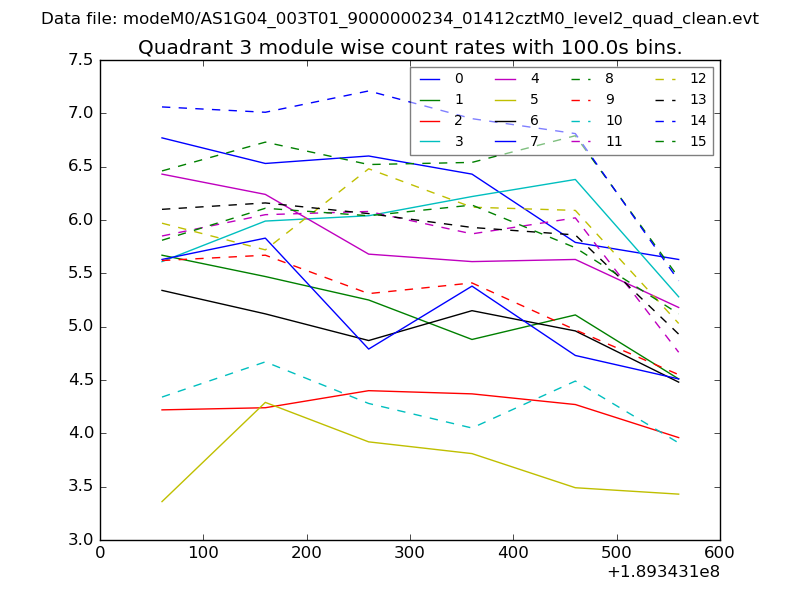
| Module-wise count rates for Quadrant C Data is divided into 100 sec bins |
 |
 |
| Module-wise count rates for Quadrant D Data is divided into 100 sec bins |
 |
 |
| Parameter | Plot |
|---|---|
| CZT HV Monitor |  |
| D_VDD | 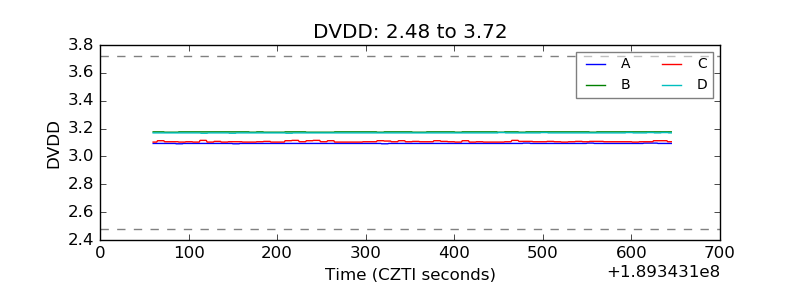 |
| Temperature 1 | 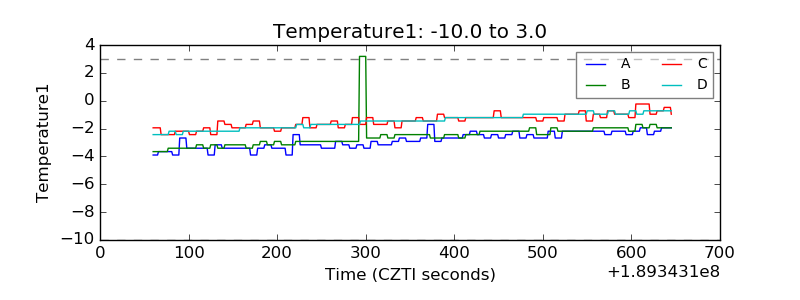 |
| Veto HV Monitor | 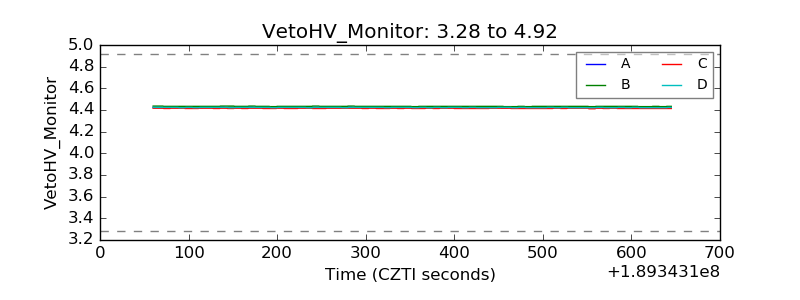 |
| Veto LLD | 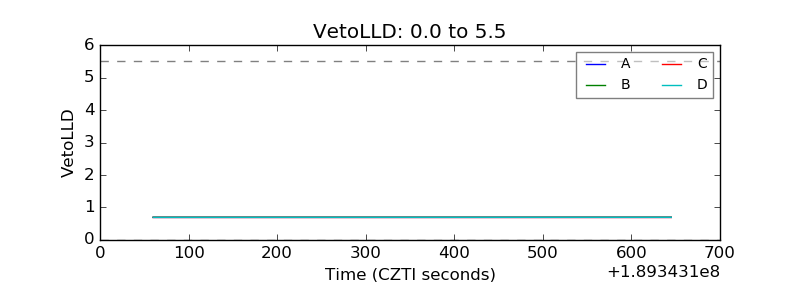 |
| Alpha Counter | 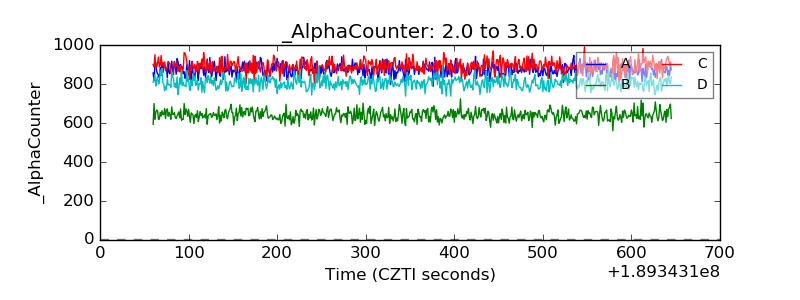 |
| _CPM_Rate | 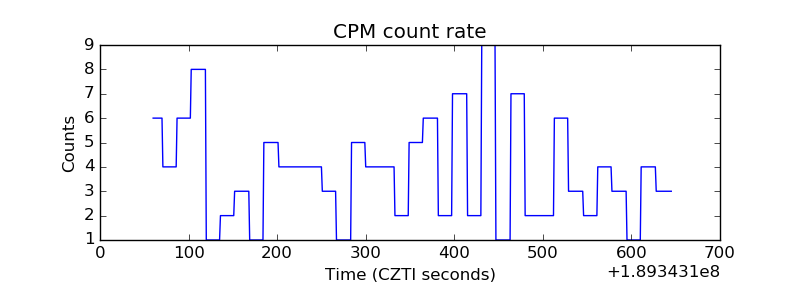 |
| CZT Counter | 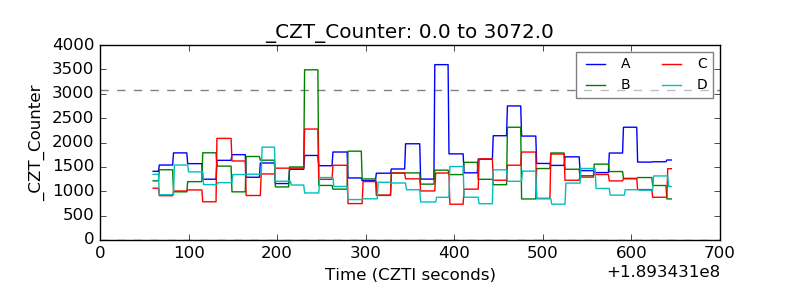 |
| +2.5 Volts monitor |  |
| +5 Volts monitor | 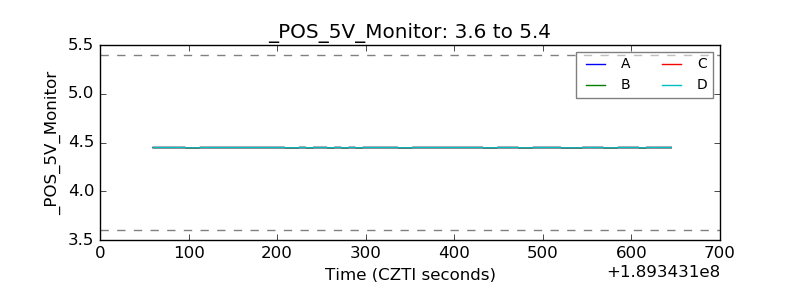 |
| _ROLL_ROT | 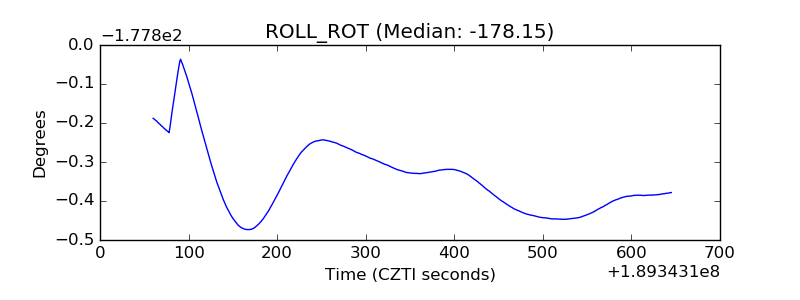 |
| _Roll_DEC | 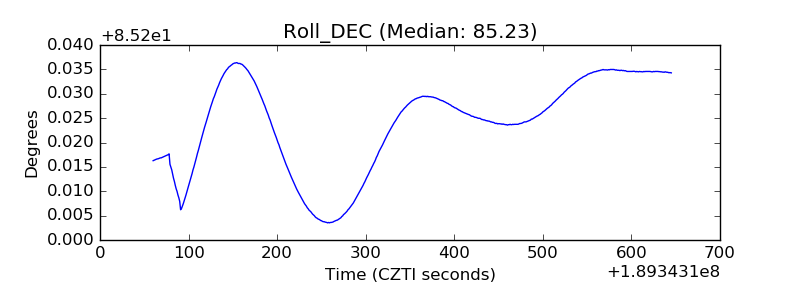 |
| _Roll_RA | 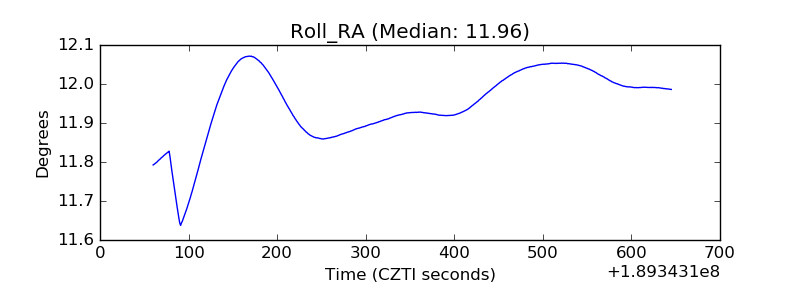 |
| Veto Counter | 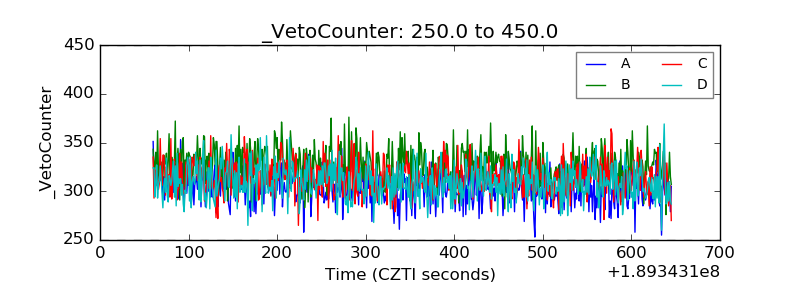 |